Abstract
Purpose
The purpose of this study was to test the hypothesis that the volume of primary orthotopic human choroidal melanoma xenografts can be quantified noninvasively in the same nude rat over time using a portable, high-resolution, high-frequency ultrasound (HF-US) system.
Methods
C918 human choroidal melanoma spheroids were implanted in the superior suprachoroidal space of 26 WAG/RijHsd-rnu nude rats. Fourteen rats were anesthetized 14 days after tumor implantation, and HF-US B-scan images of the tumor-bearing eye were captured at 250-μm intervals. Tumor areas were measured on each image and numerically integrated to calculate volume. Tumor volumes were also estimated from serial histologic sections in six rats. Twelve other rats were anesthetized and weighed every 4 to 5 days after implantation for 2 weeks, and HF-US B-scan image series were acquired for subsequent measurement of tumor volume.
Results
Tumors could be visualized as heterogeneous, relatively hyperechoic regions in the superior portion of the eye. These regions were verified as tumor by comparison with histologic sections, and histologic and HF-US volumes were highly correlated (r = 0.961; P = 0.002). For the determination of HF-US volume, the intraobserver variability was 9.7% ± 5.1% (n = 8), and the coefficient of variation for multiple measurements was 12.1% ± 6.8% (n = 12). Tumor volume could be repeatedly measured in the same rat every 4 to 5 days for 2 weeks without significant weight loss.
Conclusions
HF-US is a safe, practical method to measure tumor volume in the same nude rat over time in this orthotopic xenograft model of human choroidal melanoma.
The annual incidence of intraocular melanoma in the Western world is approximately 6 cases per million.1 It is the most common intraocular malignancy in adults, accounting for 70% of all adult primary eye cancers.2 Approximately 30% of patients with choroidal melanoma die of metastatic disease within 5 years of diagnosis.3,4
In the past several decades, treatment of uveal melanoma has focused on sparing vision while controlling local tumor growth. Although large tumors are still typically treated by enucleation, medium-sized tumors are now usually treated by radiation therapy or some other eye-sparing treatment.5 Despite the continuing debate about whether small choroidal melanomas should be treated or observed for further growth,6,7 there is a growing trend to treat small uveal melanomas if they present multiple clinical risk factors.5,8 Although eye-sparing therapies such as radiation are equivalent to enucleation in terms of long-term survival,9 these treatments do not always succeed in saving patient vision. Recently, two large studies showed that 3 or 5 years after plaque radiotherapy, only 55% to 66% of all patients maintain visual acuity better than 20/200.10,11
These considerations highlight the need for more effective, vision-sparing treatments of primary uveal melanomas that can be used alone or as adjunctive therapy. Development of effective new therapies will require testing in animal models of primary uveal melanoma. Testing of anticancer therapies usually involves the performance of standard tumor growth delay studies, in which tumor size is monitored before and during a specific treatment.12,13 Such a study would require a noninvasive method to follow the growth of primary orthotopic choroidal melanomas in animal models.
Several orthotopic models of human choroidal melanoma have been developed by implanting human choroidal melanoma tissue or cells into the suprachoroidal space of either the immunosuppressed rabbit14-18 or the immunocompromised mouse.19-23 We recently described an orthotopic model of human choroidal melanoma in the nude, athymic rat.24 Methods are available to estimate tumor size noninvasively in these models, including fundus photography,15,16,18 standard ultrasonography,15,16 and magnetic resonance imaging.15,25,26 Unfortunately, it is difficult to perform multiple, serial measurements in athymic rodents with these techniques. Given that repeated removal of nude athymic animals from their housing facility is prohibited by most animal investigation committees, all equipment used to monitor growth must be kept in the facility or be easily transportable. More important, any system must be able to be used in a hood to maintain sterility. These are serious limitations to most imaging methods.
Recently, portable, high-resolution high-frequency ultrasound (HF-US) systems have become available to image small animals. These include the HF-US system for small animal research (model MHF-1; E-Technologies, Inc., Bettendorf, IA) and the VisualSonics Vevo 770 (VisualSonics, Inc., Toronto, ON, Canada). In this study, we hypothesized that the MHF-1 HF-US system could be used to safely and noninvasively estimate the volume of primary orthotopic choroidal melanoma xenografts repeatedly in the same nude rat.
Materials and Methods
Animals
The mutant rat strain WAG/RijHsd-rnu was used in this study because these rats are athymic and permit the xenotransplantation of human tumor tissue into the choroid.24WAG/RijHsd-rnu rats were bred and housed in the Department of Laboratory Animal Resources (DLAR) facility at Wayne State University. All procedures were in accordance with the ARVO Statement for the Use of Animals in Ophthalmic and Vision Research and were approved by the Wayne State University Animal Investigation Committee.
Human Choroidal Melanoma Cell Line
We used the human choroidal melanoma cell line C918. This cell line was derived from a patient tumor at the University of Iowa in the 1990s.27 The cells were maintained in RPMI medium + 10% fetal bovine serum + antibiotic. We previously demonstrated the ability of these cells to reliably generate tumor xenografts in the choroid of WAG/RijHsd-rnu nude, athymic rats.24
Growth of Orthotopic Human Choroidal Melanoma Xenografts
C918 spheroids were grown and implanted into the suprachoroidal space of 26 rats as detailed previously.24 C918 tumor spheroids (three-dimensional aggregations of tumor cells) were grown in Petri dishes on 1% agar using a modified version of the method described by Yuhas et al.28 Spheroids were implanted into the choroid when they measured 200 to 500 μm in diameter. Tumor implantation was performed under sterile conditions in a BSL2 safety hood in the Wayne State DLAR facility. Rats were anesthetized with a ketamine/xylazine mixture (60/6 mg/kg administered intraperitoneally), and proparacaine HCl (0.5%) was applied topically to the right eye as local anesthesia. The rat was placed on a heating pad under an operating microscope, and approximately five tumor spheroids in ≤1 μL medium were injected into the suprachoroidal space with a 5-μL Hamilton glass syringe (model ref. 65RNR; Hamilton Co., Reno, NV) equipped with a ¾-inch long beveled 32-gauge needle (catalog ref. 0160832, point style 4; Hamilton Co.). Antibiotic ointment was applied to the eye, and the rat was allowed to recover on the heating blanket before it was returned to its cage.
Ultrasound Imaging of Rat Eyes
HF-US imaging was performed under aseptic conditions in a laminar flow hood in the nude rat housing room at the DLAR facility. Before each imaging session, rats were anesthetized with a ketamine/xylazine mixture (40/4 mg/kg administered intraperitoneally) and were placed on a sterile pad over a heating blanket. After topical application of 0.5% proparacaine HCl, the superior surface of the right eye was partially exposed using a stainless steel speculum. The hand-held, high-resolution HF-US system for small animal research (model MHF-1; E-Technologies, Inc.) was used to obtain B-scan ultrasound images of the right eye bearing the human choroidal melanoma xenograft. The MHF-1 features a lightweight probe with a 35-MHz transducer (P60-G water path probe; Paradigm Medical, Gardena, CA) and includes a probe attachment (nosepiece) that permits direct contact of a sterile membrane with the tissue. Different nosepieces are available to provide different offsets and allow the scan to be focused at a given depth. The scan angle (sweep) can be changed using the accompanying software. The probe was attached to a manipulator that permitted three-dimensional orthogonal motion of the probe head (E-Tech Manual Baseplate System; ALA Scientific Instruments, Inc., Westbury, NY). In preliminary studies, we found that a sweep angle of 10° and a probe nosepiece with a 6-mm offset yielded the best images of the rat eye. Before each rat was imaged, the membrane was soaked in an activated dialdehyde solution (Cidex OPA; ASP, Irvine, CA) for at least 10 minutes so that it could be disinfected. As suggested by the manufacturer, a value of 1532 m/s was used as the speed of sound in axial dimension calculations. This is in the range of standard values for the speed of sound in biological tissues.
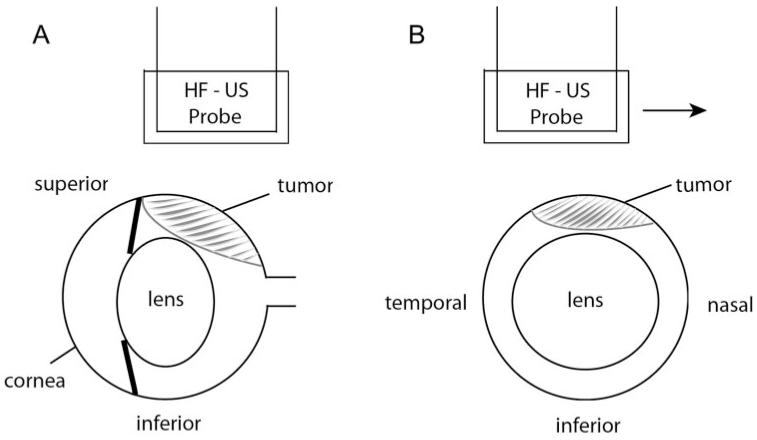
To image the ocular tumor, sterile ultrasound gel (Aquasonic 100; Parker Laboratories, Fairfield, NJ) was placed on the eye, and the membrane-covered probe was positioned over the gel (Fig. 1). The probe was oriented so that the cornea was to the left of the B-scan image, and the probe was moved vertically until the sclera and lens were visible. The probe was then moved to the temporal edge of the eye, and an image was captured using the accompanying software. The probe was moved nasally in 250-μm steps using the micromanipulator, and images were captured at each step. We attempted to record at least three such image series across the eye during each imaging session. All images were stored for future analysis.
Figure 1.
Schematic of the HF-US scanning procedure. Ultrasound gel is placed between the probe head and the superior surface of the eye. (A) Sagittal view showing position of HF-US probe over the superior portion of the right eye. This would be the plane of the scan; HF-US images appear in this orientation. The probe would be moved in 250-μm steps out of the plane of the paper. (B) Coronal view through the center of the eye showing the direction of the probe movement (arrow, temporonasal direction).
To evaluate the ability of the high-resolution HF-US system to image tumors in vivo, tumor-bearing right eyes were imaged on day 14 after implantation in 14 rats. The ability to serially image tumors in the same rat using HF-US was tested in another 12 rats, in which tumors were imaged on days 5, 9, and 14 after tumor implantation. At the end of all studies, the rats were humanely killed, and the tumor-bearing right eyes were enucleated, fixed in 10% formalin, and embedded in paraffin for possible future histologic evaluation.
Determination of Tumor Volume from Ultrasound Images
The series of scans saved by the E-Technologies software were converted into tiff images using a program written and run in analytical software (MatLab; MathWorks, Natick, MA). The images were loaded as a stack into imaging software (Scion Image; Scion Corporation, Frederick, MD), and the relatively hyperechoic region on each image was measured using the accompanying outlining tools. The areas were saved in a data file that was used as input for a computer program (MatLab; MathWorks) that calculated tumor volume by numerically integrating the areas using Simpson’s ⅓ rule, Simpson’s ⅜ rule, or the trapezoidal rule, depending on the number of images available for analysis. For each imaging session, one to five series of images were analyzed, and the average volume was used as the tumor volume for that day.
Before the start of the study, the observer practiced identifying the tumor on HF-US images. Comparisons of HF-US B-scans and corresponding histologic sections were used to help distinguish tumor from neighboring normal ocular tissue. The appearance of the sclera on an HF-US scan was observed from HF-US scans of normal rat eyes. After this training, the areas from individual HF-US scans included in the study were calculated.
Estimation of Tumor Volume from Histologic Sections
To estimate the volume of human choroidal melanoma xenografts from histologic sections, serial 10-μm sections were cut from a paraffin block of six tumor-bearing eyes that were embedded after 14 days of tumor growth. Every third slide was stained with hematoxylin and eosin using a standard protocol. Slides were viewed under a microscope (Axiophot; Zeiss, Thornwood, NY), and tumor-containing sections were identified. Sections separated by 200 to 400 μm were photographed with a digital camera (Axiocam; Zeiss) and software. Tumor areas were measured from the digitized images using imaging software (Scion Image; Scion Corporation), and the volume was calculated using the same software described for the analysis of the HF-US images.
Statistical Analysis
Because all compared data passed normality tests, statistical comparisons were made using standard parametric tests. Rat weights and tumor volumes at different time points were compared using a Student’s paired t-test. Volumes determined from histologic sections and HF-US images were compared using standard linear regression. In all tests, P < 0.05 was considered statistically significant.
Results
High-Frequency Ultrasound Imaging of C918 Human Choroidal Melanoma Xenografts
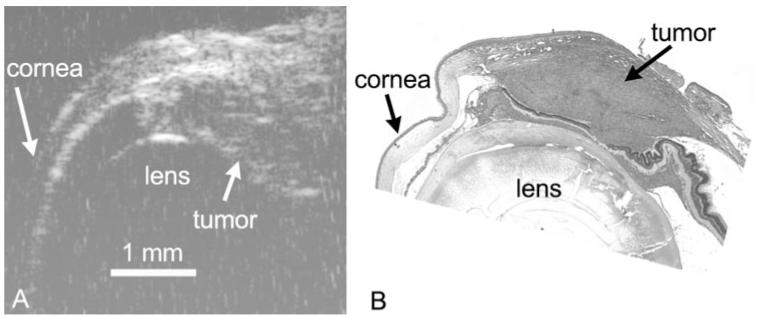
C918 xenografts appeared as relatively hyperechoic regions beneath the superior sclera (Fig. 2A). The superior portion of the cornea could also be imaged, and the border of the lens appeared as a hyperintense arc in the center of the eyes. Tumor images were heterogeneous and often showed evidence of some structural detail (Fig. 2A). The hyperechoic region could be identified histologically as tumor (Fig. 2B).
Figure 2.
HF-US image (A) and corresponding hematoxylin and eosin section (B) of the same C918 choroidal melanoma xenograft grown for 2 weeks. Images are taken from similar regions of the tumor at the same magnification. Scale bar, 1 mm.
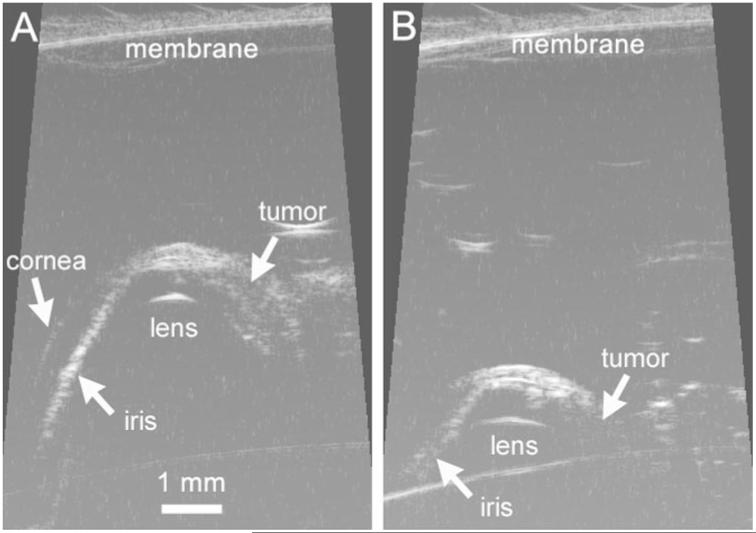
Because the penetration depth was limited by use of a 35-MHz probe, a key imaging parameter was the distance of the membrane from the surface of the superior sclera (Fig. 1). In several rats early in the study, we tested the effect of probe distance from the eye on the calculated volume. As shown in Figure 3, if the probe head was more than 5 mm from the eye, the penetration depth was limited, and the volume was under-estimated. Any images collected with a membrane-sclera distance greater than 5 mm were not included in subsequent analysis. Thereafter, we attempted to position the probe 3 mm or less from the eye, but this was not always possible. The ability to position the probe was dependent on how well the eye was proptosed and on the position of the speculum. Fortunately, eyes with larger tumors were often more easily proptosed, which permitted the probe to be moved closer to the surface of the eye and resulted in deeper scan penetration. For all 156 image series collected in the study, the probe was positioned 3.19 ± 0.85 mm from the nearest point of the sclera (range, 1.3–4.6 mm; n = 156).
Figure 3.
HF-US images from the same tumor-bearing eye with the probe membrane positioned either 3.6 mm (A) or 5.6 mm (B) above the superior surface of the eye. Calculated volumes from these two series were 2.34 mm3 (A) and 1.13 mm3 (B).
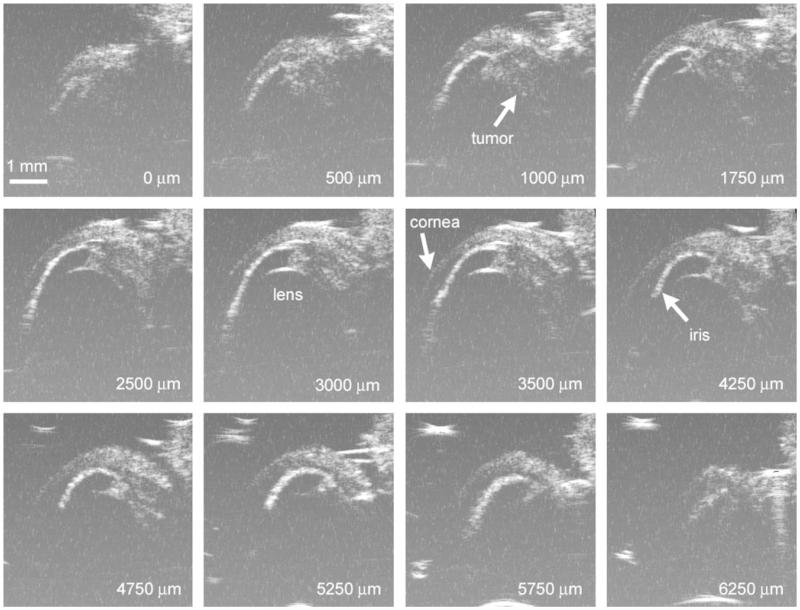
As the probe was moved nasally across the right eye in 250-μm steps (Fig. 1), the hyperechoic region changed in size (Fig. 4). In early studies, we sometimes acquired five or more series of images during each measurement session because we were attempting to determine the optimal scanning parameters. Eventually, we decided to obtain three series of images, which would permit us to obtain an average value of the tumor volume. During some measurement sessions, we were unable to obtain three series because the rat awoke from anesthesia after the first or second scan series. During this study, one to five series of scans were recorded per measurement session, with an average of 3.1 ± 1.0 series (n = 50 sessions). A series consisted of 28.2 ± 2.8 individual B-scan images (n = 156 series; range, 21–37 B-scans), for a total scanning distance of 7.0 ± 0.7 mm. This ensured that the series captured images across the entire eye, which was approximately 6 mm in diameter. A single such series took only 2 to 3 minutes to capture.
Figure 4.
Representative HF-US images of C918 xenograft in right eye of a rat 14 days after spheroid implantation. The superior portion of the globe is toward the top of the images, and the cornea is at the left. The number in each panel is the relative position as the probe head was moved nasally. The complete series consisted of 26 images.
Tumor Volume Measurement by HF-US
Tumor volume was calculated from series of images such as those shown in Figure 4. In our study on tumor volume after 2 weeks of growth, tumor was evident in, on average, 21 (20.6 ± 3.9 scans; n = 41 series) of the 28 consecutive B-scans constituting a scan series. This translated to a distance of 5.15 ± 0.98 mm in the temporonasal direction. The average C918 volume after 2 weeks was 4.04 ± 1.97 mm3 (n = 14 rats).
When more than one image series could be collected (12 of 14), SD of the volume measurements could be calculated. The interseries coefficient of variation (relative SD) was independent of the tumor size, and its mean value was 12.1% ± 6.8% (n = 12). To evaluate the intraobserver variability, eight image series were analyzed by the same observer on three different days in a blinded fashion. The mean intraobserver coefficient of variation was 9.7% ± 5.1% (n = 8).
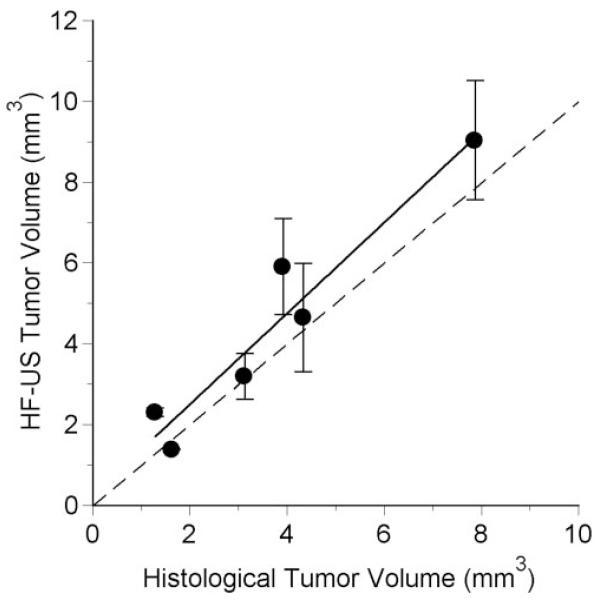
In six rats, tumor volume after 14 days of growth was also estimated from histologic sections. The volumes calculated by the two techniques were significantly correlated (r = 0.961; P = 0.002), though the HF-US volumes tended to be larger (Fig. 5).
Figure 5.
Volume determined from HF-US images as a function of the corresponding volume estimated from histologic sections. Error bars show the standard deviations for measurements from 2 to 5 image series. The dashed line is the identity line. The solid line is the regression line: HF-US volume (mm3) = 1.126 (histologic volume) + 0.255, r2 = 0.923, n = 6, P = 0.002.
Repeated Measurement of Tumor Volume in the Same Rat
It was possible to safely and repeatedly image the tumor-bearing eye of all 12 rats every 4 to 5 days for 2 weeks. Tumor was evident in 14.8 ± 3.6 scans (n = 115 series; range, 7-24). This translated into a distance of 3.70 ± 0.89 mm in the temporonasal direction.
The appearance of the tumor changed with each imaging session (Fig. 6). Immediately after implantation, the spheroids were usually visible as a small relatively hyperechoic mass (day 0). As early as 5 days after spheroid implantation, HF-US revealed the tumors as an organized mass. When the eye was imaged on later days, the tumor showed evidence of further growth.
Figure 6.
HF-US images from the same tumor-bearing eye at different times after spheroid implantation. All images are from near the middle of the eye.
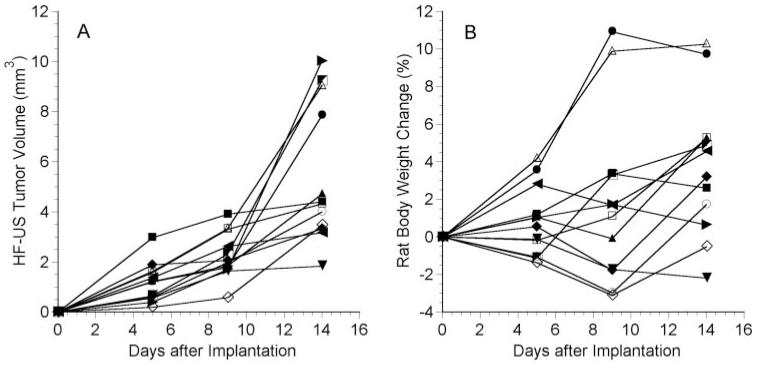
All 12 tumors showed evidence of growth over the 2-week period, though variability among the rats was noted (Fig. 7A). Six of the tumors began to grow exponentially by day 14, and the other six grew approximately linearly or showed a plateau in growth after 2 weeks. The average tumor volumes on days 5, 9, and 14 after implantation were 1.19 ± 0.78 mm3, 2.28 ± 0.90 mm3, and 5.45 ± 2.79 mm3 (n = 12), respectively. The volume on a given day was significantly larger than the volume from the previous measurement session (P ≤ 0.002; n = 12). For all 26 rats in the study, the average C918 volume after 2 weeks was 4.69 ± 2.44 mm3 (n = 26).
Figure 7.
C918 tumor volume determined by HF-US (A) and change in rat body weight (B) as a function of time after implantation in 12 different rats. HF-US imaging was performed every 4 or 5 days for 2 weeks. Each symbol represents a different rat.
Anesthesia and handling of the rats every 4 to 5 days did not result in significant loss in body weight (Fig. 7B). The initial weight of the rats (n = 12) was 172 ± 25 g. The rats’ weights did not change on days 5 and 9 (P > 0.05) but had significantly increased to 179 ± 28 g by day 14 (P = 0.006).
Discussion
HF-US Imaging of C918 Human Choroidal Melanoma Xenografts
HF-US imaging of the rat eye permitted the visualization of human choroidal melanoma xenografts growing in the suprachoroidal space in this nude rat model at high resolution. The orthotopic xenografts were relatively hyperechoic compared with most other structures in the eye (Figs. 2, 4). The high-resolution images obtained in this study were heterogeneous in intensity and permitted discrimination of structures within the tumor, but the exact nature of these structures could not be determined.
Ultrasound has previously been used to image choroidal melanoma xenografts growing in the immunosuppressed rabbit,15,16,29 but typically tumors were only imaged at one time point. Recently, a three-dimensional VHF ultrasound system was used to measure tumor volume and ultrasound backscatter in athymic nude mice bearing orthotopic human choroidal melanoma M619 xenografts (Deobhakta AA, et al. IOVS 2006; 47:ARVO E-Abstract 4702). The present study is the first to present full series of high-resolution ultrasound images of an orthotopic human choroidal melanoma xenograft in the same animal at different time points.
The ability to measure sequences of high-resolution HF-US images of the xenograft in a short period is a major advantage of this system. It permitted multiple series of images to be collected while the rats were under short-lasting anesthesia, which could be repeated every 4 to 5 days for up to 2 weeks, with no significant weight loss. This speed of image acquisition is an advantage over some other imaging methods, such as magnetic resonance imaging. In addition, all these measurements could be performed in a sterile environment within the animal facility, minimizing the risk for infection in these immunocompromised rats and enabling us to follow tumor growth for 2 weeks. This would not have been possible with imaging modalities that do not use portable equipment or are not easily performed in a laminar flow hood.
Volume Measurement of C918 Human Choroidal Melanoma Xenografts
Series of HF-US images were used to calculate tumor volumes, which were similar to volumes determined from serial histologic sections. The volumes determined from the two methods were highly correlated, but the HF-US volumes tended to be larger (Fig. 5). This result is not too surprising because histologic sections are prone to shrinkage during processing and would be expected to result in smaller volumes than are found in vivo. Of course, it is also possible that the tumor area was slightly overestimated in individual HF-US scans. Although the boundary between the lens and the tumor was clearly delineated, the boundary between the tumor and the sclera was not always as definite. We attempted to minimize this error by training the observer early in the study to distinguish sclera from tumor based on B-scan images of normal eyes and comparison of HF-US tumor images and histology. It should also be noted that we could not distinguish the retina from the tumor in the HF-US scan, so the retina was typically included in the estimate of the tumor. This is evident in Figure 2.
After training, the reproducibility of the volume estimated by the same observer on the same series of B-scan images was very good. Mean intraobserver variability in this study was 9.7%, which is similar to the value of 7.7% found in a study measuring uveal melanoma volume in human patients using three-dimensional ultrasound.30
Typically we collected three series of HF-US images across the eye, permitting us to obtain an average tumor volume for each measurement session. The mean coefficient of variation was 12.1%. In a study using three-dimensional ultrasonography to estimate choroidal melanoma volumes in human patients, the interscan variability was 8.2%.30 Thus, the repeatability of our tumor volume measurements compares favorably with the human ultrasound measurements, especially considering the small size of the rat eye compared with the human eye.
Serial Volume Measurement of C918 Human Choroidal Melanoma Xenografts
The ability to measure tumor volume in the same rat every 4 to 5 days for 2 weeks is extremely important for future applications of this technique. It means that tumor growth can be followed serially in an individual animal without removing it from the sterile environment of the housing facility. In future studies, we will attempt to follow tumor growth in the same rat for longer than 2 weeks. Given the variability in C918 growth across tumors (Fig. 7A), tracking volume in the same rat over an extended period should permit us to perform standard tumor growth delay studies to evaluate new treatments of choroidal melanoma using fewer rats.
Summary
In summary, for the first time, we have serially estimated the volume of orthotopic human choroidal melanoma xenografts in an animal model using high-frequency ultrasonography. We showed that the tumor could be safely imaged in the rat every 4 to 5 days for 2 weeks and that tumor growth could be tracked in the same animal. This technique should be useful to perform standard tumor growth delay studies in this model and will permit the impact of various treatments of primary choroidal melanoma to be better evaluated.
Acknowledgments
The authors thank Mary Hendrix and Karla Daniels for kindly supplying the C918 cells. They also thank Kathy Baran and the rest of the Wayne State DLAR staff for assistance with the breeding and maintenance of the WAG/RijHsd-rnu rats, and Yaoying Wang for assistance in the production of the HF-US schematic.
Supported by National Eye Institute Grant R03EY016795 (RDB) and National Eye Institute Departmental Core Grant P30EY04068 to the Department of Anatomy and Cell Biology.
Footnotes
Disclosure: R.D. Braun, None; K.S. Vistisen, None
References
- 1.Egan KM, Seddon JM, Glynn RJ, Gragoudas ES, Albert DM. Epidemiologic aspects of uveal melanoma. Surv Ophthalmol. 1988;32:239–251. doi: 10.1016/0039-6257(88)90173-7. [DOI] [PubMed] [Google Scholar]
- 2.Sahel JA, Albert DM. Intraocular melanomas. Cancer Treat Res. 1993;65:161–199. doi: 10.1007/978-1-4615-3080-0_7. [DOI] [PubMed] [Google Scholar]
- 3.Gamel JW, McLean IW, McCurdy JB. Biologic distinctions between cure and time to death in 2892 patients with intraocular melanoma. Cancer. 1993;71:2299–2305. doi: 10.1002/1097-0142(19930401)71:7<2299::aid-cncr2820710721>3.0.co;2-g. [DOI] [PubMed] [Google Scholar]
- 4.McLean IW, Foster WD, Zimmerman LE, Martin DG. Inferred natural history of uveal melanoma. Invest Ophthalmol Vis Sci. 1980;19:760–770. [PubMed] [Google Scholar]
- 5.Robertson DM. Changing concepts in the management of choroidal melanoma. Am J Ophthalmol. 2003;136:161–170. doi: 10.1016/s0002-9394(03)00265-4. [DOI] [PubMed] [Google Scholar]
- 6.Murray TG, Sobrin L. The case for observational management of suspected small choroidal melanoma. Arch Ophthalmol. 2006;124:1342–1344. doi: 10.1001/archopht.124.9.1342. [DOI] [PubMed] [Google Scholar]
- 7.Shields JA. Treating some small melanocytic choroidal lesions without waiting for growth. Arch Ophthalmol. 2006;124:1344–1346. doi: 10.1001/archopht.124.9.1344. [DOI] [PubMed] [Google Scholar]
- 8.Shields CL, Cater J, Shields JA, Singh AD, Santos MC, Carvalho C. Combination of clinical factors predictive of growth of small choroidal melanocytic tumors. Arch Ophthalmol. 2000;118:360–364. doi: 10.1001/archopht.118.3.360. [DOI] [PubMed] [Google Scholar]
- 9.Diener-West M, Earle JD, Fine SL, et al. The COMS randomized trial of iodine 125 brachytherapy for choroidal melanoma, III: initial mortality findings. COMS Report No. 18. Arch Ophthalmol. 2001;119:969–982. doi: 10.1001/archopht.119.7.969. [DOI] [PubMed] [Google Scholar]
- 10.COMS Collaborative Ocular Melanoma Study (COMS) randomized trial of I-125 brachytherapy for medium choroidal melanoma, I: visual acuity after 3 years COMS report no. 16. Ophthalmology. 2001;108:348–366. doi: 10.1016/s0161-6420(00)00526-1. [DOI] [PubMed] [Google Scholar]
- 11.Shields CL, Shields JA, Cater J, et al. Plaque radiotherapy for uveal melanoma: long-term visual outcome in 1106 consecutive patients. Arch Ophthalmol. 2000;118:1219–1228. doi: 10.1001/archopht.118.9.1219. [DOI] [PubMed] [Google Scholar]
- 12.Kong G, Anyarambhatla G, Petros WP, et al. Efficacy of liposomes and hyperthermia in a human tumor xenograft model: importance of triggered drug release. Cancer Res. 2000;60:6950–6957. [PubMed] [Google Scholar]
- 13.Ning S, Hartley C, Molineux G, Knox SJ. Darbepoietin alfa potentiates the efficacy of radiation therapy in mice with corrected or uncorrected anemia. Cancer Res. 2005;65:284–290. [PubMed] [Google Scholar]
- 14.Blanco G, Saornil AM, Domingo E, et al. Uveal melanoma model with metastasis in rabbits: effects of different doses of cyclosporine A. Curr Eye Res. 2000;21:740–747. [PubMed] [Google Scholar]
- 15.Bonicel P, Michelot J, Bacin F, et al. Establishment of IPC 227 cells as human xenografts in rabbits: a model of uveal melanoma. Melanoma Res. 2000;10:445–450. doi: 10.1097/00008390-200010000-00006. [DOI] [PubMed] [Google Scholar]
- 16.Hu LK, Huh K, Gragoudas ES, Young LH. Establishment of pigmented choroidal melanomas in a rabbit model. Retina. 1994;14:264–269. doi: 10.1097/00006982-199414030-00014. [DOI] [PubMed] [Google Scholar]
- 17.Liggett PE, Lo G, Pince KJ, Rao NA, Pascal SG, Kan-Mitchell J. Heterotransplantation of human uveal melanoma. Graefes Arch Clin Exp Ophthalmol. 1993;231:15–20. doi: 10.1007/BF01681695. [DOI] [PubMed] [Google Scholar]
- 18.Mueller AJ, Folberg R, Freeman WR, et al. Evaluation of the human choroidal melanoma rabbit model for studying microcirculation patterns with confocal ICG and histology. Exp Eye Res. 1999;68:671–678. doi: 10.1006/exer.1998.0650. [DOI] [PubMed] [Google Scholar]
- 19.Albert DM, Wagoner MD, Moazed K, Kimball GP, Gonder JR. Heterotransplantation of human choroidal melanoma into the athymic “nude” mouse. Invest Ophthalmol Vis Sci. 1980;19:555–559. [PubMed] [Google Scholar]
- 20.Apte RS, Niederkorn JY, Mayhew E, Alizadeh H. Angiostatin produced by certain primary uveal melanoma cell lines impedes the development of liver metastases. Arch Ophthalmol. 2001;119:1805–1809. doi: 10.1001/archopht.119.12.1805. [DOI] [PubMed] [Google Scholar]
- 21.Grossniklaus HE, Dithmar S, Albert DM. Animal models of uveal melanoma. Melanoma Res. 2000;10:195–211. [PubMed] [Google Scholar]
- 22.Heegaard S, Spang-Thomsen M, Prause JU. Establishment and characterization of human uveal malignant melanoma xenografts in nude mice. Melanoma Res. 2003;13:247–251. doi: 10.1097/00008390-200306000-00004. [DOI] [PubMed] [Google Scholar]
- 23.Mueller AJ, Maniotis AJ, Freeman WR, et al. An orthotopic model for human uveal melanoma in SCID mice. Microvasc Res. 2002;64:207–213. doi: 10.1006/mvre.2002.2398. [DOI] [PubMed] [Google Scholar]
- 24.Braun RD, Abbas A. Orthotopic human choroidal melanoma xenografts in nude rats with aggressive and nonaggressive PAS-staining patterns. Invest Ophthalmol Vis Sci. 2006;47:7–16. doi: 10.1167/iovs.04-0882. [DOI] [PMC free article] [PubMed] [Google Scholar]
- 25.Braun RD, Gradianu M, Vistisen KS, Roberts RL, Berkowitz BA. Manganese-enhanced MRI of human choroidal melanoma xenografts. Invest Ophthalmol Vis Sci. 2007;48:963–967. doi: 10.1167/iovs.06-1156. [DOI] [PMC free article] [PubMed] [Google Scholar]
- 26.Krause M, Kwong KK, Xiong J, Gragoudas ES, Young LH. MRI of blood volume and cellular uptake of superparamagnetic iron in an animal model of choroidal melanoma. Ophthalmic Res. 2002;34:241–250. doi: 10.1159/000063883. [DOI] [PubMed] [Google Scholar]
- 27.Daniels KJ, Boldt HC, Martin JA, Gardner LM, Meyer M, Folberg R. Expression of type VI collagen in uveal melanoma: its role in pattern formation and tumor progression. Lab Invest. 1996;75:55–66. [PubMed] [Google Scholar]
- 28.Yuhas JM, Li AP, Martinez AO, Ladman AJ. A simplified method for production and growth of multicellular tumor spheroids. Cancer Res. 1977;37:3639–3643. [PubMed] [Google Scholar]
- 29.Blanco PL, Oliver KM, Mansour M, et al. The value of ultrasound as a tool to evaluate uveal melanoma in a rabbit model. Invest Ophthalmol Vis Sci. 2003;44:3649. [Google Scholar]
- 30.Romero JM, Finger PT, Rosen RB, Iezzi R. Three-dimensional ultrasound for the measurement of choroidal melanomas. Arch Ophthalmol. 2001;119:1275–1282. doi: 10.1001/archopht.119.9.1275. [DOI] [PubMed] [Google Scholar]


