Figure 1.
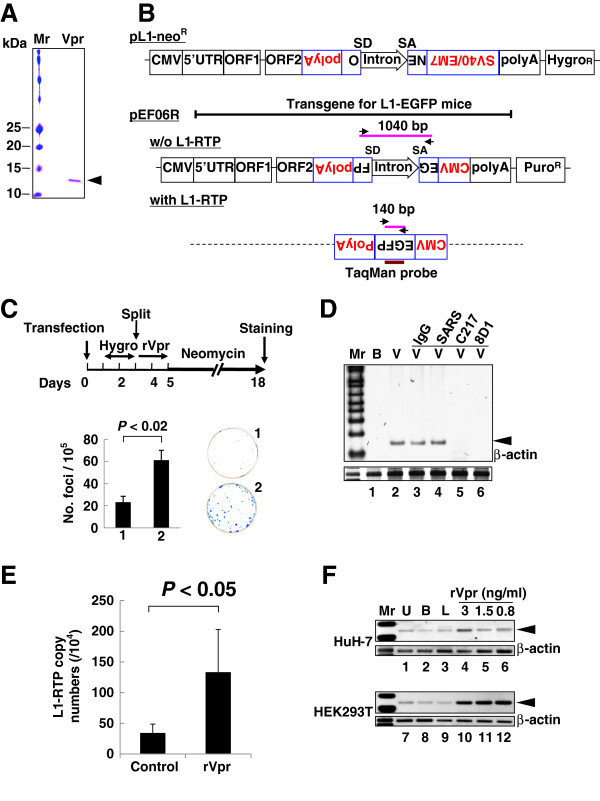
rVpr induces L1-RTP. A. rVpr was purified by two-step column chromatography using a glutathione-bead and an affinity column with 8D1. Purified protein was stained with Coomassie brilliant blue. Mr, molecular weight marker. B. Schematics of constructs used in the current study (see details in Methods). The PCR-based assay detects a 140 bp band that was amplified upon induction of L1-RTP (with L1-RTP), whereas it detects a 1040 bp band without L1-RTP (w/o L1-RTP). Arrows indicate primers for the PCR-based assay. SD and SA indicate splicing donor and splicing acceptor, respectively. The position of the TaqMan probe was also depicted. C. Colony formation assay of rVpr-induced L1-RTP. The experimental protocol and results are shown. HuH-7 cells were treated with buffer (plate no. 1) or rVpr (plate no. 2) are also shown. Obtained colonies were stained (right panels). D. Inhibition of rVpr-induced L1-RTP by mAbs against Vpr. 8D1 or C217 were used (lanes 5 and 6). As control, mouse IgG (lane 3) or a SARS mAb (lane 4) were included. B, buffer; V, rVpr. Arrowhead indicates the 140 bp band. Mr, molecular weight marker. E. Results of the qPCR analysis of rVpr-induced L1-RTP. Approximately 10 ng/mL of rVpr was used, and L1-RTP was measured by the qPCR. F. Activity of low dose of rVpr on HEK293T cells. Results of HuH-7 cells and HEK293T cells were shown. U, untreated; B, buffer; L, LPS (10 ng/mL).

