

SUMMARY
The hippocampus frequently replays memories of past experiences during sharp-wave ripple (SWR) events. These events can represent spatial trajectories extending from the animal’s current location to distant locations, suggesting a role in the evaluation of upcoming choices. While SWRs have been linked to learning and memory, the specific role of awake replay remains unclear. Here we show that there is greater coordinated neural activity during SWRs preceding correct, as compared to incorrect, trials in a spatial alternation task. As a result, the proportion of cell pairs coactive during SWRs was predictive of subsequent correct or incorrect responses on a trial-by-trial basis. This effect was seen specifically during early learning, when the hippocampus is essential for task performance. SWR activity preceding correct trials represented multiple trajectories that included both correct and incorrect options. These results suggest that reactivation during awake SWRs contributes to the evaluation of possible choices during memory-guided decision making.
INTRODUCTION
New experiences are accompanied by profound increases in the level of coordinated memory reactivation in the hippocampus during sharp-wave ripple (SWR) events (Foster and Wilson, 2006; Cheng and Frank, 2008; Karlsson and Frank, 2008; O’Neill et al., 2008). These reactivation events frequently replay entire behavioral trajectories representing either past or possible future locations (Foster and Wilson, 2006; Diba and Buzsáki, 2007; Davidson et al., 2009; Karlsson and Frank, 2009; Gupta et al., 2010) and reactivation strength during and after an experience correlates with subsequent memory (Nakashiba et al., 2009; Dupret et al., 2010). Disrupting SWRs during sleep leads to subsequent performance deficits in a spatial memory task (Girardeau et al., 2009; Ego-Stengel and Wilson, 2010), and disrupting SWRs during behavior causes performance deficits in a spatial learning task (Jadhav et al., 2012). While these findings have established the importance of SWRs for learning, it is unclear how SWR activity contributes to memory-guided behavior.
We have hypothesized that SWR reactivation represents recent and possible future paths to aid ongoing memory-guided navigation (Karlsson and Frank, 2009; Carr et al., 2011). However, to date no one has examined whether reactivation during learning is related to choice behavior in a hippocampally dependent spatial task. We asked how SWR reactivation could aid memory-guided decisions in animals learning a W-track alternation task in initially novel environments (Frank et al., 2000; Karlsson and Frank, 2008; Kim and Frank, 2009). We focused on the outbound, SWR-dependent component of the task (Jadhav et al., 2012). On outbound trials, animals begin in the center arm of the track. Correct performance of the task is to alternate between outside arms. To accomplish this, animals must remember which outside arm they visited most recently and choose a path to the opposite arm. Hippocampal lesions and SWR interruption impair learning on outbound trials (Kim and Frank, 2009; Jadhav et al., 2012), but both lesioned and SWR interruption animals eventually behave at above chance levels, indicating that the hippocampus plays a particularly important role in rapid initial learning of the task.
We found that during this early learning period, there was more SWR reactivation preceding correct as compared to incorrect trials. Enhanced reactivation preceding correct trials tended to reflect outbound paths from the animal’s current location. These results suggest that hippocampal reactivation contributes to a process whereby animals use past experience to make memory-guided decisions.
RESULTS
Our goal was to examine how SWR reactivation of distal locations could inform hippocampal-dependent spatial learning. We therefore studied the activity of ensembles of neurons from hippocampal areas CA3 and CA1 during hippocampal SWRs recorded from animals learning an alternation task in which they had to recall their past location to select their future trajectory (Figure 1A) (Frank et al., 2000; Karlsson and Frank, 2008; Kim and Frank, 2009). In this task, animals are always rewarded for visiting the arms in the following order: center, left, center, right, center, left, and so on. We examined SWR activity when animals were in the center arm because, at that point, animals must remember the previous arm visited to select the next arm. We focused on times when the animal was within 20 cm of the reward well and moving at less than 1 cm/s, because SWR activity is strongest during stillness (Buzsáki, 1986). The 20 cm cutoff was chosen to exclude place field activity of cells whose fields extend from the center arm past the choice point (CP), defined as the location where animals must choose to go left or right from the center arm. Further, because inbound runs to the center arm were always rewarded, examining activity when animals were located near the center well ensured that the recent reward history of the animal was consistent across all examined data and thereby controlled for the presence of reward-related increases in SWR activity (Singer and Frank, 2009). Thus, we examined behavioral performance and spiking during SWRs preceding outbound trials, defined as trials when the animal was leaving the center arm and had to select the outside arm that was opposite the outside arm last visited.
Figure 1. Alternation Task Performance.

(A) Left: overhead view of the tracks, T1 and T2, separated by a black wall (dashed line) and the rewarded alternation sequence, center (C), left (L), C, right (R), C. Tables on the right show when animals were exposed to each track: two sessions of T1 per day on days 1–3 and one session of T1 and two sessions of T2 per day on day 4 and onward.
(B and C) Proportion correct on outbound trials per exposure day for T1 (B) and T2 (C). SEM and SE for all animals (left) and proportion correct for each animal (right). Animal 1, red; animal 2, blue: animal 3, black; animal 4, magenta; animal 5, green.
Animals were first exposed to one novel track, T1, and then 3 days later to a second novel track, T2 (Figure 1A). Animals were exposed to T1 for two sessions each day and then, from day 4 onward, animals were exposed to T1 for one session per day and exposed to novel T2 for two sessions per day (Figure 1A). All animals had been pretrained to run back and forth for reward on a linear track, but animals had no experience with the alternation task prior to the first exposure to T1.
Classification of Behavioral Performance
The hippocampus is particularly important for rapid learning (Nakazawa et al., 2003; Kim and Frank, 2009), and thus we would expect that the hippocampal contribution to decision making would be most evident during task acquisition. Behavioral performance was close to chance levels during the first session of the first day on T1 (Figure 1B). Behavioral performance improved during the second session, indicating that animals had begun to learn the task. In contrast, while animals also performed poorly during the first session in T2, their behavior improved more rapidly in T2 than in T1 (Figure 1C), probably due to their previous experience with the task in T1.
To examine how reactivation changes during learning, we took advantage of the variability between animals in how quickly each acquired the task in T1 and T2 (Figures 1B and 1C). All animals reached significantly above chance performance individually (p < 0.05 based on the state-space algorithm from Smith et al., 2004), allowing us to develop a set of behavioral criteria describing each animal’s behavioral performance over time. All animals started with performance below 65% on the first exposure to the task in T1, and eventually reached performance of at least 85% after several days of training, so we divided the behavior performance into four categories reflecting (1) this initial poor performance, below 65%, (2) the first session of task acquisition, between 65 and 85%, (3) the first session of asymptotic performance, above 85%, and (4) maintained asymptotic performance, defined as subsequent sessions above 85%.
Neural Activity during SWRs Preceding Correct and Incorrect Trials
We examined SWR activity from sessions corresponding to these performance categories. See Table S1 for the number of cells from each animal for each performance category. We compared SWR activity preceding correct and incorrect trials to determine whether SWR reactivation was related to correct performance in the task. We focused on the coactivation probability of cell pairs (see Experimental Procedures for explanation of focus on pairs), defined for each pair as the proportion of SWRs in which both cells from that pair were active. To quantify differences in coactivation probability across correct and incorrect trials, we used a Z score measure. For each pair of cells with place fields on the track, we computed the proportion of SWRs preceding correct trials in which both cells fired and, separately, the proportion preceding incorrect trials (Figure 2A). We converted the difference between these proportions into a Z score for each cell pair (see Experimental Procedures). This approach is more conservative than examining the proportions themselves because it accounts for differences in the number of SWRs observed on correct and incorrect trials. To determine whether the difference between SWR reactivation on correct and incorrect trials was significant, we compared Z scores both to a Z score of 0 and to Z scores derived from shuffling the outcome of each trial while leaving the structure of neural activity on that trial intact (see Experimental Procedures).
Figure 2. SWR Coactivity Is Enhanced Preceding Correct Trials during Task Acquisition.

(A) Left: diagram of one set of possible future correct and incorrect trials. Examples of SWRs (gray bars) in the raw LFP (top) and the LFP filtered for 150–250 Hz (bottom) when the animal was at the center well are shown.
(B) Z score for the difference in proportion of SWRs in which each cell pair was active preceding correct and incorrect trials across the following performance categories: 1, the first session in which the animal performed at <65% correct; 2, the first session 65%–85% correct; 3, the first session >85% correct; and 4, the first of subsequent sessions >85% correct. Bar indicates upper and lower quartiles, and horizontal line shows median for T1 (top) and T2 (bottom).
(C) Z score for the difference in proportion of SWRs in which each cell pair was active preceding correct and incorrect trials for performance categories 2 and 3 (green) and 1 and 4 (black).
(D) Coactivation probability per cell pair during SWRs preceding incorrect (blue) and correct (red) trials for performance categories 1 through 4, combined across T1 and T2. See also Figure S1 and Table S1. *p < 0.01, **p < 0.001, ***p < 0.0001.
We found a transient increase in the Z scores of the change in coactivation probability during the early improvement in behavioral performance (Figure 2B) in both T1 and T2. Beginning with T1, the median of the distribution of Z scores was close to zero for performance category 1, reflecting approximately equal coactivation probability before correct and incorrect trials (174 cell pairs, signed-rank test Z scores versus 0, p > 0.3). However, during the sessions when the percentage correct first exceeded 65% (performance category 2), the median Z score was significantly greater than zero (250 cell pairs, p < 10−5 versus 0 and versus shuffled, signed-rank test and rank-sum test, respectively), indicating that cell pairs were more coactive preceeding correct than incorrect trials. These larger Z scores persisted during the first session of high behavioral performance (performance category 3; 86 cell pairs, Z score rank-sum p < 10−4 versus 0 and versus shuffled). When animals consistently performed the task well (performance category 4), the median Z score was once again not significantly different from zero (79 cell pairs, signed-rank test Z scores versus 0, p > 0.1), reflecting similar levels of coactivation probability preceding correct and incorrect trials. These patterns were consistent across individual animals (Figure S1B).
We found a similar increase in the Z scored proportion change in coactivation probability preceding correct trials during task acquisition in T2, even though task acquisition was faster in T2 than T1. The median Z score was not different from zero for poor performance (performance category 1, Figure 2B, 51 cell pairs, signed-rank test Z scores versus 0, p > 0.3). In contrast, when performance first improved (performance category 2) and initially reached high behavioral performance (performance category 3), the median Z scores were greater than zero (performance category 2: 155 cell pairs, p < 10−4 versus 0 and versus shuffled; performance category 3: 324 cell pairs, p’s < 10−6 versus 0 and versus shuffled), indicating greater coactivation probability before correct than incorrect trials. When animals consistently performed the task well (performance category 4), the median Z score remained greater than zero but was not greater than the Z score from the shuffled data (113 cell pairs, p > 0.1 versus shuffled). These patterns were consistent across individual animals (Figure S1A) and manifested as a larger number of positive Z scores for the cell pairs from performance categories 2 and 3 (Figure 2C; Komolgorov-Smirnov and rank-sum test, both p’s < 0.001).
Across both tracks, the pattern of increased coactivation probability during performance categories 2 and 3 remained present for areas CA3 and CA1 when cell pairs from these regions were considered separately (Figure S1B), although most cells were from CA1. Similarly, the same results were obtained when we included only pairs of cells in which one or both place fields were located past the CP at the end of the center arm (Figure S1C). In addition, while single-cell activation probabilities and the number of cell pairs active were numerically higher before correct than incorrect trials, neither of these factors could fully account for the measured pairwise differences (Figures S1D and S1E). These findings suggest that specific sets of cell pairs were strongly activated before correct trials, a possibility we confirm below.
We have previously shown that coactivation probability during SWRs is high in novel environments and then decreases with experience (Cheng and Frank, 2008). Here we found that there was greater relative coactivation probability preceding correct, as compared to incorrect, trials for 65%–85% and >85% correct performance categories. We therefore sought to understand how differences in coactivation probability between correct and incorrect trials interacted with the overall decrease in coactivation probability with experience.
We combined data across tracks and found that coactivation probability preceding correct trials remained high from the first exposure through the first session with >85% correct performance (Figure 2D; p’s > 0.1 for comparisons among correct trials for <65% correct, 65%–85% correct, and >85% correct performance categories). In contrast, coactivation probability dropped significantly for incorrect trials during learning (65%–85% correct and >85% correct, p’s < 0.001 versus <65% correct). Finally, once animals achieved consistent >85% correct performance, coactivation probabilities dropped for correct trials (p’s < 0.001 versus <65% correct, 65%–85% correct, and >85% correct) to a level similar to that seen on incorrect trials. These findings suggest that errors made during learning reflect lower levels of place cell pair coactivation during SWRs.
The lower levels of coactivation probability on incorrect trials also account in large part for the differences in Z scores before correct and incorrect trials. We computed the mean difference in coactivation probability for each pair, defined as the mean coactivation probability on correct trials minus the mean coactivation probability on incorrect trials. Not surprisingly, this coactivation probability difference was strongly correlated with the Z score measure (r = 0.85, p < 10−4). This indicates that large differences in coactivation probability for individual pairs is a strong driver of the Z score effects, with the remaining variability in the Z scores arising from the influence of the different numbers of SWRs before correct and incorrect trials. We then asked whether incorrect or correct trial coactivation probability alone was a better predictor of Z score. We found that coactivation probabilities on incorrect trials for individual cell pairs were significantly negatively correlated with the Z score measure for those pairs (r = −0.59, p < 10−4). Thus, low coactivation probability predicted high Z score differences. In contrast, there was a very small and nonsignificant relationship between coactivation probability and Z score for correct trials (r = 0.06, p > 0.05). Thus, we found that the Z-scored proportion change in coactivation was higher preceding correct than incorrect trials, mainly due to a decrease in coactivation probability preceding incorrect trials during learning.
We further noted that the low values of coactivation probability on incorrect trials were due in large part to the high proportion of cell pairs that were never coactive preceding incorrect trials. We combined data from T1 and T2, performance categories 2 and 3 (65%–85% and >85% correct), and for each cell pair we compared the coactivation probability before correct and incorrect trials (Figure 3A). We found that the distribution of coactivities for incorrect trials was largely made up of pairs that were never coactive (605 of 778 pairs), while a much smaller number of pairs were never coactive before correct trials (27 of 778). Excluding data from the pairs that were never coactive before incorrect trials rendered the differences in pairwise Z scores between correct and incorrect trials nonsignificant (p > 0.6). The same analysis applied to performance categories 1 and 4 (Figure 3B) yielded a smaller proportion of pairs that were never coactive before incorrect trials (212 of 416 pairs) and a larger proportion of pairs that were never coactive before correct trials (51 of 416). Taken together, these results demonstrate that the difference between SWR reactivation preceding correct and incorrect trials is largely due to lower coactivation probabilities preceding incorrect trials. This effect was most prominent in performance categories 2 and 3.
Figure 3. Differences in SWR Coactivity across Correct and Incorrect Trials.

(A) Two-dimensional histogram showing the proportion of cell pairs with different values of correct versus incorrect coactivation probability for performance categories 2 and 3 (65%–85% and >85% correct). The histogram is truncated at 0.25 on each axis for visibility but includes 99.0% of the data. The color scale indicates the proportion of cell pairs in each bin of the histogram. The white arrow highlights the preponderance of probability mass along the y axis, corresponding to pairs that were inactive or minimally coactive on incorrect trials.
(B) Same as in (A) but for performance categories 1 and 4 (<65% correct and >85% correct asymptotic). The histogram is truncated at 0.25 on each axis for visibility but includes 98.8% of the data. A smaller proportion of the probability mass is located along the y axis (highlighted by the white arrow) as compared to the histogram for performance categories 2 and 3 (A).
(C and D) Expected versus actual coactivation probability per cell pair during SWRs preceding correct (red) and incorrect (blue) trials for performance categories 2 and 3 (C) and for performance categories 1 and 4 (D). Note that there are the same numbers of correct and incorrect data points in each plot but for performance categories 2 and 3, most of these incorrect data points lie on the x axis.
Our group has previously shown that new experiences drive cell pairs to fire together during SWRs more than expected relative to the activity of the individual cells in each pair (Cheng and Frank, 2008). We refer to this as “coordinated activity.” To determine whether coordinated activity differed when SWRs preceded correct versus incorrect trials, we compared the actual level of coactivation probability to that predicted, assuming that cells were activated independently during SWRs. To compute this predicted level of coactivation probability for each trial type, we calculated the product of the measured single-cell activation probabilities for the two cells.
We found that for data from performance categories 2 and 3, coordinated activity was present on correct trials but was not detectable on incorrect trials (Figure 3C; correct trials actual versus predicted coactivation probability p < 10−5, incorrect trials: p > 0.1, sign test). We then examined all cell pairs in which the expected coactivation probability was greater than zero for a given trial type (correct or incorrect) to focus on the cell pairs in which both cells were active during SWRs for that trial type. Of these cell pairs, 79% (608 of 774) of cell pairs were more coactive than predicted if the cells fired independently preceding correct trials, while only about half (54%; 161 of 297) were more coactive than predicted preceding incorrect trials. In contrast, coordinated activity was present preceding both correct and incorrect trials for comparable data from performance categories 1 and 4 (Figure 3D; actual versus predicted activation p’s < 10−4 for both correct and incorrect trials; sign test). These findings indicate that during learning, strong coordinated activity preceded correct trials but was not present before incorrect trials.
We also sought to understand how coordinated activity contributed to the measured Z scores. Our goal was to estimate the Z score distributions we would have measured if the individual cells fired independently. To do so, we calculated the expected Z score exactly as for the actual Z score but using the predicted coactivation probability rather than the actual coactivation probability. We then compared these Z scores to the actual Z scores. We found that the actual Z scores were significantly higher than the estimated Z scores (median actual z = 0.46; median estimated z = 0.25, rank-sum test p < 0.001). Thus, the activation of cell pairs during SWRs at levels greater than expected, given the activity of the individual cells, also contributes to the higher measured Z scores.
Trial-by-Trial Prediction of Correct and Incorrect Choices
We then asked whether we could predict upcoming correct or incorrect choices based on coactivation during SWRs. We found that the proportion of coactive cell pairs was predictive of performance on a trial-by-trial basis. We randomly selected equal numbers of correct and incorrect trials from each behavioral session of T1 and T2 and calculated the proportion of cell pairs that were coactive during SWRs on each trial (see Experimental Procedures). We then randomly selected half of these data for training a logistic regression model and reserved the other half for testing. We repeated that process 1,000 times, randomly selecting different trials for each iteration and using equal numbers of correct and incorrect trials to train and test the model. We found that the proportion of coactive cell pairs was predictive of trial-by-trial performance for performance categories 2 and 3 (Figure 4; mean 60% correct p < 10−5 compared to a chance level of 50%, signed-rank test). In contrast, the same analyses applied to performance category 1 (<65% correct) yielded predictions that were at chance levels (p > 0.0135 compared to a chance level of 50%, which is not significant when taking into account multiple comparisons).
Figure 4. Prediction of Subsequent Correct and Incorrect Responses with Pairwise Spiking Activity during SWRs.
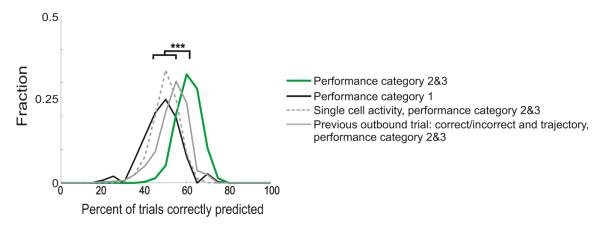
The graph shows the proportion of trials on which the trial outcome, correct or incorrect, was accurately predicted by a logistic regression model on the average proportion of cell pairs active per SWR for all trials from performance categories 2 and 3 (65%–85% and >85%; green line), for performance category 1 (<65%; black solid line), for single cells active per SWR for performance categories 2 and 3 (65%–85% and >85%; gray dashed line), or for a model based on the prior outbound trial trajectory and correct or incorrect performance (gray solid line). *p < 0.01, **p < 0.001, ***p < 0.0001.
Predictions based on performance categories 2 and 3 were also significantly better than predictions based on either the proportion of single cells active during SWRs on each trial or information about the last outbound trial that included the correct or incorrect status and the specific left or right trajectory involved in that trial (Figure 4). Predictions based on single-cell activation were slightly better than chance (mean = 52% correct, p < 0.001) and, interestingly, the prediction based on the previous outbound trial was slightly but significantly better than chance (mean = 56% correct, p < 0.001). We examined these trials in detail and found that if the previous outbound trial was incorrect (n = 26), the next outbound trial was likely to be correct (n = 19 correct; n = 7 incorrect; p < 0.001 Z test for proportions). In contrast, if the previous outbound trial was correct (n = 62) the next outbound trial was approximately as likely to be correct (n = 25) or incorrect (n = 37; p > 0.1). Thus, animals tended to make correct choices after incorrect outbound trials. Nonetheless, as predictions based on the proportion of coactive pairs were superior to those based on previous trial outcome, effects due solely to the status of the previous outbound trial cannot explain our findings. The same analyses applied to T1, performance category 4 (>85% asymptotic) yielded predictions similar to those based on the previous outbound trial (mean = 56% correct, p < 0.001). T2, performance category 4 data yielded a prediction that was also significantly greater than chance (mean = 68% correct, p < 0.001), but this prediction is more difficult to interpret because the Z scores for T2, performance category 4 were not significantly different from the shuffled data, suggesting that the above chance predictions could be due to sampling biases.
Control Analyses
The significant differences in SWR activity preceding correct and incorrect trials could not be explained by differences in time spent at the well, number of SWRs, animal head direction during SWRs, or cluster quality. Differences in coactivation probability could not be explained by different amounts of time spent at the reward well: there were no significant differences in time spent at the well preceding correct and incorrect trials during task acquisition (Figure 5A, p’s > 0.1 except T2 performance category 4, p < 0.01). Furthermore, we found no differences in the numbers of SWRs preceding correct and incorrect trials (Figure 5B, p’s > 0.05, T1: 13, 20, 56, and 170 correct trials and 8, 6, 13, and 39 incorrect trials, T2: 9, 22, 42, and 110 correct trials and 14, 10, 10, and 20 incorrect trials for performance categories 1–4, respectively).
Figure 5. Similar Time Spent at Well and Number of SWRs Preceding Correct and Incorrect Trials.

(A) Time spent at the center well preceding correct and incorrect trials for T1 (top) and T2 (bottom).
(B) Number of SWRs preceding outbound trajectories across performance categories for T1 (top) and T2 (bottom). Only trials in which at least one SWR met criteria for analysis were included. *p < 0.01. See also Figure S1.
Additionally, we found that in both tracks and for both correct and incorrect trials, more than 98% of the SWRs included in our analyses occurred when the animal was facing the well and that the proportion did not differ across tracks or across trial types (p’s > 0.05). Finally, we also found no consistent differences in cluster quality, measured as the isolation distance (Schmitzer-Torbert et al., 2005) for each cell included in the analysis (Figure S1F). Thus, we conclude that the greater pairwise reactivation preceding correct trials reflects coordinated patterns of neural activity.
Reactivation of Spatial Trajectories during SWRs
Given this bias for greater coordinated activity during SWRs preceding correct trials, we then asked whether this activity reflected the reactivation of specific trajectories that related to the most recent past or the upcoming future trajectory (Figures 6A and 6D, Figures S2A and S2C). We noted that during learning, there were often multiple detected SWRs per trial (Figure 5B), indicating that reactivation events could contribute to subsequent choices in multiple ways. If, for example, there is reactivation of both possible upcoming trajectories (the correct future and incorrect future trajectory), then reactivation events could serve to provide information about possible upcoming choices to other brain regions that would then evaluate those possibilities and make a decision. Alternatively, if there is only reactivation of the correct future trajectory, then reactivation events could inform downstream brain regions of the correct future path. Finally, if only reactivation of the most recent past trajectory occurs, then reactivation events could provide information about a specific past experience. This would inform downstream areas of the specific past experience necessary for the subsequent decision about which outer arm to visit next.
Figure 6. SWR Reactivation Contains Information about Possible Trajectories.

(A) Diagram of inbound (gray arrow) and outbound (black arrow) trajectory directions.
(B) Proportion of SWRs per trial in which the order of cells active during the SWR was more consistent with outbound (dark gray) or inbound (light gray) directions in T1 (top) and T2 (bottom).
(C) Distribution of slopes of best fit line to decoded locations across time bins.
(D) Diagram of an inbound trial and the subsequent correct future trajectory (dark gray arrow) and incorrect future trajectory that was not taken (light gray arrow).
(E) Proportion of SWRs per trial in which cells active during SWRs have more place field activity on the future correct (dark gray) or future incorrect (light gray) trajectory in T1 (top) and T2 (bottom). *p < 0.01, **p < 0.001, ***p < 0.0001. Only trials in which at least one SWR met criteria for analysis were included. See also Figure S2.
(F) Diagram of inbound reactivation corresponding to the actual past path taken and the other past path.
(G) Proportion of SWRs per trial in which cells active during SWRs have more place field activity on the most recent past (dark gray) or other (light gray) past trajectory in T1 (top) and T2 (bottom).
The place cells we recorded were generally active in both directions of motion (Karlsson and Frank, 2009), consistent with previous observations for place cells in novel environments (Frank et al., 2004). As a result, we cannot unambiguously separate forward from reverse replay events in this data set. Further, it is not yet clear how downstream brain areas interpret forward and reverse replay. We therefore classified events using only the direction of propagation of the spatial representation. In particular, we asked whether SWR reactivation events preceding correct trials were more likely to reflect outbound paths that progressed away from the animal or to reflect inbound paths that progressed toward the animal (Figure 6A, Figure S2A).
We focused on the reactivation events present during task acquisition (performance categories 2 and 3), although the results were similar across all performance categories (Figures S2A and S2B). For these analyses, we used a previously developed decoding algorithm (Davidson et al., 2009; Karlsson and Frank, 2009) that translates neural activity during SWRs into trajectories through the environment. These trajectories consist of a probability distribution function (pdf) over location for a series of 15 ms bins in which there is spiking during the SWR. We fit a line to samples from the sequence of pdfs and assigned each SWR as either outbound or inbound based on the progression of spatial representations within the SWR. Increases in distance with time manifest as a positive slope of the line, consistent with outbound trajectories from the center arm to an outside arm.
We have previously shown that most replay events begin with locations near the animal and proceed to more distant locations (Karlsson and Frank, 2009). We therefore examined the proportion of inbound and outbound reactivation events preceding correct trials (Figure 6A, Figures S2A and S2B). We found a bias toward outbound trajectories, a result consistent with our previous findings (Figure 6B, p’s < 0.005 except for T2 > 85%: p > 0.5 z test for proportions; T1: 148 and 89 SWRs, T2: 74 and 116 SWRs for 65%–85% and >85% correct respectively) across tracks. The same bias was present when we restricted our analysis to significant replay events, defined as those events for which the R value of the regression line fit to the pdfs was greater than the R value derived from shuffled data at the p < 0.05 level (Figure 6C; z proportion test: p < 10−10, Z score = −13.8414 for correct trials, and p < 10−10; the same was true for incorrect trials: Z score = −6.0416, data not shown). SWRs were collapsed across all track and performance categories to provide a sufficient number of events for analysis (190 SWRs preceding correct trials, 67 SWRs preceding incorrect trials). Thus, the representations reactivated during these events originated near the animal’s current location in the center arm and proceeded away from the animal. We found similar biases before and after task acquisition (<65% correct and >85% correct asymptotic, Figures S2A and S2B).
We then focused on the specific path reactivated during each outbound event and found reactivation consistent with both the correct future path and the path not taken on correct trials. We selected SWRs with activity that represented locations past the CP at the end of the center arm and classified these SWRs as future correct or future incorrect depending on whether the area under the pdfs of the decoded locations past the CP was larger on the future correct or incorrect trajectory. We found that there was a numerical bias toward greater reactivation of the correct future trajectory but that both the correct future and incorrect future (the path not taken) paths were reactivated during outbound events on correct trials (Figures 6D and 6E;Figures S2C and S2D; p’s > 0.03, which is not significant when taking into account multiple comparisons, except T2 > 85%: p < 0.001; T1: 18 and 18 SWRs, T2: 13 and 21 SWRs for 65%–85% and >85% correct, respectively). Similarly, there was approximately equal reactivation of both the actual past path and the other possible past path during inbound reactivation events. (Figures 6F and 6G; Figures S2E and S2F; p’s > 0.05).
DISCUSSION
We found that, as animals acquired a spatial alternation task, stronger reactivation of pairs of place cells during SWRs was associated with subsequent correct choices. This greater coactivation probability preceding correct trials manifested as coordinated firing in which pairs were more active than would be expected from the activity of the individual place cells during SWRs. In contrast, coactivation probabilities were at chance levels preceding incorrect trials. Further, the proportion of cell pairs activated during SWRs was predictive, on a trial-by-trial basis, of subsequent correct or incorrect choices. These changes in coactivation probability could not be explained by differences in reward history, numbers of SWRs preceding correct or incorrect trials, time spent at the well, or general increases in single-cell activity. The specific trajectories reactivated during SWRs preceding correct trials were biased toward representing sequences that proceeded away from the animal’s current location. Interestingly, there were generally multiple SWRs preceding each correct trial, and the trajectories represented in these SWR events included both the upcoming correct outer arm of the maze as well as the other, incorrect, outer arm.
Learning the best path to a goal requires representing both past paths taken and possible future choices to reach the desired goal. Our groups’ recent demonstration that disrupting SWRs caused a specific impairment in learning and performing outbound trials in this task demonstrated that SWR activity was necessary for this process (Jadhav et al., 2012) but did not link a specific aspect of reactivation to learning. Similarly, Dupret et al. (2010) demonstrated that increases in overall SWR activity during learning were correlated with memory of rewarded locations measured during a later behavioral session but did not report a trial-by-trial relationship between the strength of reactivation and the immediate subsequent choice.
Our results establish that, on a trial-by-trial basis, greater SWR reactivation is predictive of a subsequent correct choice, suggesting that reactivation contributes to correct path selection during learning. We found that there were generally multiple SWRs preceding each correct trial. The reactivation events present during these SWRs tended to represent sequences of locations that proceeded away from the animal, but across sequences both the correct and the incorrect outer arm of the track were represented. Thus, spiking during these SWRs could provide information about possible future choices, based on past experience, which would then be evaluated by other brain structures. Alternatively, it is possible that these are reverse replay events representing past trajectories from the upcoming correct outer arm. In either case, we also note that we observed a significant bias toward reactivating the future correct arm when animals were first performing very well (>85% correct) in track 2, suggesting that in some cases the hippocampus may become biased toward reactivating specific correct possibilities.
Greater coactivity and coordinated activity could support accurate evaluation of upcoming possibilities and past experiences. Conversely, the specific reduction of coactivation probability before incorrect trials during learning suggests that a failure to reactivate possible choices leads to errors in decision making. At the same time, our results confirm previous observations of, at best, a weak relationship between the content of replay or replay-like events on each trial and subsequent behavior (Johnson and Redish, 2007; Davidson et al., 2009; Gupta et al., 2010). Rather, reactivation during SWRs seems best suited to provide downstream areas with information about possible paths through the environment. In particular, coding of paths extending from the current to remote locations, similar to what we observed during SWR reactivation, is an efficient and rapid way to represent possible options to reach a goal (Johnson and Redish, 2007; Carr et al., 2011). Reactivation during SWRs has also been linked to the consolidation of memories (Girardeau et al., 2009; Nakashiba et al., 2009; Dupret et al., 2010; Ego-Stengel and Wilson, 2010), suggesting that reactivation could contribute simultaneously to memory retrieval and to the storage of the retrieved memories.
Previous results have established that SWR reactivation is strongest in novel environments and becomes less prevalent as the environments become more familiar. (Foster and Wilson, 2006; Cheng and Frank, 2008; Karlsson and Frank, 2008; O’Neill et al., 2008). Additionally, we have shown that receipt of reward also enhances reactivation and that reward-related reactivation is strongest when animals are learning (Singer and Frank, 2009). Here we controlled for immediate reward history by examining outbound trials that always followed a rewarded inbound trajectory. We found that SWR reactivation reflects both novelty and trial-by-trial variability related to the upcoming decision on that trial. Coactivation probability during SWRs preceding correct trials was high when the environments were novel and the animals performed poorly. Coactivity probability remained high as animals learned the task and only dropped once animals reached >85% asymptotic performance. In contrast, while coactivation probability preceding incorrect trials was also high when the track was novel and animals performed poorly, this coactivation probability dropped once animals achieved >65% correct performance and remained lower on these trials throughout the remainder of the training. Taken together, these findings link the strength of SWR reactivation to the engagement of hippocampal circuits in learning and decision-making processes. Thus, strong reactivation in novel environments probably reflects a consistently high level of hippocampal engagement related to ongoing learning about the environment. Similarly, strong reactivation before or after individual trials probably reflects shorter timescale periods of engagement related to receipt of reward, task learning, and decision making.
Rapid learning of the W-track alternation task requires an intact hippocampus, but animals with hippocampal lesions eventually learn the task (Kim and Frank, 2009). Similarly, SWR disruption impairs learning on this task (Jadhav et al., 2012), but animals can still learn to perform at above chance levels. Similarly, we find SWR reactivation is increased preceding correct trials only during early learning. This increase in reactivation was no longer present after animals had mastered the task, indicating that it is not necessary for task performance after learning. Thus, the lower levels of SWR reactivation seen after learning may reflect the disengagement of reactivation from memory-guided decision making.
More broadly, the enhanced SWR coactivation probability differs in important ways from previously observed patterns of hippocampal place cell activity that predict upcoming choices. Unlike prospective and retrospective coding, in which individual place cells fire differently in a location depending on the animal’s past or intended future locations (Frank et al., 2000; Wood et al., 2000; Ferbinteanu and Shapiro, 2003; Ainge et al., 2007), these reactivation events were nonlocal in that they emphasize place representations that are distant from the animal’s current position. Reactivation events also represent multiple paths, not just the path the animal has just taken or is about to take. Further, reactivation events appeared early in task acquisition, suggesting a role in learning. We therefore suggest that enhanced SWR reactivation may play an important role in early learning by providing specific sequential representations of possible paths to other brain areas, while other forms of memory-related activity may arise later during the learning process.
EXPERIMENTAL PROCEDURES
Behavioral Paradigm and Data Collection
Data from animals 1 and 2 were reported previously and the associated methods were described in detail in Karlsson and Frank (2008). The methods for the other animals followed the same paradigm. Briefly, male Long-Evans rats (500–600 g) were food deprived to 85%–90% of their baseline weight and trained to run on a linear track to receive a reward at each end of the track, in a different room from the recording experiments. After pretraining in the linear track, animals were implanted with a microdrive array containing 30 independently movable tetrodes. After 5–6 days of recovery, animals were once again food deprived to 85% of their baseline weight. In animals 1 and 2, the tetrodes were arranged bilaterally in two 15 tetrode groups centered at AP −3.7 mm and ML ±3.7 mm. Each group was located inside an oval cannula whose major axis was oriented at a 45° angle to the midline, with the more posterior tip of the oval closer to the midline. Tetrodes in the anterior and lateral portion of each group targeted lateral CA3, while more posterior and medial tetrodes targeted CA1. In animals 3, 4, and 5, 15 tetrodes were arranged in a group unilaterally centered at AP −3.6 mm and ML 2.2 mm to target CA1.
Each recording day consisted of two or three 15 min run sessions in W-shaped tracks, with rest sessions in a black box before and after each run. Geometrically identical but visually distinct, the two tracks were open to the room but separated from one another by a black barrier (Figure 1A). The tracks had one reward well at the end of each arm, and animals learned by trial and error to perform a continuous alternation task in which, starting from the center arm, they alternated visits to each outer arm for liquid reward (center, left, center, right, and so on; Frank et al., 2000, 2004; Kim and Frank, 2009). Animals were allowed to behave freely and were never forced to choose a particular trajectory. Errors were not rewarded, and after an incorrect choice of an outer arm, no reward was given until the animal returned to the center arm. Recordings began on the first day of exposure to T1. Animals ran on T1 for 3 days and then ran on both T1 and T2 from day 4 onward.
Data Analysis
Behavioral data were divided into four performance categories, based on the animals’ performance on each session. These categories roughly separate sessions into periods of (1) initial exposure to the task, (2) early learning, (3) early good performance, and (4) later good performance. The categories divided the sessions into (1) the first session animals performed at less than 65% correct, (2) the first session the animal performed between 65% and 85% correct, (3) the first session animals performed above 85% correct, and (4) subsequent sessions animals performed above 85%. Less than 65% was selected for the first category because all animals performed at less than 65% on the first exposure to the task, the first session in T1. Above 85% was selected for the third and fourth category because all animals were able to perform the task in T1 at above 85% after many days of training. Because categories 1–3 are only for the first session in which animals reach the criterion, only one session per animal could be included in each category. Since more than one session per animal could be included in category 4, only the first such session per day was used to avoid counting cell pairs more than once per category. Data from all animals were included through exposure ten for T1 and exposure seven for T2. Exposures past these were excluded because they represented data from three or fewer of the five animals.
To detect SWRs, we recorded local field potentials (LFPs) from one channel of each tetrode, and SWRs were detected on all tetrodes in CA1. The LFP signal from these tetrodes was band-pass filtered between 150 and 250 Hz, and the envelope was determined by Hilbert transform. SWR events were detected if the envelope exceeded a threshold of mean plus three standard deviations for at least 15 ms on any tetrode in CA1. Events included times around the triggering event during which the envelope exceeded the mean. We examined SWRs when animals were within 20 cm of the center well moving at a linear speed less than 1 cm/s.
We also defined two measures to determine which cells to include in the analysis. Coactivation probability per SWR was the number of SWRs in which both cells in a pair were active, divided by the total number of SWRs. Activation probability per SWR was the number of SWRs in which a single cell was active divided by the total number of SWRs. Only cell pairs with coactivation of at least 0.01 or single cells with activation of at least 0.01 in either correct or incorrect trials were included to exclude cells and cell pairs that never or almost never fired during SWRs. This resulted in the inclusion of a few single cells that were not included in the pairwise analyses (2, 0, 5, and 21 cells from performance categories 1–4). We therefore repeated the analyses with these cells excluded and found that all comparisons remained the same. Only trials with at least one SWR with a pair of coactive neurons were used for the analyses.
Our data set included only well-isolated cells with tightly clustered spikes and clear refractory periods. Because our results involved comparisons of spiking from the same clusters within a day, poor clustering is very unlikely to account for the effects we observed, but we measured isolation distance (Schmitzer-Torbert et al., 2005) for each track and performance category as a secondary check on the data. All analyses were restricted to putative principal neurons with place fields on the track (n = 112, 122, 191, 98, and 128 for animals 1–5, respectively). To identify cells with place fields, we calculated the “linearized” activity of each cell from times when animals were running forward at least 2 cm/s. The behavioral data were separated into different spatial trajectories (e.g., A to B, B to A, and B to C), and the animal’s linear position was measured as the distance in cm along the track from the reward site on the start arm. All the trials when the animal was on that trajectory were included to calculate occupancy normalized firing rate maps. We used 2 cm spatial bins and smoothed with a 4 cm standard deviation Gaussian curve with a total extent of 20 cm. Bins with an occupancy less than 0.1 s were excluded. Cells with a peak linearized firing rate greater than 3 Hz were considered to have a place field on the track. Generally in this maze, cells had only one place field on the track.
Place field peak locations were determined by measuring the distance from the center well to the peak linearized activity. Peaks less than 80 cm from the center well were deemed to be in the center arm, while peaks farther than 80 cm from the center well were deemed past the CP and outside the center arm. To determine which trajectory a cell’s place field was on, we identified the trajectory with the maximum linearized activity. For cells with place field peaks past the CP, the cells usually had place fields in similar locations on both inbound and outbound trajectories, making it difficult to determine whether the reactivation was in a forward or reverse direction. As such, we focused on the direction of propagation of the spatial activity as inbound or outbound. We also noted that cell pairs that were coactive during SWRs generally had place field peaks on the same trajectory.
We chose to examine pairwise coactivation probability during SWRs to avoid sampling issues that arise in the analyses of sequential replay events. Identifying replay events generally requires that each SWR contains spikes from at least five different place cells (Karlsson and Frank, 2009) and, as a result, many events that happen to activate a smaller number of recorded place cells cannot be examined. Further, because the number of active place cells on the two outside arms of the W-track is never identical, there is always a bias toward detecting replay events from one outer arm or the other, and it is not clear how to properly compensate for this bias. This led us to use the most inclusive criterion (pairwise coactivity during SWRs) that still allowed us to measure ensemble neural activity.
To determine whether cells were more coactive during SWRs preceding correct as compared to incorrect trials, we computed the Z score for the difference between coactivation probabilities during SWRs preceding correct and incorrect trials for each cell pair. For each pair of cells with a place field on the track, we computed the coactivation probability for each trial type:
where ncorrect (nincorrect) is the number of SWRs preceding correct (incorrect) trials in which both cells were active and Ncorrect (Nincorrect) is the total number of SWRs preceding correct (incorrect) trials. Our goal was to determine whether the difference in these probabilities, , was consistently different from zero and different from shuffled data across cell pairs. To do so, we used the standard z test for a difference in proportions to convert to a Z score for each cell pair. This involves estimating the SE of the difference based on a binomial distribution:
The Z score for each pair is then across cell pairs. We then examined the Z scores for each performance category and compared those both to zero and to the Z scores derived from shuffling the outcome of each trial, while leaving the structure of neural activity on that trial intact. This shuffling controls for the particular spatial pattern of errors that might arise from turning biases, differences in the number of correct and incorrect trials, etc. We used an essentially identical analysis to examine the single-cell activity across trials, where for single cells ncorrect (nincorrect) is the number of SWRs in which an individual cell was active before correct (incorrect) trials and all other variables are the same.
The advantage of the Z score approach is that it takes into account the number of SWRs observed in estimating the uncertainty in the proportions of SWRs in which a given cell pair was coactive. This approach also assumes that the differences in that proportion are distributed according to a binomial distribution, which is true when the proportions themselves are made up of independent draws from a Bernoulli distribution. Thus, our analyses posit that the probability of a particular cell pair being active in a particular SWR is the same for all SWRs. While this is probably an oversimplification given the complex dynamics of the brain, there is no reason to think that there would be complex differences in dependencies across SWRs before correct and incorrect trials that would result in illusory significance values for our analyses. We also chose to use the number of cell pairs, individual cells, or trials as the N in our statistical analyses, as is standard in the field. We note here that our results are highly significant and consistent across individual animals and across tracks.
We also carried out a complementary analysis to determine whether we could predict the outcomes on individual trials. Our goal here was to use a measure that allowed us to combine multiple run sessions from multiple animals together, and as each run session was associated with a different number of recorded place cells, we measured the proportion of possible cell pairs that were active before each trial. We calculated, for each run session, the total number of possible coactive cell pairs, which is (number place cells recorded) 3 (number place cells recorded − 1)/2. We then determined, for each trial, the number of those cell pairs that were coactive within an SWR preceding that trial and then divided that number by the total to get a proportion.
Given that measure for each correct or incorrect trial, we then used logistic regression to relate the proportion of coactive cells to the trial outcome (correct or incorrect). The model was estimated based on half of the total data, subsampled to include an equal number of correct and incorrect trials from each run session. The specific correct and incorrect trials were chosen at random. We then tested the model prediction on the other half of the data, once again subsampled to include an equal number of correct and incorrect trials from each run session. We repeated that estimation and testing process 1,000 times with different sets of correct and incorrect trials to produce a distribution of predictions and compared that distribution across performance categories and to chance performance of 50% correct.
We also examined the content of individual SWRs. We used our previously developed decoding approach (Karlsson and Frank, 2009) to translate the activity of neurons active during the SWR to a trajectory through space. Briefly, for all SWRs with at least two active place cells, we divided the SWR into 15 ms bins and for each bin used the place fields of neurons active in that bin to derive a probability distribution function over distance from the end of the center arm. For each bin, that pdf represented where we would expect the animal to be on the track given that those cells had fired the observed numbers of spikes. To determine whether a given decoded trajectory was best described as inbound or outbound, we fit a line to samples from the sequence of pdfs plotted versus time. A positive slope corresponds to an outbound trajectory beginning at low distances and proceeding to larger distances. Conversely, a negative slope corresponds to an inbound trajectory beginning at farther distances and proceeding toward the end of the center arm. To determine whether an SWR reactivated the past or future trajectory, we examined the total area under all of the pdfs that represented positions past the CP on the past or future trajectory. We computed a ratio of the areas on the past and future trajectory, (future – past areas)/(future + past areas), such that 1 represents SWR activity that only reactivated the future trajectory and −1 represents SWR activity that only reactivated past trajectories. All SWRs with a past/future area ratio <0 were classified as past, while all SWRs with an area ratio >0 were classified as future. We obtained similar results with cutoffs of ±0.25 and ±0.5. For the past/future analysis, only SWRs with at least one cell active at least 3 Hz at some point past the CP were included. For both analyses, only SWRs with activity from at least two cells were included. For the per trial analysis, only trials in which at least one SWR reached criteria were included.
Finally, we noted that most SWRs included occurred when the animal was facing the well (1,660 SWRs preceding incorrect trials and 4,325 preceding correct trials in T1, 975 SWRs preceding incorrect trials and 2,570 preceding correct trials in T2 when animals were facing toward the well; 31 SWRs preceding incorrect trials and 56 preceding correct trials in T1, 9 SWRs preceding incorrect trials and 14 preceding correct trials in T2 when animals were facing away from the well and toward the choice point). Given the small number of SWRs that occur when the animal faced away from the well, we could not compute meaningful measures of the content of reactivation on these SWRs.
Supplementary Material
ACKNOWLEDGMENTS
We thank members of the Frank laboratory for comments on the manuscript. This work was supported by the John Merck Scholars Program and the U.S. National Institutes of Health research grants RO1MH090188 and F31093067.
Footnotes
SUPPLEMENTAL INFORMATION Supplemental Information includes two figures and one table and can be found with this article online at http://dx.doi.org/10.1016/j.neuron.2013.01.027.
REFERENCES
- Ainge JA, van der Meer MA, Langston RF, Wood ER. Exploring the role of context-dependent hippocampal activity in spatial alternation behavior. Hippocampus. 2007;17:988–1002. doi: 10.1002/hipo.20301. [DOI] [PubMed] [Google Scholar]
- Buzsáki G. Hippocampal sharp waves: their origin and significance. Brain Res. 1986;398:242–252. doi: 10.1016/0006-8993(86)91483-6. [DOI] [PubMed] [Google Scholar]
- Carr MF, Jadhav SP, Frank LM. Hippocampal replay in the awake state: a potential substrate for memory consolidation and retrieval. Nat. Neurosci. 2011;14:147–153. doi: 10.1038/nn.2732. [DOI] [PMC free article] [PubMed] [Google Scholar]
- Cheng S, Frank LM. New experiences enhance coordinated neural activity in the hippocampus. Neuron. 2008;57:303–313. doi: 10.1016/j.neuron.2007.11.035. [DOI] [PMC free article] [PubMed] [Google Scholar]
- Davidson TJ, Kloosterman F, Wilson MA. Hippocampal replay of extended experience. Neuron. 2009;63:497–507. doi: 10.1016/j.neuron.2009.07.027. [DOI] [PMC free article] [PubMed] [Google Scholar]
- Diba K, Buzsáki G. Forward and reverse hippocampal place-cell sequences during ripples. Nat. Neurosci. 2007;10:1241–1242. doi: 10.1038/nn1961. [DOI] [PMC free article] [PubMed] [Google Scholar]
- Dupret D, O’Neill J, Pleydell-Bouverie B, Csicsvari J. The reorganization and reactivation of hippocampal maps predict spatial memory performance. Nat. Neurosci. 2010;13:995–1002. doi: 10.1038/nn.2599. [DOI] [PMC free article] [PubMed] [Google Scholar]
- Ego-Stengel V, Wilson MA. Disruption of ripple-associated hippocampal activity during rest impairs spatial learning in the rat. Hippocampus. 2010;20:1–10. doi: 10.1002/hipo.20707. [DOI] [PMC free article] [PubMed] [Google Scholar]
- Ferbinteanu J, Shapiro ML. Prospective and retrospective memory coding in the hippocampus. Neuron. 2003;40:1227–1239. doi: 10.1016/s0896-6273(03)00752-9. [DOI] [PubMed] [Google Scholar]
- Foster DJ, Wilson MA. Reverse replay of behavioural sequences in hippocampal place cells during the awake state. Nature. 2006;440:680–683. doi: 10.1038/nature04587. [DOI] [PubMed] [Google Scholar]
- Frank LM, Brown EN, Wilson MA. Trajectory encoding in the hippocampus and entorhinal cortex. Neuron. 2000;27:169–178. doi: 10.1016/s0896-6273(00)00018-0. [DOI] [PubMed] [Google Scholar]
- Frank LM, Stanley GB, Brown EN. Hippocampal plasticity across multiple days of exposure to novel environments. J. Neurosci. 2004;24:7681–7689. doi: 10.1523/JNEUROSCI.1958-04.2004. [DOI] [PMC free article] [PubMed] [Google Scholar]
- Girardeau G, Benchenane K, Wiener SI, Buzsáki G, Zugaro MB. Selective suppression of hippocampal ripples impairs spatial memory. Nat. Neurosci. 2009;12:1222–1223. doi: 10.1038/nn.2384. [DOI] [PubMed] [Google Scholar]
- Gupta AS, van der Meer MA, Touretzky DS, Redish AD. Hippocampal replay is not a simple function of experience. Neuron. 2010;65:695–705. doi: 10.1016/j.neuron.2010.01.034. [DOI] [PMC free article] [PubMed] [Google Scholar]
- Jadhav SP, Kemere C, German PW, Frank LM. Awake hippocampal sharp-wave ripples support spatial memory. Science. 2012;336:1454–1458. doi: 10.1126/science.1217230. [DOI] [PMC free article] [PubMed] [Google Scholar]
- Johnson A, Redish AD. Neural ensembles in CA3 transiently encode paths forward of the animal at a decision point. J. Neurosci. 2007;27:12176–12189. doi: 10.1523/JNEUROSCI.3761-07.2007. [DOI] [PMC free article] [PubMed] [Google Scholar]
- Karlsson MP, Frank LM. Network dynamics underlying the formation of sparse, informative representations in the hippocampus. J. Neurosci. 2008;28:14271–14281. doi: 10.1523/JNEUROSCI.4261-08.2008. [DOI] [PMC free article] [PubMed] [Google Scholar]
- Karlsson MP, Frank LM. Awake replay of remote experiences in the hippocampus. Nat. Neurosci. 2009;12:913–918. doi: 10.1038/nn.2344. [DOI] [PMC free article] [PubMed] [Google Scholar]
- Kim SM, Frank LM. Hippocampal lesions impair rapid learning of a continuous spatial alternation task. PLoS ONE. 2009;4:e5494. doi: 10.1371/journal.pone.0005494. [DOI] [PMC free article] [PubMed] [Google Scholar]
- Nakashiba T, Buhl DL, McHugh TJ, Tonegawa S. Hippocampal CA3 output is crucial for ripple-associated reactivation and consolidation of memory. Neuron. 2009;62:781–787. doi: 10.1016/j.neuron.2009.05.013. [DOI] [PMC free article] [PubMed] [Google Scholar]
- Nakazawa K, Sun LD, Quirk MC, Rondi-Reig L, Wilson MA, Tonegawa S. Hippocampal CA3 NMDA receptors are crucial for memory acquisition of one-time experience. Neuron. 2003;38:305–315. doi: 10.1016/s0896-6273(03)00165-x. [DOI] [PubMed] [Google Scholar]
- O’Neill J, Senior TJ, Allen K, Huxter JR, Csicsvari J. Reactivation of experience-dependent cell assembly patterns in the hippocampus. Nat. Neurosci. 2008;11:209–215. doi: 10.1038/nn2037. [DOI] [PubMed] [Google Scholar]
- Schmitzer-Torbert N, Jackson J, Henze D, Harris K, Redish AD. Quantitative measures of cluster quality for use in extracellular recordings. Neuroscience. 2005;131:1–11. doi: 10.1016/j.neuroscience.2004.09.066. [DOI] [PubMed] [Google Scholar]
- Singer AC, Frank LM. Rewarded outcomes enhance reactivation of experience in the hippocampus. Neuron. 2009;64:910–921. doi: 10.1016/j.neuron.2009.11.016. [DOI] [PMC free article] [PubMed] [Google Scholar]
- Smith AC, Frank LM, Wirth S, Yanike M, Hu D, Kubota Y, Graybiel AM, Suzuki WA, Brown EN. Dynamic analysis of learning in behavioral experiments. J. Neurosci. 2004;24:447–461. doi: 10.1523/JNEUROSCI.2908-03.2004. [DOI] [PMC free article] [PubMed] [Google Scholar]
- Wood ER, Dudchenko PA, Robitsek RJ, Eichenbaum H. Hippocampal neurons encode information about different types of memory episodes occurring in the same location. Neuron. 2000;27:623–633. doi: 10.1016/s0896-6273(00)00071-4. [DOI] [PubMed] [Google Scholar]
Associated Data
This section collects any data citations, data availability statements, or supplementary materials included in this article.