Abstract
Although much has been done to elucidate the biochemistry of signal transduction and gene regulatory pathways, it remains difficult to understand or predict quantitative responses. We integrate single-cell experiments with stochastic analyses, to identify predictive models of transcriptional dynamics for the osmotic stress response pathway in Saccharomyces cerevisiae. We generate models with varying complexity and use parameter estimation and cross-validation analyses to select the most predictive model. This model yields insight into several dynamical features, including multi-step regulation and switch-like activation for several osmosensitive genes. Furthermore, the model correctly predicts the transcriptional dynamics of cells in response to different environmental and genetic perturbations. Since our approach is general, it should facilitate a predictive understanding for signal-activated transcription of other genes in other pathways or organisms.
A central goal of systems biology is to understand and predict the complex, stochastic dynamics of gene regulation (1–3). Although biochemical studies have identified many regulatory proteins in these processes, this typically does not enable construction of quantitatively predictive models of transcriptional dynamics. One challenge lies in the fact that gene regulation is a dynamic multi-state process with largely unknown reaction rates. For example, a two-state system may represent closed and open chromatin (4–6) or the presence or absence of a transcription factor (7–9). Including more states or regulatory reactions results in a combinatorial increase in the number of possible model structures (10) and leads to a complicated tradeoff between over-fitting and predictive power.
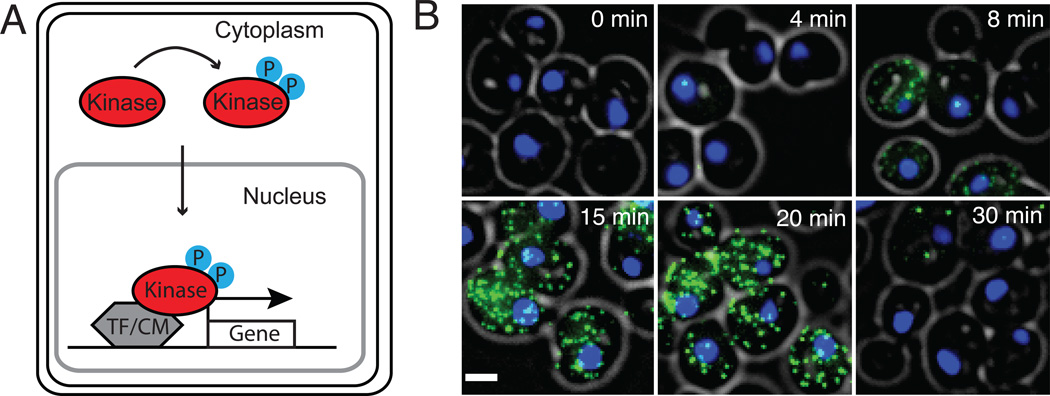
We propose a data-driven comprehensive approach to identify and validate predictive, quantitative models of transcriptional dynamics through the integration of single-cell experiments and discrete stochastic analyses within a system identification framework. We apply this approach to the well-characterized high-osmolarity glycerol (HOG) mitogen-activated protein kinase (MAPK) pathway in S. cerevisiae and focus on the regulation of STL1, CTT1 and HSP12 (11, 12) genes. Upon osmotic shock, the Hog1p-kinase quickly enters the nucleus (Fig. 1A, figs. S3–S4, S6) (13–16), and activates STL1, CTT1 and HSP12 gene expression (Fig. 3B, figs. S6, S9) (17). We find that the Hog1p translocation dynamics is homogenous (14, 15, 17), yet downstream gene activation is heterogeneous among cells (17). To quantify STL1 expression directly, we developed a single-molecule fluorescent in-situ hybridization (smFISH) (18, 19, 26) assay, which captures the stochastic nature of mRNA transcription with high temporal and single-molecule resolution (Fig. 1B) (20, 23, 27).
Fig. 1. Quantitative analysis of single-cell stochastic gene regulation.
A) Schematic of a generic signaling cascade in which a kinase enters the nucleus and interacts with transcription factors (TF) and chromatin modifiers (CM) to regulate gene expression. B) Rapid, stochastic and bimodal activation of endogenous STL1 mRNA expression is detected with single-molecule RNA-FISH (yeast cell: grey circle, DAPI stained nucleus: blue, STL1 mRNA: green dots, scale bar: 2 µm).
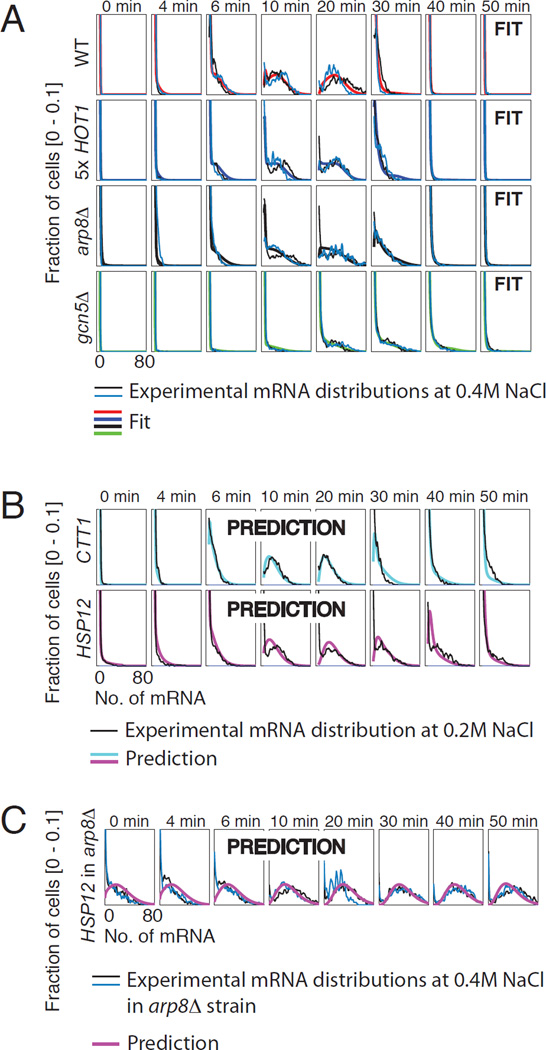
Fig. 3. Model structure validation.
A) Combined fit of the model structure identified (fig. S7) to different genetic mutations affecting STL1 expression at 0.4 M NaCl: WT (red), Hot1p 5x (blue), arp8Δ (black) and gcn5Δ (green). B) Model prediction of CTT1 (cyan) and HSP12 (magenta) expression at 0.2 M NaCl. C) Model prediction for HSP12 expression at 0.4 M in the arp8Δ strain.
In addition to the kinase Hog1p, we consider the effects of the transcription factor Hot1p and the chromatin modifiers Arp8p and Gcn5p that modulate STL1 transcription (17, 21). For this system, we seek to find and validate a model that predicts the system’s dynamic mRNA expression for several genes (STL1, CTT1 and HSP12) in response to environmental and genetic perturbations. We propose a range of model structures, each with a discrete number of states, {S1, S2,…,SN} (Fig. 2A). Each haploid cell occupies one state at a time, and transitions among states are discrete, stochastic events. At least two states are required to explain bimodality, but additional states allow for more complex mechanisms, such as chromatin remodeling or transcription factor binding or release (7–9, 17). Because activated mRNA transcription and degradation rates are constant throughout different conditions (fig. S5), only transition rates can be variable and are assumed to be constant or linearly dependent on the kinase. After identifying the model structure and Hog1p-dependency, we validate the model structure for several mutants and different Hog1p-dependent genes.
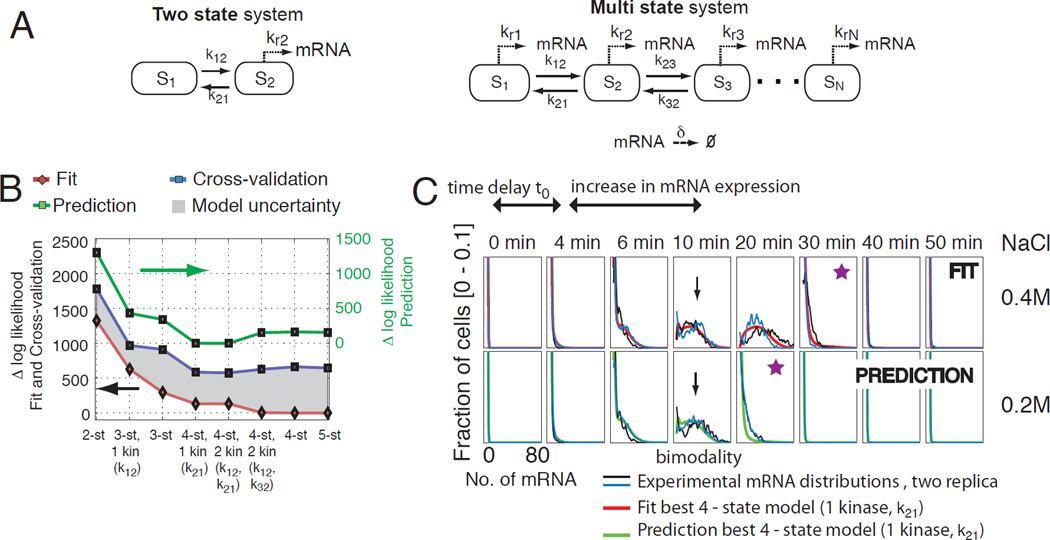
Fig. 2. Identifying a maximally predictive model structure.
A) Two- and Multi-state model structures that allow for kinase, transcription factor, and chromatin modifier dependent activation of gene expression. B) Relative likelihoods of best fit for different model structures at 0.4 M NaCl (red, left axis) and the resulting predictions at 0.2 M NaCl (green, right axis). Cross-validation at 0.4 M NaCl (29) is used to quantify predictive uncertainty (grey region, left axis) and yields excellent a priori knowledge of predictive power (compare blue and green lines). C) mRNA expression distributions at two NaCl levels (black and blue lines) and best fit at 0.4 M (red line) and the corresponding prediction at 0.2 M NaCl (green line). The fit and predictions correspond to the four-state structure with one Hog1p-dependency identified at 0.4M NaCl in (fig. S7). The black arrow indicates the similar mRNA expression levels after an osmotic shock of 0.2M and 0.4M NaCl. The purple star indicates the time point of gene expression deactivation.
To choose the best number of states needed to match STL1 gene expression dynamics, we allow every state transition rate to be Hog1p-dependent. For two-, three-, four- and five-state model structures with any parameter set, we use the Finite State Projection (FSP) approach (22) to formulate a finite set of linear ordinary differential equations that predicts the time varying probability distributions. We adjust the model parameters until the FSP analysis fits the bimodal mRNA distributions at all times (28). As expected, the fit improves as the model complexity increases (Fig. 2B, red line and fig. S11). However, increased complexity leads to greater parametric uncertainty and may diminish predictive power. Applying cross-validation analyses to replicate experiments at 0.4 M NaCl (29), we score all models according to their estimated predictive power (Fig. 2B, blue line). This prediction estimate is validated with additional experiments conducted at 0.2 M NaCl, and we find that cross-validation provides an excellent estimate of predictive power (Fig. 2B, compare blue and green lines and figs. S11 and S12). We find that the two- and three-state models are too simple, whereas the more complex five-state model structure is prone to over-fitting (Fig. 2B and figs. S11 and S12).
We now concentrate our efforts on the four-state model structures and determine which reactions depend upon Hog1p. To identify a Hog1p-model structure with enough flexibility to match the data while avoiding over-fitting, we allow one or two Hog1pdependencies. We then rank the corresponding maximum likelihoods and cross-validate the top ranked Hog1p-model structures. The fit improves with increasing complexity (Fig. 2B red line, fig. S11), while constraining the number of Hog1p-dependencies reduces uncertainty (Fig. 2B and fig. S11). One striking feature of the identified model-structure and its corresponding parameters is that in the absence of Hog1p, a fast reaction from S2 → S1 keeps all cells in the inactive S1 state (fig. S8, red line). When Hog1p exceeds a certain threshold, the gene can transition among the active S2, S3 and S4 states (fig. S8, blue, green and black line). Our final model captures all qualitative and quantitative features of STL1 mRNA expression dynamics after a 0.4 M NaCl osmotic shock (Fig. 2C, top). These features include a constant time delay, t0, between Hog1p translocation and mRNA expression; slow activation of gene expression; transient bimodality in RNA populations; conserved maximal mRNA expression between different conditions; and Hog1p-dependent modulation of gene expression duration. In addition, the model makes the best predictions for the mRNA expression after osmotic shock with 0.2 M NaCl (Fig. 2C, bottom).
In order to test the generality of this model’s predictive power, we collect new data sets at 0.4 M NaCl for several different mutant strains and for different Hog1p-activated genes. The different mutant strains include a five-fold Hot1p over-expression strain and gene knockouts of the chromatin modifiers ARP8 or GCN5. We also consider two additional stress response genes: CTT1 and HSP12. The model identified above fits equally well to the mRNA expression dynamics for STL1 in the Hot1p over-expression strain as well as the arp8Δ and gcn5Δ mutants (Fig. 3A). The same structure also fits the CTT1 and HSP12 mRNA expression dynamics (fig. S9 and fig. S15) with relatively few parameter changes between the different genes and mutations (Tab. S2) (29). The resulting model makes excellent predictions for the dynamics of CTT1 and HSP12 mRNA expression at 0.2 M NaCl (Fig. 3B,C and figs. S9, S16 and S17). Combining the relative changes in the rates measured for STL1 in the mutant ARP8 strains with the rate changes for the CTT1 and HSP12 expression measured in WT strains results in a very good prediction of the CTT1 and HSP12 mRNA expression in the ARP8 mutant strains (Fig. 3C and figs. S16–S17) (28).
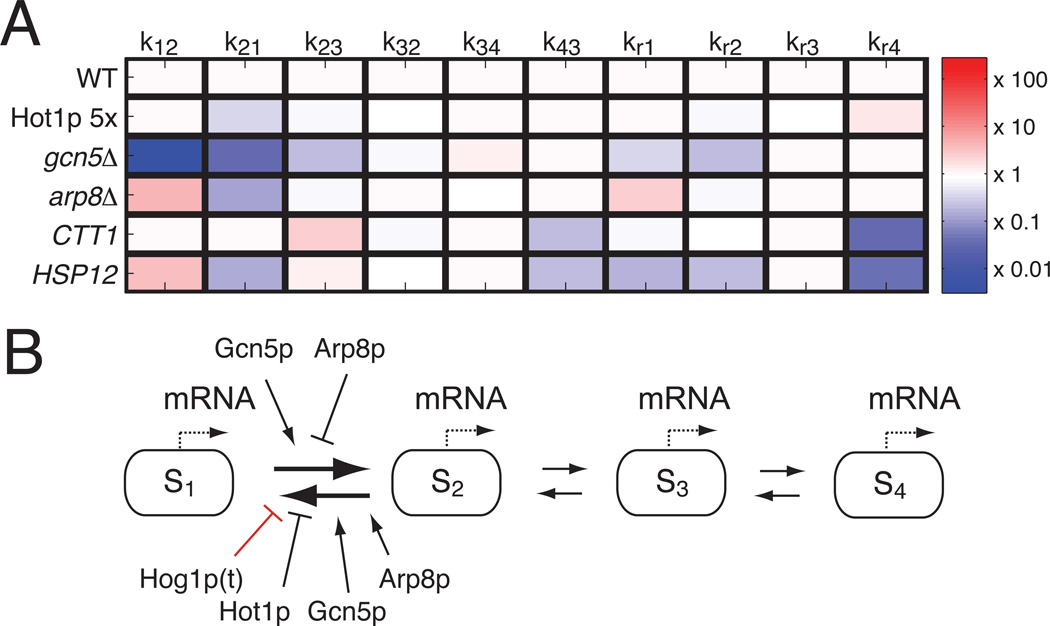
Having determined that the model structure identified above can fit and predict STL1, CTT1 and HSP12 mRNA expression dynamics in different mutant strains, we examine which rates vary most for each mutant and gene in comparison to WT STL1 (Fig. 4A and Table S2). The most variable rates between different mutations are the k12 and k21 transition rates, which indicate that Hot1p, Gcn5p and Arp8p all modulate the transition rates into and out of the S1 state but result in different Hog1p-activation and deactivation thresholds (fig. S10). Other transition rates are affected to a much lower degree.
Fig. 4. Relating model structure to biological function.
A) Mutant and gene specific rate changes relative to STL1. B) Final model, in which Hog1p, Hot1p, Gcn5p and Arp8p regulate transitions between states S1 and S2.
The identified model structure and parameters quantitatively capture and/or predict all of the observed experimental data (Figs. 2–4 and figs. S15–S19). The model also yields several qualitative and quantitative insights, including (1) a switch-like mechanism that activates each gene and stabilizes its activity when Hog1p exceeds a gene-specific threshold, and (2) gene-specific production and degradation rates that are independent of the Hog1p-kinase dynamics. The four-state model structure is essential to explain the temporal dynamics in gene expression observed in all of the experiments. This structure describes an OFF-state, S1, which is the default state in the absence of osmotic shock and three ON-states with different transcription rates and reaction rates between the states. Activation occurs when nuclear Hog1p represses the deactivation rate, k21, subject to the interplay of gene- and mutant-specific (de)activation thresholds (fig. S10 and Table S2). This interplay provides the main knob by which the duration of mRNA expression is finely tuned in response to different environmental conditions (e.g., different salt levels) or to different genetic mutations.
In summary, we have identified a single quantitative model to understand and predict STL1, CTT1 and HSP12 gene expression dynamics in response to various environmental and genetic perturbations. We generated a large range of possible model structures and developed a dynamic single-cell assay with which to discriminate among these model structures. We combined this experimental assay with discrete stochastic analyses and parameter identification approaches. Our cross-validation analyses systematically eliminated over-simplified and over-complex model structures. We eventually selected the model structure and parameters for a single best model to predict STL1, CTT1 and HSP12 dynamics. Furthermore, the identified model provides detailed insight into the biophysical dynamics of signal-activated gene regulation. Since the presented experimental and computational tools are applicable to any gene or signaling-pathway, this integrated identification approach can lead to insights into complex cellular networks for other organisms.
Supplementary Material
Acknowledgments
This work was funded by the National Science Foundation (ECCS-0835847) and Human Frontier Science Program (RGP0061/2011) to MK the National Science Foundation (ECCS-0835623), the NIH/NCI Physical Sciences Oncology Center at MIT (U54CA143874), and a NIH Pioneer award (1DP1OD003936) to AvO., LANL/LDRD to BM, the Deutsche Forschungs Gemeinschaft (Forschungs Stipendium) to GN, and the A*STAR program, Singapore to RZT. We thank F. van Werven with the yeast crosses, and N. Hengartner, B. Pando, S. Klemm, J. van Zon, and M. Wall for discussions on the model. We also thank M. Bienko, N. Crosetto, C. Engert, S. Itzkovitz, JP Junker, S. Klemm, S. Semrau, J. van Zon, and H. Youk for comments on the manuscript.
Footnotes
Supplementary Materials
Materials and Methods
Figs. S1–S19
Tables S1–S2
References (30–39)
References and Notes
- 1.Chuang HY, Hofree M, Ideker T. Annu. Rev. Cell Dev. Biol. 2010;26:721. doi: 10.1146/annurev-cellbio-100109-104122. [DOI] [PMC free article] [PubMed] [Google Scholar]
- 2.Schwartz MA, Madhani HD. Annual Review of Genetics. 2004;38:725. doi: 10.1146/annurev.genet.39.073003.112634. [DOI] [PubMed] [Google Scholar]
- 3.Weake VM, Workman JL. Nat. Rev. Genet. 2010;11:426. doi: 10.1038/nrg2781. [DOI] [PubMed] [Google Scholar]
- 4.Raj A, Peskin CS, Tranchina D, Vargas DY, Tyagi S. PLoS Biology. 2006;4:e309 EP. doi: 10.1371/journal.pbio.0040309. [DOI] [PMC free article] [PubMed] [Google Scholar]
- 5.Raser JM, O'Shea EK. Science. 2004;304:1811. doi: 10.1126/science.1098641. [DOI] [PMC free article] [PubMed] [Google Scholar]
- 6.Ko MS, Nakauchi H, Takahashi N. EMBO J. 1990;9:2835. doi: 10.1002/j.1460-2075.1990.tb07472.x. [DOI] [PMC free article] [PubMed] [Google Scholar]
- 7.Cheung AC, Cramer P. Nature. 2011;471:249. doi: 10.1038/nature09785. [DOI] [PubMed] [Google Scholar]
- 8.Hodges C, Bintu L, Lubkowska L, Kashlev M, Bustamante C. Science. 2009;325:626. doi: 10.1126/science.1172926. [DOI] [PMC free article] [PubMed] [Google Scholar]
- 9.Boeger H, Griesenbeck J, Kornberg RD. Cell. 2008;133:716. doi: 10.1016/j.cell.2008.02.051. [DOI] [PMC free article] [PubMed] [Google Scholar]
- 10.Ma W, Trusina A, El-Samad H, Lim WA, Tang C. Cell. 2009;138:760. doi: 10.1016/j.cell.2009.06.013. [DOI] [PMC free article] [PubMed] [Google Scholar]
- 11.Ferreira C, et al. Mol. Biol. Cell. 2005;16:2068. doi: 10.1091/mbc.E04-10-0884. [DOI] [PMC free article] [PubMed] [Google Scholar]
- 12.Hohmann S. Microbiology and Molecular Biology Reviews: MMBR. 2002;66:300. doi: 10.1128/MMBR.66.2.300-372.2002. [DOI] [PMC free article] [PubMed] [Google Scholar]
- 13.Ferrigno P, Posas F, Koepp D, Saito H, Silver PA. The EMBO Journal. 1998;17:5606. doi: 10.1093/emboj/17.19.5606. [DOI] [PMC free article] [PubMed] [Google Scholar]
- 14.Hersen P, McClean MN, Mahadevan L, Ramanathan S. Proc. Natl. Acad. Sci. U. S. A. 2008;105:7165. doi: 10.1073/pnas.0710770105. [DOI] [PMC free article] [PubMed] [Google Scholar]
- 15.Mettetal JT, Muzzey D, Gomez-Uribe C, van Oudenaarden A. Science. 2008;319:482. doi: 10.1126/science.1151582. [DOI] [PMC free article] [PubMed] [Google Scholar]
- 16.Muzzey D, Gomez-Uribe CA, Mettetal JT, van Oudenaarden A. Cell. 2009;138:160. doi: 10.1016/j.cell.2009.04.047. [DOI] [PMC free article] [PubMed] [Google Scholar]
- 17.Pelet S, et al. Science. 2011;332:732. doi: 10.1126/science.1198851. [DOI] [PubMed] [Google Scholar]
- 18.Raj A, van den Bogaard P, Rifkin SA, van Oudenaarden A, Tyagi S. Nat. Methods. 2008;5:877. doi: 10.1038/nmeth.1253. [DOI] [PMC free article] [PubMed] [Google Scholar]
- 19.Femino AM, Fay FS, Fogarty K, Singer RH. Science. 1998;280:585. doi: 10.1126/science.280.5363.585. [DOI] [PubMed] [Google Scholar]
- 20.Pedraza JM, Paulsson J. Science. 2008;319:339. doi: 10.1126/science.1144331. [DOI] [PubMed] [Google Scholar]
- 21.Alepuz PM, de Nadal E, Zapater M, Ammerer G, Posas F. EMBO J. 2003;22:2433. doi: 10.1093/emboj/cdg243. [DOI] [PMC free article] [PubMed] [Google Scholar]
- 22.Munsky B, Khammash M. J. Chem. Phys. 2006;124:044104. doi: 10.1063/1.2145882. [DOI] [PubMed] [Google Scholar]
- 23.Munsky B, Trinh B, Khammash M. Mol Syst Biol. 2009;5:318. doi: 10.1038/msb.2009.75. [DOI] [PMC free article] [PubMed] [Google Scholar]
- 24.Bongard J, Lipson H. Proc. Natl. Acad. Sci. U. S. A. 2007;104:9943. doi: 10.1073/pnas.0609476104. [DOI] [PMC free article] [PubMed] [Google Scholar]
- 25.Zechner, et al. Proc. Natl. Acad. Sci. U S A. 2012;109:8340. doi: 10.1073/pnas.1200161109. [DOI] [PMC free article] [PubMed] [Google Scholar]
- 26.Bumgarner SL, et al. Molecular Cell. 2012;45:4. doi: 10.1016/j.molcel.2011.11.029. [DOI] [PMC free article] [PubMed] [Google Scholar]
- 27.Munsky B, Neuert G, van Oudenaarden A. Science. 2012;336:6078. doi: 10.1126/science.1216379. [DOI] [PMC free article] [PubMed] [Google Scholar]
- 28.Using full mRNA distributions for fitting yields substantially improved predictions (fig S13) compared to fitting using the procedure in (25) that uses only means and variances
- 29.Materials and methods are available as supplementary material on Science Online.
Associated Data
This section collects any data citations, data availability statements, or supplementary materials included in this article.


