

1 Introduction
According to Genome Sequencing Project statistics (http://www.ncbi.nlm.nih.gov/genomes/static/gpstat.html), as of Feb 16, 2012, complete gene sequences have become available for 2816 viruses, 1117 prokaryotes, and 36 eukaryotes.1–2 The availability of full genome sequences has greatly facilitated biological research in many fields, and has greatly contributed to the growth of proteomics.
Proteins are important because they are the direct bio-functional molecules in the living organisms. The term “proteomics” was coined from merging “protein” and “genomics” in the 1990s.3–4 As a post-genomic discipline, proteomics encompasses efforts to identify and quantify all the proteins of a proteome, including expression, cellular localization, interactions, post-translational modifications (PTMs), and turnover as a function of time, space and cell type, thus making the full investigation of a proteome more challenging than sequencing a genome. There are possibly 100,000 protein forms encoded by the approximate 20,235 genes of the human genome,5 and determining the explicit function of each form will be a challenge.
The progress of proteomics has been driven by the development of new technologies for peptide/protein separation, mass spectrometry analysis, isotope labeling for quantification, and bioinformatics data analysis. Mass spectrometry has emerged as a core tool for large-scale protein analysis. In the past decade, there has been a rapid advance in the resolution, mass accuracy, sensitivity and scan rate of mass spectrometers used to analyze proteins. In addition, hybrid mass analyzers have been introduced recently (e.g. Linear Ion Trap-Orbitrap series6–7) which have significantly improved proteomic analysis.
“Bottom-up” protein analysis refers to the characterization of proteins by analysis of peptides released from the protein through proteolysis. When bottom-up is performed on a mixture of proteins it is called shotgun proteomics,8–10 a name coined by the Yates lab because of its analogy to shotgun genomic sequencing.11 Shotgun proteomics provides an indirect measurement of proteins through peptides derived from proteolytic digestion of intact proteins. In a typical shotgun proteomics experiment, the peptide mixture is fractionated and subjected to LC-MS/MS analysis. Peptide identification is achieved by comparing the tandem mass spectra derived from peptide fragmentation with theoretical tandem mass spectra generated from in silico digestion of a protein database. Protein inference is accomplished by assigning peptide sequences to proteins. Because peptides can be either uniquely assigned to a single protein or shared by more than one protein, the identified proteins may be further scored and grouped based on their peptides. In contrast, another strategy, termed ‘top-down’ proteomics, is used to characterize intact proteins (Figure 1). The top-down approach has some potential advantages for PTM and protein isoform determination and has achieved notable success. Intact proteins have been measured up to 200 kDa,12 and a large scale study has identified more than 1,000 proteins by multi-dimensional separations from complex samples.13 However, the top-down method has significant limitations compared with shotgun proteomics due to difficulties with protein fractionation, protein ionization and fragmentation in the gas phase. By relying on the analysis of peptides, which are more easily fractionated, ionized and fragmented, shotgun proteomics can be more universally adopted for protein analysis. In fact, a hybrid of bottom-up and top-down methodologies and instrumentation has been introduced as middle-down proteomics.14 Essentially, middle-down proteomics analyzes larger peptide fragments than bottom-up proteomics, minimizing peptide redundancy between proteins. Additionally the large peptide fragments yield similar advantages as top-down proteomics, such as gaining further insight into post-translational modifications, without the analytical challenges of analyzing intact proteins. Shotgun proteomics has become a workhorse for the analysis of proteins and their modifications and will be increasingly combined with top-down methods in the future.
Figure 1.

Proteomic strategies: bottom-up vs. top-down vs. middle-down. The bottom-up approach analyzes proteolytic peptides. The top-down method measures the intact proteins. The middle-down strategy analyzes larger peptides resulted from limited digestion or more selective proteases. One or more protein or peptide fractionation techniques can be applied prior to MS analysis and database searching.
In the past decade shotgun proteomics has been widely used by biologists for many different research experiments, advancing biological discoveries. Some applications include, but are not limited to, proteome profiling, protein quantification, protein modification, and protein-protein interaction. There have been several reviews nicely summarizing mass spectrometry history,15 protein quantification with mass spectrometry,16 its biological applications,5,17–26 and many recent advances in methodology.27–32 In this review, we try to provide a full and updated survey of shotgun proteomics, including the fundamental techniques and applications that laid the foundation along with those developed and greatly improved in the past several years.
2 Techniques
2.1 Protein extraction and isolation methods
Proteins are part of a complex network of interacting biomolecules that regulate their function and localization within the cell. Extraction and isolation of proteins from chemical and physical interactions with other biomolecules from specific cellular sub-compartments has become a critical step for their global analysis in a biological context. In some cases, physical and chemical interactions may otherwise inhibit the isolation or analysis of proteins of interest by LC-MS. The global analysis of membrane-embedded proteins is a prominent example. Isolation, solubilization, and proteolytic digestion of lipid-bound proteins have all proven to be essential steps in their shotgun proteomic analysis. The integration of multiple methodological advancements for analysis of membrane-bound proteins is described in the “Proteolytic Digestion and Chromatographic Separations” sections. Another noteworthy example of protein isolation from interactions with other non-protein biomolecules that improved proteomic analysis was recently demonstrated with transcription factors (TF). Under specific biological conditions, TFs form complexes with high affinity for DNA. Until recently their proteomic analysis was thought to be limited by their low abundance, but was instead due to inadequate disruption of TF-DNA interactions. The degradation of DNA using a combination of deoxyribonucleases improved the recovery of transcription factors from standard hypotonic-lysed cells, facilitating their targeted proteomic analysis.33 Proteins have also been isolated from more rigid structures, such as bone tissue using hydrochloric acid, allowing for the identification of ~2,500 proteins with shotgun proteomics.34
Application of traditional subcellular isolation techniques, primarily sucrose gradient sedimentation and similar methodologies, from different cell types and tissues have allowed for global analysis of proteins within subcellular compartments. Studies of the differential expression and trafficking of proteins between subcellular compartments are important to understanding proper cellular function. Characterization of the principal subcellular proteomes, nuclear and cytosolic, has been performed on yeast,35–36 leukemia cells,37 a bronchitis virus cellular model,38 and an autoimmunity cell model.39 A study of mouse liver used protein correlation profiling to map ~1,400 proteins to 10 subcellular localizations with validation by enzymatic assays, marker protein profiles, and confocal microscopy.40 Further studies have teased apart finer subcellular compartments, such as the nucleolus. Significant changes to the nucleolar proteome were found upon infection with the Influenza A virus.41 Many studies have begun to interrogate the energy-producing organelle within the cell, the mitochondrion. Mitochondrial proteins have been identified from C. elegans,42 rat liver,43 and leukemia cell lines44 by coupling biochemical sedimentation purification with shotgun proteomic analysis. Similarly, the protein post-translational modifications phosphorylation and carbonylation have been identified from mitochondrial preparations of murine heart and skeletal muscle, respectively.45–46 A quantitative comparison of mitochondrial proteins among rat heart, liver, and muscle tissues found essentially the same proteins with tissue-specific abundances.47 Combining many of these methodologies, approximately 22 protein abundance changes were found among subcellular fractions due to myocardial ischemia.48 Another highly studied subcellular fraction using proteomic methods is the synaptosome. Studies on the synaptosome have implications in many aspects of neuroscience research. The synapse is the biochemical communication junction unique to neuronal cells and can be isolated within a synaptosomal preparation from multiple differential centrifugation steps. As with all subcellular proteomic studies discussed thus far, the quality of the data is heavily dependent on the purity of the subcellular preparation. In the case of the synaptosome, correlation-profiling has been employed to validate post-synaptic density proteins.49 Similar quantitative proteomic methodologies have facilitated the characterization of post-synaptic density proteins between rat forebrain and cerebellum,50 hippocampal synaptosome protein changes in CAM kinase II mutant mice,51 and synaptosomal protein dynamics and spatiotemporal dynamics of synaptosomal and non-synaptosomal mitochondrial proteins during brain development.52–53 Quantitative phosphoproteomic analysis of KCl-activated synaptosomes found a uniquely regulated phosphorylation site on the glutamate receptor subunit GluR1.54 Further advances in subcellular fractionation and proteomic methodologies will aid in understanding the complex dynamics of proteins among cellular sub-compartments.
2.2 Protein depletion and equalization methods
Protein dynamic range is the largest challenge that faces proteomics technology development. Currently, all steps within an LC-MS proteomics pipeline are protein abundance-dependent. Thus, adjustment of protein concentration dynamic range has become an option for improving comprehensiveness through improved analysis of low abundance proteins. Two main approaches are used for protein dynamic range adjustment: (1) selective depletion of known high abundance proteins and (2) selective equalization of protein dynamic range using combinatorial ligand libraries. In particular, both of these strategies have proven most useful for the analysis of plasma and other clinical samples. Specific applications of this will be described in the “Clinical Applications” section. Clinical samples for proteomic analysis are often more complex than model systems and present higher protein dynamic ranges, up to nine orders of magnitude.55 Fortunately, only a few proteins are extremely abundant, such as serum albumin in the case of plasma, and thus can be specifically removed or depleted prior to LC-MS analysis. Chemical-based approaches can selectively precipitate abundant proteins, usually albumin, from plasma to improve proteomic depth and have been demonstrated with sodium chloride and ethanol,56 acetonitrile,57 the disulfide reducing agents DTT and TCEP,58 and ammonium sulfate.59 Antibody arrays against the highest abundance proteins have also improved proteomic coverage of clinical samples,60 yet there remain significant short comings for the analysis of low abundance proteins.61 Although relatively effective, another drawback to antibody depletion methodologies is the high cost of reagents (Sigma 20 protein single depletion kit - $1,200). Additionally, since the depletion efficiency relies on the binding capacity of the antibodies only small sample amounts (8 μL plasma) can be depleted. Ultimately this depletion capacity can limit the starting mass of low abundance proteins within the sample. Nonetheless, antibody depletion is a critical step for most clinical applications.
Protein abundance dynamic range adjustment using combinatorial ligand libraries is an alternative, cheaper, and more holistic approach. Bead-bound combinatorial peptide ligand libraries simultaneously deplete abundant proteins while enriching low abundance proteins62 and can be performed for $50 per experiment. The equalization strategy is the converse of depletion strategies in that proteins which bind to a bead-conjugated hexapeptide ligand are collected and used for analysis. The combinatorial hexapeptide library serves as a large collection of ligand epitopes for proteins to bind. Additionally, hexapeptide ligands are assumed to be at approximately equimolar amounts, allowing for equalization of protein concentration. An obvious drawback to this methodology is that for a protein to be retained for analysis it must have affinity for one of the millions of possible hexapeptide ligands that are represented on the bead library used.63 High abundance proteins that saturate their equimolar hexapeptide ligands can be washed away, while low abundance proteins can be concentrated and enriched on the solid-phase beads, especially if they have high affinity for their associated ligand or ligands. The benefits of protein equalization with hexapeptide beads in conjunction with shotgun proteomics was demonstrated on a model human cell line.64
More recently, classic Michaelis-Menten enzyme kinetics were exploited to equalize proteomes in an unbiased fashion.65 The methodology cleverly uses a protease, already used in shotgun proteomic pipelines, to selectively digest abundant proteins into peptides for removal with a molecular weight cutoff spin-filter. The remaining less abundant, undigested proteins are then also digested to completion, as routinely performed and described in the following section. With the abundant proteins depleted and the proteome equalized, dramatic improvements were observed in the total number of protein identifications and the sequence coverage and quantitation metrics of low abundance proteins. This strategy directly addresses one of the most daunting challenges of globally analyzing proteomes, protein abundance dynamic range, and presents a simple and versatile strategy to significantly improving shotgun proteomic analysis.
2.3 Proteolytic digestion methods
Analysis of proteins from their proteolytic peptides circumvents some of the challenges associated with intact protein separation, ionization, and MS characterization. A protein lysate is a highly heterogeneous mixture of proteins with diverse physicochemical properties. Purposefully increasing the complexity of a sample prior to analysis is somewhat counter-intuitive. However, selective protease digestion acts to normalize and compartmentalize the biochemical heterogeneity of proteins within a sample as peptides and may, in fact, create a less heterogeneous mixture when protein splice isoforms and post-translational modifications are considered. Additionally, with multiple representations of a protein as peptides the probability of sampling and identifying a peptide associated with a particular low abundance protein and/or post-translational modification increases.
In general, proteolytic enzymes differ by their specificity for cleaving the amide bonds between individual residues in a protein. Commonly used proteases with their biochemical specificity and applications are listed in Table 1. The cleavage is carried out through hydrolysis of the amide bond before or after a specific residue, residues, or combination of residues. Trypsin has become the gold standard for protein digestion to peptides for shotgun proteomics. Trypsin is a serine protease which cleaves at the carboxyl side of arginine and lysine. This sequence-specific information has been used to filter identified peptides. However, high accuracy mass spectrometers have reduced the importance of this filtering criterion and allowed for identification of non-tryptic protein sequences and post-translational modifications where trypsin cleavage is inhibited.66–68 For low complexity samples, such as protein complexes, the combination of both highly selective and non-selective proteases improves protein and post-translational modification coverage. 69–70 For complex proteomic samples, the utilization of a combination of highly selective proteases improves protein and proteome coverage and sensitivity by creating complementary peptides.71–72 These multi-protease analyses are performed in parallel, as a systematic study showed that purposefully creating more peptides with two proteolytic enzymes reduced the number of proteins identified.73 Similarly, parallel analysis of a tryptic digestion and subsequent proteolytic digestion with Glu-C after size-based isolation of long tryptic peptides improved protein, proteome, and phosphorylation identification coverage.74 Related studies also illustrated the effects of protease biases on global phosphorylation identification studies based on identified phosphorylation motifs.75–77
Table 1.
Common proteases used for shotgun proteomics.
| Protease | Cleavage Specificitya | Common proteomic usage |
|---|---|---|
| Trypsin | -K,R-↑-Z- not -K,R-↑-P- | General protein digestion |
| Endoproteinase Lys-C | -K-↑-Z- | Alternative to trypsin for increased peptide length; multiple protease digestion; 18O labeling |
| Chymotrypsin | -W,F,Y-↑-Z- and -L,M,A,D,E-↑-Z- at a slower rate | Multiple protease digestion |
| Subtilisin | Broad specificity to native and denatured proteins | Multiple protease digestion |
| Elastase | -B-↑-Z- | Multiple protease digestion |
| Endoproteinase Lys-N | -Z-↑-K- | Increase peptide length; create higher charge state for ETD |
| Endoproteinase Glu-C | -E-↑-Z- and 3000 times slower at -D-↑-Z- | Multiple protease digestion; 18O labeling |
| Endoproteinase Arg-C | -R-↑-Z- | Multiple protease digestion |
| Endoproteinase Asp-N | -Z-↑-D- and -Z-↑-cysteic acid- but not -Z-↑-C- | Multiple protease digestion |
| Proteinase K | -X-↑-Y- | Non-specific digestion of membrane-bound proteins |
| OmpT | -K,R-↑-K,R- | Increased peptide length for middle-down proteomics |
B – uncharged, non-aromatic amino acids (i.e. A, V, L, I, G, S); X – aliphatic, aromatic, or hydrophobic amino acids; and Z – any amino acid.
Digestion efficiency has been optimized based on a number of reaction conditions. In particular, adequate solubilization and unfolding of all proteins in a complex mixture is important to provide a protease access to cleavage sites. The use of organic solvents during trypsin digestion has been shown to improve digestion efficiency based on peptide identifications, protein sequence coverage, and trypsin specificity on protein complex purifications78–79 and complex proteomic mixtures.80 SDS remains one of the best protein solubilizers, but is detrimental to LC-MS peptide sensitivity, as are most traditional surfactants, so strategies for removal are continually developed. SDS works well with protease digestions because it is a strong chaotropic agent, or chaotrope – a substance which denatures and disrupts the structure of macromolecules. A chaotrope swapping strategy was previously demonstrated81 for removal of SDS while maintaining protein denaturation and was recently reintroduced as beneficial with higher sensitivity mass spectrometers.82 As an alternative to pre-digestion removal of SDS, a KCl precipitation strategy was demonstrated post-digestion to provide the benefits of SDS-assisted proteolytic digestion without the detrimental effects during LC-MS analysis.83 A number of LC- and MS-compatible surfactants have also been developed and evaluated to improve protein identification comprehensiveness.80,84 Generally, the commercially-available MS-compatible surfactants (e.g. ProteaseMAX, Invitrosol, Rapigest, PPS Silent Surfactant) have an acid labile moiety within the surfactant structure so it can be degraded during or after digestion and prior to LC-MS. The degradation creates components which do not co-elute with peptides during LC-MS, making them compatible with common shotgun proteomics methods. Two less-common, volatile surfactants which can be evaporated prior to LC-MS have also proven useful for solubilization and digestion of membrane-bound proteins: perfluorooctanoic acid85 and 1-butyl-3-methyl imidazolium tetrafluoroborate.86 As an alternative to surfactants, trifluoroethanol has proven useful for concurrent protein extraction and denaturation for mass-limited samples where sample clean-up is usually detrimental to sensitivity.87 Avoidance of chaotropes for protein solubilization through the use of ammonium bicarbonate alone was proposed to improve detection limits in an analysis of a few hundred to thousand cancer cells.88
Modification of protein digestions using physical methods has also contributed to improved digestion efficiency and proteomic coverage. Digital microfluidics allowed for automation of sample clean-up and protein digestion steps for MALDI to improve sensitivity.89–93 Covalent and dynamic immobilization of trypsin within microreactors,94–95 on microparticles96 and nanoparticles97 and the use of focused highly-intensity ultrasound98–99 and microwave100–103 heating have improved the kinetics of tryptic digestion, reducing digestion time. The immobilization of proteases on microwave-absorbing microspheres and nanoparticles further improved speed and efficiency.104–105 Microwave heating of proteins under acidic conditions selectively cleaves proteins at aspartic acid residues, creating complementary peptides of similar length to trypsin digestion.106–107 Sequential microwave-assisted acid hydrolysis and overnight protease digestion proved useful for the digestion of extremely thermal- and biochemically-stable proteins from the hyperthermophile Pyrococcus furiosus.108 Raising the pressure of proteolytic digestion has also improved the efficiency of proteolytic digestion,109 presumably by improved unfolding of proteins and greater mixing, and allowed for online digestion within an LC-MS pipeline.110
2.4 Protein separation and fractionation methods
Two dimensional polyacrylamide gel electrophoresis (2D-PAGE) is a powerful method for the separation of complex mixtures of proteins for proteomic analysis.111,112 This method is based on molecular mass and charge and is capable of separating several thousands of intact proteins on a single gel. Following separation on 2D-PAGE, proteins can be identified as intact proteins or peptides using MALDI-MS or with LC-MS after an in-gel digestion.113
A combination of detergents (such as SDS and CHAPS) and chaotropes (such as urea and thiourea) have generally been used for solubilization and denaturation of protein samples prior to separation on the 2D gel.114,115 Solubilized proteins are separated by isoelectric focusing (IEF), where a gradient of pH is applied to a gel, followed by application of an electric potential. Development of immobilized pH gradient (IPG) strips, which are far simpler to use than carrier-ampholyte-driven pH gradients, has led to greater popularity of the 2D method in the proteomics field. Enhanced reproducibility and generation of various pH gradient types, such as basic gradients,116 non-linear pH gradients,117 or narrow pH gradients118 using plastic-supported IPG strips have been reported.
After 2D-PAGE separation, proteins can be detected by Commassie Brilliant Blue or silver staining. Despite greater sensitivity, silver staining does not show linearity of signal and is less compatible with MS, therefore Commassie Brilliant Blue is most commonly used.119 A formaldehyde-free silver staining method that is compatible with MS has been developed.120 The Pro-Q Diamond and Pro-Q Emerald staining methods have been developed for phosphoproteins and glycoproteins, respectively.121,122
Use of 2D-PAGE is labor-intensive and time-consuming, with a low dynamic range and significant gel-to-gel variation.123 Introduction of 2D difference gel electrophoresis (DIGE) has overcome some of the drawbacks associated with use of 2D gel electrophoresis, and provides more accurate and sensitive results. This method utilizes the fluorescent property of Cy3 and Cy5 N-hydroxysuccinimidyl ester cyanines, which show different excitation fluorescent spectra at different wavelengths. Typically, two samples are labeled with fluorescent dyes Cy3 and Cy5, respectively, and an internal standard is labeled with Cy2. The three samples are mixed and analyzed on one gel,124 which permits measurement of protein amount in each sample relative to the internal standard in which the amount of each protein is known. Software such as DeCyder can be used for the detection of spots, and for normalization and analysis of data, which can increase quantitative accuracy and speed. Gel spots can also be digested by trypsin, and analyzed by MALDI-ToF, which generates a peptide mass fingerprint, or LC-MS/MS, which can provide peptide sequence information.
High resolution separation of intact proteins based on protein size is a unique characteristic of 2D-PAGE. This feature can also be used to identify proteins which are degraded under specific conditions such as apoptosis. In one such study, cell extracts were treated with and without the proteases granzyme B125 and caspase 3126, then run on 2D PAGE to find differences. By taking advantage of the change of pI induced by various modifications such as phosphorylation, 2D-PAGE can also be applicable to study of PTMs. Phosphorylation primarily changes the pI of proteins which results in a shift in the mobility pattern in a horizontal direction on the gel. The modified form shows an extra spot, which does not migrate together with the principal spot, and modified peptides can be identified using MS. 2D gel-based proteomics is a mature technology that has been employed in proteomics for over 3 decades and is still useful to study bacterial proteomics with low complexity,127 intact protein with post-translational modifications128 and as a micropreparative tool,129 among other things.
The development of LC-MS/MS technologies has led to a reduction in 2D gel-based separations, but 1D-SDS-PAGE remains a standard separation method for complex protein mixtures based on their molecular weight.130 Separated complex protein mixtures are cut into 10–20 gel slices and each gel band is digested by in-gel trypsin method.131 The methodology has been standardized as GeLCMS (gel-enhanced LC-MS) to represent the hybrid gel and LC-MS analysis.132 Compared to gel-free methods, this method has some important advantages, including differentiating splice isoforms and degraded proteins and removal of low molecular weight impurities such as detergents and buffer components, which are detrimental for MS analysis. However, both sample loss to the gel and residual SDS, can limit sensitivity and comprehensiveness. The other, orthogonal separation from 2D gel electrophoresis, isoelectric focusing, has also been exploited for protein separation prior to LC-MS. An immobilized pH gradient strip in the Off-Gel™ electrophoresis (OGE) system focuses proteins based on their pI, allowing for their recovery in the liquid-phase.133 Improvements from protein fractionation by OGE and bottom-up proteomic analysis were demonstrated with a human plasma sample.134 A comparative GeLCMS analysis with a solution-phase IEF separation identified 25% more proteins and improved reproducibility to 96%.135 Free-flow electrophoresis followed by RPLC was used to fractionate proteins from a model cell line and human serum prior to MS/MS identification as peptides.136–137 Chromatofocusing138 and size-exlusion chromatography (SEC)139 have also been used prior to shotgun proteomic workflows to improve comprehensiveness. Combining solution IEF, RPLC, and 2DIGE, as an intact protein analysis system (IPAS), was used to quantitatively profile the human plasma proteome.140 A similar methodology which followed solution IEF and RPLC, using the Proteome Lab™ PF 2D platform, by LC-MS analysis fractionated and identified proteins from human plasma gel-free.141
2.5 Peptide ionization, separation, and fractionation methods
Shotgun proteomics has become a widely used method for multiple reasons. One notable reason is the amenability of common analytical chromatography methods for separation of peptides prior to ESI-or MALDI-MS/MS. Since the initial demonstrations of online solid-phase extraction, strong cation exchange fractionation, and nanoflow liquid chromatography for direct ESI with homemade columns,8 numerous academic and commercial configurations have been reported which further automate and improve the process. As a sign of the wide-spread need and benefits, commercial supplies and comparable configurations are available from Agilent Technologies Inc., New Objective Inc., and Shotgun Proteomics Inc.
The two main ionization methods used for charging and transferring peptide into the gas-phase in shotgun proteomics are nanoelectrospray (nESI)142 and MALDI.143 nESI has been generally coupled with RPLC separations and MALDI with gel-based separations. MALDI is most often performed by transferring proteins or peptides from a gel to a support or substrate,144 but methodologies were developed to perform MALDI directly from 2D gels to simplify the process and improve reproducibility.145–146 There has also been significant cross-over of separation and ionization methods in both application and development of new ionization strategies. These include coupling HPLC147 and CE148 to MALDI in online149 and offline150–151 peptide fractionation modes. Collection of peptides from HPLC onto MALDI plates allowed for exclusion of redundant peptides from replicate analyses.152 Due to the higher tolerance to surfactants than ESI, LC-MALDI was more comprehensive and complementary to gel and standard LC-ESI methods.153 Desorption ESI (DESI), where ESI can be used to vaporize deposited peptides from a substrate, has been described for bottom-up proteomic analysis.154–155 Other similar methods which combine DESI and MALDI have also been demonstrated,156–157 including the capability to perform chemical reactions.158 Laserspray ionization (LSI) has also produced ESI-like peptide spectra from a standard MALDI plate.159 Capacitive charging of a number of substrates has been used to ionize peptides through electrostatic-spray ionization (ESTASI).160 Peptides have even been vaporized and ionized from a solid-state small molecule matrix solely by introduction to vacuum, yielding ESI-like peptide charge states.161 Similarly, new ESI-like ionization methods have either completed removed the electrical potential or changed the way it is applied to improve sensitivity and selectivity. Simple placement of the outlet of a HPLC column into the heated mass spectrometer inlet under vacuum, deemed solvent-assisted inlet ionization (SAII), vaporizes peptides with similar charge states to ESI and greater sensitivity.162 SAII has shown to maintain chromatographic peak shape and is compatible with μL/min and nL/min flow rates.163–164 Through application of an AC voltage, inductive ESI can control the charge state of peptides.165 Introduction of an inverted post-column makeup flow during gradient elution HPLC improved ESI signal stability throughout the separation.166 Continued improvements to peptide ionization methods will surely aid in shotgun proteomics, likely through improved sensitivity and expansion of MS-compatible liquid-phase separations.
Peptide chromatography and mass spectrometry are dramatically simpler both theoretically and experimentally than at the protein level, making methods to analyze proteins at the peptide level more straightforward. However, rigorous LC separation of peptides is critical for detection of peptides from a complex proteomic mixture for a number of reasons. Generally, in order for a peptide to be sampled for fragmentation its precursor intensity must be both above background noise and more abundant than other peptide ions measured simultaneously. Resolution of peptides of similar masses is essential in order to acquire distinct, non-mixed fragmentation spectra. This criterion is best met by separation in the liquid phase through chromatography since differences in charge and hydrophobicity can be exploited. Adequate chromatographic separation is also crucial for effective electrospray ionization (ESI). Although ESI is a powerful, relatively unbiased method for introducing peptides into the gas phase, it can easily be crippled by ionization suppression. Attempting to electrospray many analytes simultaneously, whether peptides or contaminants, results in ionization of only the most hydrophobic molecules.167 This concept has resonated in the shotgun proteomics community over the years and has been reconfirmed recently in both untargeted and targeted peptide analyses.168–169 In fact, exploiting this concept by increasing the hydrophobicity of peptides through alkylation of primary amines has increased ionization efficiency and signal intensity.170 Thus resolution of peptides prior to ESI-MS/MS is of utmost importance. The challenge of adequate separation of peptides from a complex mixture becomes particularly evident from an examination of a yeast proteome, which, with ~7000 gene products, is far less complex than a comparable human sample. A theoretical in silico digestion generated ca. 300,000 peptides.171 This number of peptides is already nearly 10 times greater than the number that is commonly identified in a single comprehensive proteomic analysis. The most complex human samples, such as plasma, can have a concentration dynamic range as high as 12 orders of magnitude with potentially 25,000 gene products55 and even model organisms like C. elegans and D. melanogaster are predicted to have nearly as many genes as humans.172–173 The first comprehensive proteomic analyses of model organisms using state-of-the-art proteomics technology, which exploited multidimensional separations of peptides, identified 2,388 (S. cerevisiae),174–175 10,631 (C. elegans),176 and 9,124 (D. melanogaster)177 proteins. More recent analyses with both improved peptide separations and more sensitive mass spectrometers have boosted protein identification numbers for yeast above 4000 proteins.178–179
Early and more recent applications of mass spectrometry for proteomics used either gel-based or offline LC fractionation of peptides. Although many of these methodologies are still useful for targeted and global proteomic studies, the largest gains in sensitivity from peptide separations were initially demonstrated and still used today by coupling nanoelectrospray142 to reverse-phase nanoflow liquid chromatography (nLC). A representative base peak chromatogram is shown in Figure 10a. Peptides were loaded directly onto a homemade nLC capillary column, separated based on hydrophobicity, and were directly electrosprayed from the capillary tip into the mass spectrometer.180–181 The sensitivity of this methodology, which avoids the use of auto samplers, was dramatically redemonstrated in the phosphoproteomic analysis of ~10,000 cells.182 Employing proven chromatographic technological improvements has also benefited in shotgun proteomic analysis. Reducing the column inner diameter and eluent flow to low nanoliter per minute rates while increasing the column length has produced similar results to longer multidimensional separations through both increased peak capacity and ionization efficiency.183 High temperature RPLC has proven essential for the separation and identification of hydrophobic peptides from membrane-embedded proteins.184 Sub-zero RPLC reduced back-exchange and improved dynamic range in amide hydrogen/deuterium exchange experiments.185
Figure 10.

Representative LC-MS/MS data and a generalized bioinformatic analysis pipeline for protein identification and quantification in shotgun proteomics. (a) As a total ion chromatogram is acquired by nESI-MS from the nLC separation of peptides, the mass spectrometer acquires both full scan MS (MS1) precursor spectra and data-dependent MS/MS (MS2) fragmentation spectra. All ions, typically between 300 – 2000 m/z, are detected during nLC in the full MS scans. The full scan defines the most abundant peptide precursor ions which are sampled by data-dependent for MS/MS. (b) The acquired data is then processed through a bioinformatics pipeline. A database search is used to match theoretically generated peptide fragmentation spectra to experimental MS2 fragmentation spectra, creating a list of peptide candidates for each experimental spectrum. The peptide candidates are ranked and filtered to create peptide spectrum matches (PSMs) and peptide identifications. PSMs can be filtered by XCorr using the “incorrect” reverse PSMs as an estimation of false discovery rate (FDR). In high mass accuracy experiments, prior to XCorr filtering a mass error window can be used to prefilter PSMs based on the precursor mass measurement from MS1 scans. If a systematic mass error is “observed”, it can be “corrected” by adding or subtracting the average mass error. Identified peptides are assigned to proteins by inference to create a list of proteins present within the sample. The relative protein quantification is then performed by averaging the peptide ratio measurements for peptides assigned to the protein. These same strategies can be used for post-translational modification (PTM) identification and quantification, by using a peptide as a surrogate measurement of the PTM.
Cutting-edge separation technology has begun to further impact the capabilities of shotgun proteomics, including the use of ultrahigh pressure liquid chromatography (UPLC) developed by Jorgenson.186 Reductions in chromatographic resin particle size, and thus peptide peak width, have increased peptide identification efficiency, sensitivity, and reproducibility.187 A capillary column frit commonly used in proteomics was designed specifically for UPLC analysis.188 A detailed study of synthetic peptides illustrated the capabilities of UPLC to separate peptide isomers and conformers.189 Coupled with improvements to mass spectrometer speed, UPLC separation efficiency has facilitated identification of 78% of the validated yeast proteome with a single 4 hr separation dimension and six replicate runs179 and over 1400 human proteins in less than a half hour.190 Superficially porous HPLC particles have also been shown to improve separation efficiency, but have yet to be tested on complex peptide mixtures with MS/MS.191–195 Monolithic columns have provided separation benefits without the backpressure restrictions from smaller particles. As a result, extremely long columns (2–4 m) running an ~8 hr separation facilitated the identification of 22,196/2,602 peptides/proteins from E. coli, 41,319/5,970 from HeLa cells, and an astounding 98,977/9,510 from human induced pluripotent stem cells.196–198
The aforementioned peptide separations have relied almost exclusively on RPLC prior to ESI, but two alterative analytical separations provide different peptide retention mechanisms with ESI-compatible buffers. HILIC separates peptides based on their hydrophilic interactions with an ionic resin and has found most application in peptide fractionation and PTM analysis.199 An organic to aqueous gradient, inverse to RPLC, generally inverts peptide retention order. HILIC-ESI-MS of peptides has been performed with packed200 and monolithic201 columns, but has yet to be exploited for shotgun proteomic analysis. ERLIC is a specific form of HILIC, using a weak anion exchange (WAX) resin. Unlike RPLC, peptides are retained under two separation modes. Early in the organic to aqueous gradient hydrophilic interactions dominate, as in HILIC and inversely to RPLC. However, as the aqueous content of the elution buffer is increased, basic peptides electrostatically repel the WAX resin while acidic peptides are retained until their hydrophilic interaction with the WAX resin is disrupted late in the gradient. These superimposed separation mechanisms with ERLIC distribute peptides over the gradient better than RPLC and outperform it based on peptide and protein identifications by higher confidence spectral matching of larger peptides.202 Capillary electrophoresis has also reemerged as a complementary, more sensitive, and viable option in shotgun proteomics, largely due to improvements in electrospray interfaces.203–209
Fractionation of peptides prior to nLC-ESI to improve comprehensiveness was initially performed online with SCX resin,8,10,175,210 minimizing sample losses from transfers intrinsic to offline fractionation and auto samplers. Addition of WAX resin with the SCX resin in a mixed-bed format exploited the Donnan effect and increased peptide recovery, reduced carryover between salt elutions, improved separation orthogonally, and led to identification of twice as many peptides and phosphopeptides in separate analyses.211 The use of WAX alone with a pH-based elution also improved reproducibility and reduced carryover between fractions.212 Other online systems have performed a RPLC separation at high pH prior to the low pH nLC-MS dimension to improve peak capacity in the first fractionation dimension.213–214 Offline fractionation has allowed for further optimizations, the use of MS-incompatible buffers, and the combination of separations that can’t be directly interfaced. Offline fractionation of peptides by SCX with UV detection allowed for optimization of sample loading for each subsequent nLC-MS run.215 Preparative electrophoretic methods that were first applied at the protein level, have also been used for fractionating peptides such as free-flow electrophoresis216 and IPG strips in a traditional217 and OGE setup.134,218 Many new fractionation methodologies have the benefit of identifying PTMs in a less biased manner than specific enrichment methods and may facilitate global co-identification and co-analysis of multiple relevant biological PTMs. In combination with Lys-N protease digestion, SCX fractionation has become possible to identify multiple PTMs simultaneously from complex mixtures including acetylated N-terminal peptides; singly phosphorylated peptides containing a single basic (Lys) residue; peptides containing a single basic (Lys) residue; and peptides containing more than one basic residue.219 The use of zwitterionic (ZIC)-HILIC for prefractionation of peptides at median pH was found as a complementary alternative to SCX and at low pH, also a method to fractionate peptides into classes of PTMs with the more common proteases trypsin and Lys-C.220 Continued work with ZIC-HILIC resins is improving sensitivity while maintaining comprehensiveness of analysis, identifying 20,000 peptides and 3,500 proteins from 1.5 μg of HeLa cell lysate.221 ERLIC fractionation of peptides identified more proteins and peptides, particularly of basic and hydrophobic character, than SCX222–223 and this strategy facilitated simultaneous analysis of phosphorylation and glycosylation from rat kidney.224 Inverting RPLC and ERLIC separation order has allowed for assessment of the extent of asparagine deamidation on peptides.225 A similar separation mode, hydrophilic SAX, was also found to be highly orthogonal to RPLC.226 Further combination of fractionation separations in three dimensional configurations has continued to improve comprehensiveness and sensitivity.227–230 The use of an online three-dimensional separation of peptides has allowed the identification of proteins present at approximately 50 copies per cell from analysis of the entire yeast proteome.231 This sensitivity gain from an added dimension of fractionation correlated to an estimated detection limit of 65 amol. Further improvements to prefractionation and enrichment of post-translationally modified peptides will undoubtedly improve identification comprehensiveness and lead to new biological discoveries.
2.6 Mass spectrometers and peptide MS analysis
In recent years, peptide analysis has driven the technological advances of new mass spectrometers and techniques. In particular, multiple hybrid instruments have been developed with different mass analyzers, ion optics, and fragmentation sources. These combinations have improved the accuracy of peptide precursor and fragment ion mass measurements and created more informative and complementary peptide fragment ions through various fragmentation methods. Common mass analyzers that have proven useful for peptide analysis from complex mixtures are the LIT, Orbitrap, FT-ICR, quadrupole (Q), and ToF. Table 2 describes their commonly-achieved analytical metrics for proteomics. Since each analyzer isolates and measures peptides masses using different mechanisms, each mass spectrometer represents a balance between sensitivity, speed, and accuracy. Most current mass spectrometers used for proteomics employ a LIT, which allows for both isolation and fragmentation of peptide ions. Data-dependent acquisition allows for primarily unbiased sampling and identification of peptides within a sample, and is performed as follows. Peptide ions are trapped within the LIT and subsequently scanned by increasing the radiofrequency voltage applied to the trap. An initial precursor scan is performed to identify abundant peptide precursor ion m/z’s. Sequential trapping and isolation of each individual abundant precursor ion is done by filling the trap and ejecting all but a population of ions within a mass window (~3 m/z) containing the peptide precursor m/z. The isolated ions are translationally excited prior to collisions. The collisions lead to conversion of translational energy to internal (vibrational) energy and then fragmentation. Fragment ions are scanned out to the mass analyzer and the process is repeated until abundant peptide precursor ions have been sampled. Often, a signal-to-noise threshold or maximum number of fragmentation scans is used to define how frequently the precursor ion and fragmentation scans are performed.232 Benefits in sensitivity have been achieved through sampling lower abundance ions through data-independent acquisition of consecutive small (10–25 m/z) windows.233–236 The modification of the initial 3-D QIT to a 2-D LIT improved sampling speed 2-fold,237–238 and a dual-pressure 2-D LIT configuration further improved sampling speed and sensitivity.239 Interfacing the 2-D LIT to FT-ICR240 and, more recently, to the Orbitrap241 improved the accuracy of peptide precursor measurements and the confidence in both identification and quantification of proteins and post-translational modifications. FT-ICR instruments still have the highest mass accuracy, but the Orbitrap is faster, more sensitive, and improving in resolution, particularly with its recent reduction in size.242 The use of identified peptides,243–247 external lock mass standards,248 background ions,249–251 and fragment ions252 for online253 and offline254 mass calibration has further improved mass accuracy over the course of proteomic runs where drift can otherwise occur. Other routine and emerging options for performing data-dependent acquisition of peptides using hybrid instruments are the Q-ToF255–257 and Q-Orbitrap.258–259 Schematic diagrams of the common mass spectrometers used for shotgun proteomics are illustrated in Figure 2 and Figure 3. Representative MS data is shown in Figure 10a. Application of ion mobility configurations at the inlet of mass spectrometers has reduced background noise and improved sensitivity,260–261 increased dynamic range,262–263 improved proteome coverage,264 and allowed for differential identification of isomeric peptides,265–266 phosphopeptides,267–268 and glycopeptides.269 The use of ion mobility is beneficial since it provides a gas-phase separation of peptides and chemical noise. Separation is achieved through the differential mobility of ions based on charge, size, and conformation as they are passed through a carrier buffer gas.
Table 2.
Mass analyzers used in shotgun proteomics and their commonly-achieved analytical metrics for peptide analysis.
| Analyzer | Instruments | Type | Resolution | Mass accuracy | Dynamic Range |
|---|---|---|---|---|---|
| Quadrupole | QQQ QToF |
Beam | 1 – 2 K | ~ 1 ‰a | 5 – 6 |
| Ion trap | LIT | Trapping (Electric field) | 1 – 2 K | ~ 1 ‰a | 3 – 4 |
| ToF | QToF | Beam | 10 – 50 K | 5 – 10 ppm | 4 |
| Orbitrap | FT | Trapping (Electric field) | 7.5 – 240 K | 500 ppb – 10 ppm | 4 |
| ICR | FT | Trapping (Magnetic and axial DC fields) | 100 – 500 K | ~100 ppb | 3 |
parts-per-thousand.
Figure 2.
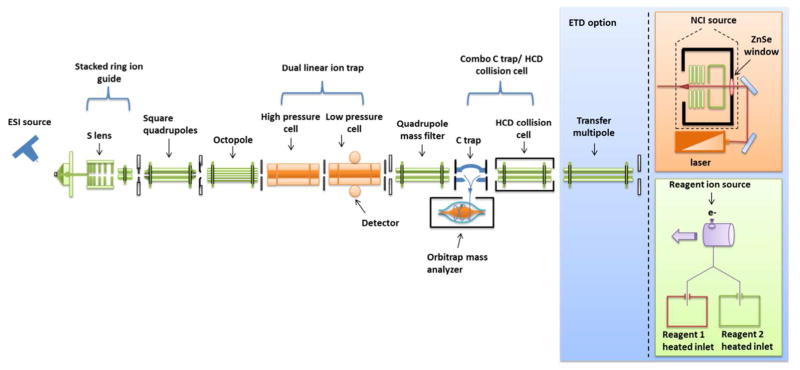
Diagrammatic summary of LIT- and Orbitrap-based mass spectrometers for proteomics. All but the IR fragmentation (orange box) is commercially available either as a single mass spectrometer or a combination of some essential components. Peptides are electrosprayed direclty from a LC separation into the heated inlet source where desolvated peptide ions are focused by a stacked ring ion guide (S-lens), then focused, filtered (typically 300–2000 m/z), and transferred by the square quadrupole and octapole to the dual LIT. Peptide ions are collected, isolated, and fragmented by CID in the high pressure cell. Isolated precursor and fragment ions are passed to the low pressure trap for detection. This sequence of events is currently considered a state-of-the-art LIT experiment primarily for protein identification and label-free protein quantification. For higher resolution and mass accuracy detection, precursor or fragment ions can be passed to the Orbitrap mass analyzer via the second quadrupole and C-trap. Beam-type collision can be performed in the HCD collision cell instead of the ion trap for detection with Orbitrap. The Orbitrap detects ion currents of peptide ions that process around an orbital electrode. A Fourier transform is used to convert the frequency-based ion current to a m/z value. Either of these fragmentation schemes with Orbitrap detection are considered state-of-the-art for high mass accuracy peptide analysis and are most often used for protein and post-translational modification identification and quantification with isotopic labeling. Alternative fragmentation methods of ETD, IRMPD, or the combination IR-ETD can be used in conjunction with either the LIT or Orbitrap mass analyzers. The simplest configuration most recently demonstrated is a Q-Orbitrap with HCD detection which consists of only the S-lens, quadrupole mass filter, C-trap, Orbitrap, and HCD collision cell. This configuration and experiment design is quite similar to the QToF illustrated in Figure 3.
Figure 3.
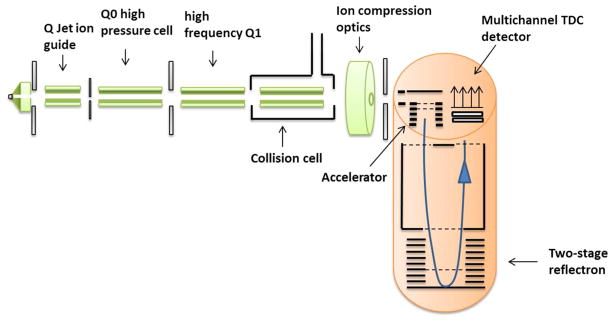
Schematic diagram of a QToF. The QToF allows for consecutive precursor mass filtering and fragmentation, an essential for shotgun proteomics which measures both intact and fragment ion masses of peptides. Essentially the instrument is a high mass accuracy QQQ frequently used in proteomics for targeted protein quantification experiments. Peptide ions from electrospray ionization are continuously focused by a Q jet ion guide, accelerated through quadrupole zero (Q0), Q1, and the collision cell for precursor peptide mass detection by time-of-flight and multichannel time-to-digital conversion (TDC) detector. Subsequently, abundant precursor ions can be selected by Q1 and fragmented in the collision cell prior to orthogonal acceleration for ToF detection.
Peptide fragmentation methods with different fundamental mechanisms have been implemented on mass spectrometers used for shotgun proteomics which provide complementary peptide fragment ions, proteome coverage, and quantification accuracy. The instrumental configurations for fragmentation are also indicated in Figure 2 and Figure 3. The common fragmentation mechanisms employed are illustrated in Figure 4. The most common and robust fragmentation method used for peptide analysis is CID/CAD (collision-induced/activated dissociation). A representative CID MS/MS spectrum is show in Figure 10b. LIT instruments use resonant-excitation, creating only single fragmentation events as the ions fall out of the excitation frequency upon fragmentation. The most prevalent ions formed are b- and y-type which result from fragmentation at the peptide bond, leaving the positive charge on either the N-terminal or C-terminal fragment, respectively. Beam-type collisional activation entails passing ions through a quadruple, fragmenting ions until they reach their minimum potential energy, creating mostly y-type ions. Resonant-excitation has been primarily used on LITs and beam-type collisional activation on triple quadrupole (QQQ) instruments. Recently beam-type fragmentation, deemed higher energy C-trap dissociation or higher energy CID (HCD),270 has also been demonstrated on LIT instruments with271 and without272 instrumental modifications and on hybrid instruments with dedicated collision cells.273 Beam-type collision yields sequence-informative low mass peptide fragment ions and it’s implementation on hybrid mass spectrometers has most dramatically improved peptide quantification using low mass isobaric tag reporter ions,274–275 further described in the “Quantification” section. Briefly, reporter ions are unique mass fragments ions from an amine-reactive, isotope-labeled chemical tag that can be used for relative quantification between protein samples. Prior to HCD, these low mass reporter ions were unreliably observed with CID and a pulsed Q dissociation (PQD) activation strategy improved reporter detection, but hampered protein identifications.276–277 CID of phosphopeptides often results in preferential loss of the phosphate moiety due to the low critical energy for this fragmentation process.278 Further collisional activation of peptide fragment ions279 after phosphate neutral loss in the same or a subsequent fragmentation scan creates more sequence-informative fragmentation ions.280–282 HCD fragmentation is an efficient alternative for phosphoproteomic studies,283 yet a comparative study illustrated that the greater acquisition speed of CID provided larger data sets.284 Like CID, electron capture dissociation (ECD)285 and electron transfer dissociation (ETD)286 induce random fragmentation along the peptide backbone, albeit from gas-phase reactions with either thermal electrons or fluoranthene, respectively, creating mostly c- and z-type ions as shown in Figure 4. The benefit of ECD was initially demonstrated for localization of labile γ-CO2 and SO3 modifications that were otherwise ejected prior to peptide backbone fragmentation by CID.287 Early bottom-up proteomics studies with ECD-FTICR-MS automated acquisition of fragmentation288 and found that larger peptides289 of higher charge state290 were more efficiently fragmented and identified than with CID. Sequential CID and ECD in a large-scale phosphoproteomics experiment illustrated CID is better for phosphopeptide identification, ECD is better for phosphorylation localization, and together they provide complementary information and high confidence for infrequently identified phosphopeptides.291 ECD with FTICR-MS presented great potential for bottom-up proteomics, but was not easily compatible with the commonly used LIT since the thermal electrons quickly lose their energy and cannot be trapped. The use of a focused electron beam has been proposed as a solution,292 but this problem otherwise spawned ETD, where a LIT-trappable anion is used as a one-electron donor to induce fragmentation by the same non-ergodic pathway as ECD.286 An optimization study using four reagents illustrated ETD fragmentation can be as fast or faster than CID depending on peptide charge state; azulene was the best reagent due to its higher reactivity, fewer inefficient proton-transfer reactions, and low fowling of ion optic elements from a higher vapor pressure.293 One of the notable advantages of ETD is the retention of phosphorylation moieties on fragment ions, a shortcoming of CID methods.294 Exploiting this characteristic of ETD, a comparison of phosphoproteomic results using CID and ETD295 indicated phosphate rearrangement during CID fragmentation was much less prevalent than anticipated from a targeted study of a small number of synthesized phosphopeptides.296 On the downside, the efficiency of ETD is charge-state dependent, thus diminishing its success for peptides in low charge states. When coupled with Lys-N for proteolytic digestion, ETD fragmentation has been used to generate straightforward peptide sequence ladders,297 which is useful in de novo sequencing as discussed in the “Bioinformatics” section. Integration of ETD with Orbitrap mass spectrometers298–299 and application to large scale proteomics studies has demonstrated complementary identifications of peptides, proteins, and proteomes to CID fragmentation. ETD with supplementary CID fragmentation (ETcaD) of doubly protonated peptide precursor radicals, [M+2H]2+•, was developed to minimize non-dissociative electron transfer (ETnoD) processes.300 This concept was also reported concurrently along with the charge-reduction of larger peptides with ETD prior to CID (CRCID) for identification of post-translational modifications.301 From these characterizations, a decision tree-driven approach was demonstrated to select the appropriate fragmentation method based on peptide charge state and m/z and improve proteome coverage302, and has since been implemented with other fragmentation methods with further improvements.303–305 Exploiting the anion fragmentation capabilities of ETD facilitated identification of the previously under-sampled acidic proteome.306 The combination of ETD with infrared (IR)-activated ions outperformed both ETD and CID for higher peptide charge states.307 The key improvements were reduction of the ETnoD process with preactivation and the creation of primarily odd electron z•-type and even electron c-type product ions. Implementation of IR fragmentation alone308 has also shown improved reporter-based relative quantification of peptides.309 Ultimately, these improvements to fragmentation and identification of larger peptides may make a dramatic contribution to middle-down proteomics methodologies.
Figure 4.

Common peptide fragmentation methods. Peptides are cleaved along the peptide backbone to sequence the peptide. CID/CAD entails acceleration of the kinetic energy of ions to promote energetic collisions with a target gas, thus causing conversion of the ion’s kinetic energy to internal energy and ultimately resulting in ion fragmentation. Most fragmentation pathways rely on proton transfer. For trapping instruments that employ resonant excitation, the waveform used to accelerate a precursor ion is specific for a particular m/z value, thus only the selected precursor ion is activated. The resulting fragment ions are not excited and thus do not dissociate further, allowing detection of an array of predominantly both b and y ions (as well as others). In contrast to resonant excitation in trapping instruments, in beam-type CID both the selected precursor ions and any resulting fragment ions are passed through a collision region which enables further activation and dissociation of the fragment ions. This means that the less stable b ions will frequently decompose to very small ions. Thus, both peptide precursors and their fragment ions are activated and mostly y-type fragment ions persist. Unlike CID, ECD and ETD fragmentation relies on the gas phase reaction of the peptide ions with a thermal electron or an ETD reagent, respectively. The electron transfer-driven fragmentation mechanisms create mostly c- and z-type ions.
3 PTM analysis by mass spectrometry
The eukaryotic proteome is much more diverse than the corresponding genome due to two stages of regulations: post-transcription and post-translation. Post-transcriptional regulation generates multiple mRNA splicing patterns, which are subsequently translated into different proteins. The proteins can be further post-translationally modified by covalently adding some chemical units or changing the structures of the amino acids themself. Therefore, the mapping of PTMs is an important dimension to help describe the whole proteome.
PTMs play key roles in almost all biological processes. Hundreds of PTMs have been found to occur on different amino acids. The typical approach of detecting PTMs using mass spectrometry requires enrichment techniques, due to relatively low PTM levels. PTMs are measured by mass shifts caused by the modification (Table 3). The modified residue site can be further interpreted by its site-specific fragments. In this review, we will focus on the most biologically relevant PTMs, including phosphorylation, ubiquitination and glycosylation.
Table 3.
Common post-translational modifications detected by mass spectrometry.
| PTM | Residues | Chemical group | Δ mass (Da)a |
|---|---|---|---|
| Phosphorylation | Ser, Thr, Tyr | HPO3 | 79.9663 |
| N-Glycosylation | Asn | Glycan | ≥ 132.0432b (−0.9840 and 2.9890)c |
| O-Glycosylation | Ser, Thr | Glycan | ≥132.0432bc |
| Oxidation | Met | O | 15.9949 |
| Methylation | N- C- terminus, Lys, Ser, Thr, Asn, Gln, (Iso)Aspd | CH2 | 14.0156 |
| Dimethylation | Arg, Lys | CH2CH2 | 28.0313 |
| Trimethylation | Arg, Lys | CH2CH2CH2 | 42.0470 |
| S-Nitrosylation | Cys | NO | 28.9902 |
| Citrullination | Arg | O | 0.9840 |
| Ubiquitination | Lys | Ubiquitin | ≥ 8564.8448 (114.0429)e |
| Acetylation | N terminus, Lys, Ser | CH3 CO | 42.0106 |
| Carbamylation | N-terminus, Lys, Arg | CONH2 | 43.0058 |
| Biotinylation (amide bond to) | N-terminus, Lys | Biotin | 226.0776 |
Δ mass (Da) is the change in mass of the peptide and amino acid in Daltons due to the addition of a PTM.
Mono- and polyglycosylation result in variable Δ masses. The lowest mass increase from monoglycosylation by pentose is 132.0432. The remaining monoglycosylation masses are 146.0579 (deoxyhexose), 162.0528 (hexose), 203.0794 (N-acetylhexosamine), 291.0954 (N-acetyl-neuraminic acid), and 307.0903 (N-glycolyl-neuraminic acid). Polyglycosylation creates combinatorial addition of these masses.
The presence and localization of an N-linked glycan can be determined by treatment with PNGase and observation of a 0.9840 Da mass loss. The use of heavy H218O during the PNGase treatment produces a more easily detectable mass increase of 2.9890 that can be differentiated from the mass loss associated with Asn deamidation (−0.9840 Da).
IsoAsp is racemized aspartic acid.
Ubiquitinylation or polyubiquitinylation of a single lysine residue results in Δ masses equal to or greater than 8564.8448 Da, respectively. From tryptic digestion, the majority of the ubiquitin molecule is cleaved from the lysine residue, leaving a signature Gly-Gly dipeptide on the lysine side chain that has a detectable mass shift of 114.0429 Da.
3.1 Phosphorylation
Addition of a phosphate group to a protein can influence many properties of the protein, including protein folding, activity, interaction with other proteins, and localization or degradation; thus, phosphorylation plays essential roles in regulation of nearly all biological phenomena, including proliferation, differentiation, apoptosis, and cellular communication.310,311 Defects in regulation of reversible phosphorylation controlled by protein kinases/phosphatases can be the cause of various diseases, including cancer, diabetes, chronic inflammatory diseases, and neurodegenerative diseases.
In order to understand signaling networks in normal and pathogenic mechanisms in various diseases, development of an analytical method for identification of phosphorylated proteins and phosphorylation sites is essential. Phosphorylation is often a sub-stoichiometric process; at a given time point, not all copies of a given protein are present in a phosphorylated state. Therefore, highly sensitive methods for isolation, detection, and quantification of low abundant phosphorylation sites are required. In the past, phosphorylation analysis for identification and localization of the modified amino acid was conducted primarily by radiolabeling312 with 32P combined with capillary electrophoresis, amino acid analysis, or Edman radiosequencing.313 Recently, with vast and ongoing improvements in sample preparation, separation, enrichment, instrumentation, and data analysis, the field of phosphoproteomics has shown substantial expansion, which has resulted in more extensive and confident identification and quantification of phosphorylation sites. In fact, use of proteomic approaches that employ MS can lead to identification and quantification of thousands of phosphorylation sites from a single sample in the femtomole or even attomole range.314,315,316 Current methods for study of phosphorylation using LC-MS/MS are reviewed below and illustrated in Figure 5.
Figure 5.

Overview of phosphoproteomic methods
3.1.1 Enrichment of phosphopeptides
Immobilized Metal Ion Affinity Chromatography (IMAC) with metal ions including Fe(III), Ga(III), Al(III), and Zr(III), has been widely used for enrichment of phosphopeptides.317,318–319 A number of factors, including binding, washing, and elution affect the efficiency of the IMAC procedure.320 In order to eliminate the binding of non-phosphopeptides in IMAC, acidic conditions for loading and washing have been used; phosphopeptides can be then eluted using alkaline conditions.321 Esterification of peptide carboxyl groups resulted in improved specificity of phosphopeptide enrichment322 using IMAC and a method using Zr or Ti, which prevents binding of acidic peptides, has been developed.323
An alternative to IMAC enrichment of phosphopeptides uses TiO2, which has shown a higher capacity and better selectivity for phosphorylated peptides.324 TiO2 precolumns, TiO2-based HPLC chips, TiO2 tips, 324, 325 and other metal oxide enrichment methods using ZrO2326 or Ga2O3,327 have been used for purification of phosphopeptides. To improve binding selectivity of phosphopeptides on TiO2, competitive binders, such as 2,5-dihydroxybenzoic acid (DHB) and phthalic acid,325,328 were used in the buffers during enrichment. To increase recovery of phosphopeptides, multiple rounds of consecutive incubation using fewer TiO2 beads than the optimum ratio have been suggested.329 In addition, various methods for elution of trapped phosphopeptides, such as ammonium bicarbonate with 50mM ammonium phosphate (pH 10.5), ammonia solution (pH 10.5–11), or step gradients from pH 8.5 (100mM triethylammonium bicarbonate) to pH 11.5 (3% ammonium hydroxide) have been used.330,331 A method combining IMAC and TiO2 (called SIMAC)332 for simultaneous detection of mono-phosphorylated and multi-phosphorylated peptides has been introduced. Mono-phosphorylated peptides are eluted by acidic buffers from IMAC and multi-phosphorylated peptides by basic elution, resulting in increased sensitivity of detection and reduced sample complexity. Recently, polymer-based metal ion affinity capture (PolyMAC) using polyamidoamine dendrimers multifunctionalized with titanium ions and aldehyde groups has been introduced, showing high selectivity, fast chelation times, and high phosphopeptide recovery compared with current strategies based on solid phase nanoparticles.333
Fractionation of protein samples is still required even if methods employing IMAC and TiO2 are used for enrichment of phosphopeptides. Several chromatographic methods, including SCX,315 SAX,334 HILIC,335 and ERLIC336 have been used in an effort to increase the efficient identification of phosphorylation sites by prefractionation. The combination of SCX fractionation and TiO2 enrichment is a popular method. Tryptic peptides at pH 2.7 usually carry a net charge of +2 (N-terminal amino group and C-terminal arginine or lysine side chain); however, the presence of a phosphate group decreases the net charge state by one. Using SCX fractionation at pH 2.7, phosphopeptides can be separated from non-phosphorylated peptides337 and analysis of these fractions using LC-MS/MS resulted in identification of more than 2,000 phosphopeptides from the nuclear fraction of HeLa cell.315 An acidic, then highly acidic double SCX fractionation strategy separated and selected for basic phosphopeptides.338 pI-difference also allows separation of methylated phosphopeptides from the methylated nonphosphopeptides by in-solution isoelectric focusing 339 and this concept was also applied for IPG strips pH 3–10 as used in the first dimension of 2-DE.340 When HILIC, is used, non-phosphorylated peptides are eluted in the early fractions followed by elution of peptides with single and multiple phosphorylated sites. The presence of the phosphate group increases the peptide’s hydrophilicity, and thus retention time.341 Exploiting a different separation mechanism with SAX, acidic phosphorylated phosphopeptides can be depleted for increased identification of basophilic kinase substrates.342
An excess of Ca2+ can be used for precipitation of phosphopeptides.343–344 Calcium phosphorylation precipitation method for identification of phosphoproteome was combined with a subsequent IMAC method in rice embryonic cells, resulting in identification of 242 phosphopeptides representing 125 phosphoproteins.345 Ba2+ was also used for precipitation of phosphopeptides and this method combined with MudPIT identified 1,037 phosphopeptides from 250 ug of HeLa cells nuclear extract.344 Furthermore, coverage of the phosphoproteome was extended with three Ba2+ ions concentrations. Immunoprecipitation based on anti-phosphotyrosine antibodies can be also used for enrichment of phosphotyrosine proteins/peptides.346,347 In general, antibodies for phosphoserine and phosphothreonine are less specific than anti-phosphotyrosine antibodies and are not frequently used for enrichment. In addition, the recently repurposed hydroxyapatite (HAP) chromatography resin efficiently enriched phosphopeptides based on the higher affinity of multi-phosphorylated peptides towards HAP surfaces.348 HAP has allowed for efficient analysis of mass-limited complex samples with single-step microcolumn enrichment coupled to MudPIT.349
3.1.2 MS analysis of phosphopeptides
Due to the electronegativity of the phosphoryl group, as well as the labile nature of the phosphoester bond, phosphopeptides are less efficiently ionized and fragmented in comparison to unmodified peptides. Therefore, MS analysis of phosphopeptides is more difficult than it is for non-phosphorylated peptides. Results of MS/MS obtained from phosphopeptide analysis under general CID conditions demonstrated loss of labile metaphosphoric acid or phosphoric acid.350 To improve phosphopeptide identification, selection and analysis of ions with neutral loss can be performed with additional CID for generation of an MS3 spectrum.351 In addition, treatment with phosphatase can increase confidence in phosphopeptide identification and localization of phosphorylation sites through parallel MS/MS analyses of two samples before and after treatment with phosphatase.352–353
Alternatively, use of electron capture dissociation (ECD)354 and electron transfer dissociation (ETD)286 can induce backbone fragmentation for generation of c- and z-type ions which retain an intact form of PTM such as a phosphorylation group. ETD is compatible with LTQ-Orbitrap, ion trap, and LTQ-FT-ICR mass spectrometers, and is suitable for LC-MS/MS analysis of complex phosphopeptide mixtures.355 Because the two fragmentation modes are complementary, combination of CID and ETD/ECD for enhancement of the number of identified phosphopeptides has been suggested.356
3.1.3 Identification of phosphorylation sites
For identification of phosphorylation sites in phosphopeptides, the identification of the amino acid sequence and mapping of phosphorylation sites must be determined accurately by hand or analysis software. In particular, if a phosphopeptide contains consecutive amino acids of serine, threonine, or tyrosine, precise MS/MS spectra generated by cleavage both N-terminal and C-terminal of the identified phosphorylation site are required. Various algorithms, such as SEQUEST and Mascot, can be used for identification of phosphorylation sites; however, validation of the assigned phosphorylation sites should be performed manually. Ambiguity in site assignment can occur because fragment ions don’t adequately define the site or a peptide that is phosphorylated at different sites within the same sequence could co-elute and co-fragment providing evidence for both sites within the spectrum. Various software programs, such as Debunker 357 and Ascore, 337 have been developed to assist in evaluation and validation of phosphopeptides and phosphorylation site assignments, respectively. In addition, more specialized database resources, such as Phospho.ELM,358 PHOSIDA,359 Scansite,360 KinasePhos,361 and PPSP362 can also provide tools for prediction and annotation which aid in identification of potential kinases associated with phosphorylation sites.
3.2 Ubiquitination
Ubiquitin is a highly conserved 76 amino acid small protein, which exists in all eukaryotic cells. Ubiquitination is reversible, ATP-dependent, and catalyzed by a ubiquitin E1 (activating) - E2 (conjugating) - E3 (ligating) cascade,363–365 resulting in a covalent isopeptide bonds between a glycine residue at the carboxy-terminal of ubiquitin and the ε-side chain of a lysine residue within a substrate protein. Ubiquitination can produce either monoubiquitinated or polyubiquitinated proteins. The latter is formed when one of the seven lysine residues of ubiquitin is linked to the C-terminal glycine of another ubiquitin. The way the ubiquitin molecules are linked plays an important role in the function of the resulting modified protein.366–367 The most well documented function of ubquitination is its role in mediating protein degradation. Moreover, ubiquitin and many other ubiquitin-like proteins (UBLs) are involved in various biological processes, including but not limited to cell meiosis, autophagy, DNA repair, immune response and apoptosis.368–370
The traditional ubiquintination assay, which is normally based on affinity interaction, is incapable of detecting individual ubiquitinated proteins and sites in a high throughput mode. Current mass spectrometry-based proteomic technologies have greatly improved detection and characterization of ubiquitination due to their high sensitivity and mass accuracy. Like many other PTMs detected by MS, ubiquitination is characterized by a signature mass shift. The carboxy-terminal of a ubiquitin has an amino-acid sequence of –R72 L73 R74 G75 G76, which is normally cleaved after the R74 residue during typsin digestion. The carboxy end (G76) of ubiquitin is covalently attached to a lysine on the substrate and leads to a missed cleavage on the substrate during typsin digest. As a result, the signature ubiquitinated peptide contains additional G75-G76 residues from ubiquitin, which results in a mass shift of 114.043 Da (G-G) as well as a missed K cleavage at the ubiquitination site.
Detection of ubiquitination by mass spectrometry may generate false positives, which should be carefully examined. Although the mass shift of 114.043 Da can be measured precisely and accurately in mass spec analysis, there are other events which cause a mass increase of 114 Da, (some with exactly the same chemical elemental composition as diglycine), making them indistinguishable from ubiquitination. For instance, the residue asparagine (Asn) has a monoisotopic mass of 114.043. When a peptide contains a K-N motif, a missed cleavage between these two residues will result in a ubiquitination-like spectrum, and the database search engine may not be able to distinguish between di-glycine and asparagine. Another potential issue comes from the iodoacetamide (IAM) used in cysteine (Cys) alkylation prior to protein digestion. Carbamidomethylation leads to a mass increase of 57.021 Da on Cys and sometimes lysine.371 Further, it has also been reported that IAM can introduce a di-acetamidoacetamide covalent adduct to lysine, resulting in the identical chemical composition as diglycine. The identical masses introduce artifacts into the database search algorithms, resulting in false positive ubiquitination site.372 To avoid artifacts, an alternative alkylating reagent372 or adjusted incubation temperature373 can be used to reduce over-alkylation. False ubiquitination identification can also be caused by the isotopologue peaks of several amino acids with mass close to 114 Da. For instance, leucine and isoleucine both have a monoisotopic mass of 113.084 Da and their m+1 heavy isotopic mass is 114 Da. If the 114 isotope containing peak is considered as the peptide precursor, it may result in a false ubiquitination identification. In this case, a high mass accuracy threshold and either manual or software validation of the monoisotopic mass can be employed to ensure correct assignment.
An enrichment or purification step is normally required prior to mass spectrometry analysis in order to get deeper ubiquitination coverage, since its overall abundance is low in biological samples. Several affinity approaches are widely used to enrich for ubiquitinated proteins. Ubiquitin-substrate conjugates can be purified by either anti-ubiquitin antibodies374 or His-tagged ubiquitin.375 High sensitivity and specificity of antibodies are critical for the success of an antibody approach. The His-tagged ubiquitin method is thought to be of higher specificity, because the procedure can be done under protein denaturing conditions. However, a His-tagged approach becomes challenging for some biological samples, such as animal tissues and clinical samples. Because ubiquitination occurs at different sites and at different levels among individual molecules, using an antibody to pull down whole proteins may generate a significant number of unmodified peptides after protein digestion. Recently, a new antibody has been designed to address this issue targeting the di-glycine motif after protein digestion by trypsin.376 Polyubiquitinated proteins can also be enriched by Ub binding domains (UBDs), which have high affinity for poly Ub chains.377
There are many other UBLs which covalently conjugate to protein substrates and generate diverse modifications. These modifications can be determined by detection of a UBL remnant-containing peptides after trypsin digestion, but there are some challenges. First of all, the mature form of some ubiquitin-like modifiers (e.g. RUB1, NEDD8 and ISG15) have the same C-terminal amino acid sequence as ubiquitin (-RGG), which results in an indistinguishable di-glycine signature adduct. To determine the different modifiers, a pre-fractionation step such as immunoaffinity purification or epitope tagged Ub or UBLs can be used.378–379 However, many other UBLs (SUMO, URM, and HUB1) result in a relatively long amino acid sequence remnant after trypsin cleavage. Such branched peptides generate much more complicated MS/MS spectra after CID fragmentation, and interpretation is difficult. To address this limitation, C-terminal SUMO mutants with different protease digestion specificities have been employed, enabling a rapid and efficient identification of SUMO sites.380 The potential of this mutation approach is that it can be easily adapted to determining the sites of conjugation for other UBL proteins (not only SUMO) from a diverse range of organisms.
Mass spectrometry can also be used to determine the linkage sites in polyubiquitin chains. Ubiquitin has seven lysine residues, each of which can be linked to the C-terminal glycine of another ubiquitin, forming polyubiquitin. The biological consequence of polyubiquitin can be highly dependent on which lysine is modified by another ubiquitin molecule. For instance, K48-linkage primarily targets proteins for proteasomal degradation, whereas K63-linkage appears to play a role in DNA repair, subcellular localization, and protein-protein interactions. Antibodies against these linkage structures have been developed.367 Alternatively, the tryptic ubiquitin peptides derived from different linkage types have unique structures and masses, and therefore can be determined by mass spectrometry.381–382
3.3 Glycosylation
Glycosylation is thought to be one of the most common protein PTMs. A protein is glycosylated by a covalent link of the glycan to either an amide or alcohol in the protein. An N-linked glycan is attached to the amide group of asparagine residue in an amino acid sequence motif of Asn-X-Ser/Thr, where X represents any amino acid other than proline.383 An O-linked glycosylation links the glycan to the hydroxyl group of serine or threonine. Many studies have revealed that glycosylation, especially on membrane, secreted, and body fluid proteins, greatly influences many biological functions, including protein folding, protein turnover, and immunity.
Glycan analysis, or glycomics, has traditionally aimed to define only the glycan modification in a glycoprotein. In contrast, glycoproteomics refers to the full characterization of glyco-proteins and glyco-peptides. Glycomics studies screen for glycan structures, but lose the information on localization sites and from what proteins they are derived. This information is lost because analysis of glycans normally requires the release of glycan moieties from the glycosylated proteins. N-linked glycosylation is generally cleaved by an amidase, such as peptide N-glycosidase F (PNGase F), which releases broad spectrum sugars. However, such a universal enzyme is not available for O-linked glycans because they are very heterogeneous, and have many forms of linkage core structures. Therefore O-glycosylation is typically cleaved by chemical methods, such as hydrazinolysis384 and alkaline β-elimination.385 The released glycan can be subsequently analyzed by different methods. Typically, the glycan, either derivatized or underivatized, is determined by mass spectrometry or nuclear magnetic resonance (NMR).
Glycosylated peptides and proteins are typically present in low abundance in complex biological samples, and an enrichment step is normally performed in order to improve sensitivity of glycosylation detection. For this purpose, a number of enrichment approaches have been developed, including lectin affinity,386–387 hydrazide coupling,388 HILIC,389–390 and boronic acid affinity.391–392 Among these strategies, lectin-affinity is the most widely used due to its high specificity. Lectins are carbohydrate binding proteins, which can specifically attach to sugar moieties. There are a number of well characterized lectins that may be used for enrichment. For instance, Concanavalin A (ConA) binds to mannose glycan whereas wheat germ agglutinin (WGA) preferentially recognizes N-acetylglucosamine. Ulex europaeus agglutinin (UEA) and aleuria aurantia lectin (AAL) are specific fucose binding lectins. N-acetylneuraminic acid can be enriched by maackia amurensis leukoagglutinin (MAL) and hemoagglutinin (MAH). Combinations of multiple lectin forms have been used to achieve higher glycosylation coverage. Another frequently used enrichment method uses hydrazide chemistry, in which the carbohydrate is oxidized to a di-aldehyde, which is then covalently coupled to hydrazide bead.
The obvious drawback of glycan analysis is the loss of the information about which protein and residue site glycosylation occurs. Mass spectrometry-based glycoproteomic strategies are able to address this issue, and tend to be high throughput and accurate methods in this application. There are two different ways to analyze glycosylated peptides using mass spectrometry. The first, like most other PTM detection methods using MS, is to measure the intact glyco-peptides with glycan; the amino acid sequence and glycosylation site can be determined by the spectrum interpretation. Obviously, this method is ideal, since both the glycan and peptides are measured simultaneously. However, in practice this method has had limited success on large scale analysis, due to the fact that glycan heterogeneity makes spectral interpretation difficult for glycosylated peptides, and the sugar group makes peptide fragmentation challenging. In addition to conventional CID method for peptide fragmentation, some new ion dissociation methods, such as infrared multiphoton dissociation (IRMPD),393 electon-capture dissociation (ECD)394 and electron-transfer disassociation (ETD),395 have been introduced to generate more fragment ions derived from peptide backbone with no loss of the glycan moiety. A full characterization of both glycopeptide and glycan can be accomplished by using two complementary dissociation strategies. First, CID fragmentation usually cleaves the glycopeptide at glycosidic bonds, providing information predominantly on the glycan structures. Next, ETD fragmentation can be applied, which generates more peptide backbone fragments for peptide sequence identification. The other strategy is to remove the glycan first by reacting with amidase. Deglycosylated peptides are then subjected to a typical shotgun proteomics analysis. In contrast, this method only identifies which peptides were glycosylated. For this strategy, PNGase F cleaves N-linked glycans from glycoproteins, deaminating asparagine to aspartic acid, resulting in a 1 Da mass increase. If this deamination happens in an 18O water environment, the heavy oxygen leads to an additional mass shift of 2 Da. As a result, a 3 Da mass increase on asparagine can be used for glycosylation site determination.396 As the N-linked glycosylation contains the motif sequence of Asn-X-Ser/Thr, a targeted database which only comprises motif containing sequences can increase the sensitivity of glycopeptide identification and reduce the false discovery rate.397
3.4 Other PTMs
3.4.1 Acetylation
Acetylation is a modification that mainly occurs on protein N-terminal or lysine residue. The N-terminal acetylation is a co-translational modification, and the later one is a post-translational modification. The N-terminal residue of a nascent protein, resulting from genetic initiation codon of ‘AUG’, is often methionine, which can be acetylated. Frequently, the N-terminal methionine is also be removed by methionine amino peptidases, thereafter the remaining N-terminal residue is revealed and acetylated by N-a-acetyl transferases (NATs). N-terminal acetylation is a very common modification in eukaryotes, and up to 80% of human proteins have been reported to be acetylated. 398–399 The second type of acetylation is introduced as an acetyl group to the 3-amino group of lysine residues. The lysine acetylation is a reversible process which is catalyzed by acetyl- transferases and deacetylases, respectively.
Acetylation tightly regulates diverse protein functions. The earliest and most well-known study of acetylation was focused on histones, which demonstrated a significant correlation between histone acetylation and gene expression. 400 Thereafter many other biological significances have been discovered to be related to acetylation, which include apoptosis,401 cellular metabolism,402 protein stability,398 and neurodegenerative disorders,403 among others. Moreover, it has been implied greatly that acetylation is cooperative with many other important PTMs, such as phosphorylation, methylation, ubiquitination, sumoylation.404
The traditional detection of acetylation involves radioactive labeling and acetyl-lysine antibody. Both techniques are able to measure the presence of acetylation, but incapable of localizing the acetylation site. With MS, the acetylation sites can be captured by its signature mass shift (42 Da), and the modified site can be interpreted from MS/MS as well. MS-based proteomics has largely extended acetylation from histone to non-histone targets. Choudhary et al. 405 has identified 3,600 lysine acetylation sites on 1,750 protein, implying a global occurrence of lysine acetylation. Lundby et al. 406 further enlarged the acetylation scale to 15,474 modification sites on 4,541 proteins from 16 rat tissues, and discovered that the sequence motifs for lysine acetylation varied between different cellular components.
Similarly to ubiquitination, the acetylation on lysine residues normally results in a missed cleavage site after trypsin digestion, which should be considered carefully in protein database search. Acetylation should be also distinguished from trimethylation cautiously, as both modification lead to quite closed mass shifts (42.0106 vs. 42.0469 Da). High mass accuracy data enables us to address this issue. Compared to lysine acetylation, N-terminal acetylation has not been investigated globally, mainly due to its high diversity, and the lack of specific enrichment method. Furthermore, the mature proteins are usually N-terminally processed, and the initial methionine residue can be removed. Therefore consideration of non-tryptic peptides would be essential to finding N-terminal peptides in a database search.
3.4.2 Methylation
Protein methylation is another common modification, in which a methyltransferases catalyze the addition of methyl groups to carbon, nitrogen, sulfur, and oxygen atoms of several amino acids, of which the arginine and lysine methylations are most widely studied. Similarly to histone acetylation, histone methylation is another most important PTM which plays a crucial role in regulation of chromatin structure and transcription.407 Methylation occurs to varied extents, which result in mono-, di-, and tri-methylations. Therefore, the proteomic database search should take all the possibilities into consideration.
With mass spectrometry, Ong et al. employed a modified SILAC method, in which the 13CD4-methionine was metabolically converted to 13CD4 -S-adenosyl methionine, and the later one was then served as the solo methyl donor. The obvious advantage of this method is its increased confidence of methylation identification because the heavy methylated peptide and its light counterpart peptide have a signature mass difference.408 In Saccharomyces cerevisiae, 83 lysine and arginine methylation sites and their specific motifs were identified.409 In another study, Vermeulen et al. identified the specific protein binders to trimethyl-lysine modifications on histones.410 A less frequently studied methylation on isoaspartyl residues was recently found on p53 using mass spectrometry and was correlated to p53 degradation.411
3.4.3 Cysteine redox modification
The proteins can be modified through redox reactions, and proteomic studies focusing on these modifications are termed as redox proteomics. Redox proteomics has been recently comprehensively reviewed, 412–413 therefore this review will only briefly cover this field. Among all amino acids, the most oxidation susceptible residue is cysteine as it contains active thiol. The thiol of cysteine can be oxidized to a variety of forms, including disulfide bond between two cysteine molecules from either different proteins or within the same protein, protein sulphenic acid (PSOH), sulphinic acid (PSO2H), sulphonic acid (PSO3H), S-glutathionylation, and S-nitrosylation.
Like many other PTM analyses, the low abundance of cysteine modifications makes the detection challenging for complex samples. In addition, some of the redox modifications are quite labile, therefore are not directly compatible with sample preparation and MS analysis. Some cysteine modifications caused by small thiol molecules, such as glutathione and cysteine, are more readily to be detected, which have mass shifts of 305 Da and 119 Da compared to their unmodified counterparts, respectively. These mass signatures can be measured and the modification site can be localized as well in MS analysis. However, for disulfide bond linked peptides, the detection can be more complicated. The first method is to measure disulfide bond linked peptides by successive usages of two different alkylating reagents with different molecular mass. For instant, iodoacetamide can be used to initially block the free thiols, which lead to a mass shift of 57 Da. Subsequently the disulfide bonds are reduced, and the newly opened thiols are further alkylated with N-ethylmaleimide, which results in a mass increase of 125 Da. The different mass shifts can be used to determine which cysteine residues were previously free or blocked. The limits of this method are that it is not able to distinguish between different disulfide types, and there is no ways to know which two cysteine residues are linked. Alternatively, the disulfide bond linked peptides can be analyzed directly by MS. In this case, more effort is required for data interpretation as the fragment ions are derived from multiple peptides, which can be either inter-protein or intra-protein.
Protein S-nitrosylation is a labile reversible modification, in which the thiols of cysteine react with nitric oxide, forming the S-nitrosothiol. The S-nitrosylation has been reported to regulate several diseases, including neurodegenerative diseases,414 diabetes,415 cancer,416 and cardiovascular diseases.417 Because of the labile nature of the S-nitrosylation, the direct analysis of it with MS is normally less successful. Alternatively, a biotin switch strategy 418 was introduced to measure the nitrosothiols indirectly. In a biotin switch experiment, the free thiols of cysteine residues are first specifically blocked by methyl methanethiosulfonate (MMTS). Next the S-nitrosothiols are reduced by ascorbate, forming thiol, which reacts with a sulfhydryl-specific biotinylating reagent, N-[6-(biotinamido)hexyl]-3′-(2′-pyridyldithio) propionamide (biotin-HPDP). The S-biotinylated proteins or peptide can be further enriched, and subjected to shotgun proteomic analysis. Similarly to biotin method, enrichment of S-nitrosothiols (SNOs), using resin-assisted capture (SNO-RAC) was introduced, 419 providing a more efficient solution.
4 Quantitative proteomics
With advances in sample preparation, protein/peptide fractionation, sensitivity and accuracy in modern mass spectrometry, the proteome map of a certain organisms can now be routinely obtained in reasonable depth using shotgun methods.176–178,420 Two recent studies have been able to characterize more than 10,000 proteins in samples from cultured cell lines.421–422 Although proteomics was largely aimed at qualitative analysis early on (i.e. generating a protein list from a given organism), it has become apparent that the protein list itself is insufficient for addressing many biological questions. Abundance changes of proteins are principally a reflection of biological processes or disease states. Altered protein levels can be clues for possible drug targets and also potential clinical biomarkers for disease diagnosis, even at an early clinical phase. As a result, new methods for quantitative measurements on both protein expression and PTMs have been developed and have become an integral part of current proteomic studies.
The classic proteomic platform, 2-DE, was the first tool used for proteome quantification. Quantification is performed by comparing the staining densities of proteins on two or more gels, providing a measure of relative quantification. However, 2-DE has its limitations. First of all, the 2-DE gel has a limited resolution for large number of proteins which comprise the whole proteome. The co-appearance of protein spots makes accurate quantification impossible. The incompatibility of 2-DE with hydrophobic proteins means it cannot be easily used for membrane proteins. Additionally, 2-DE is incapable of analyzing low abundant proteins in a high dynamic range sample such as plasma, whose dynamic range of protein expression can vary by up to 12 orders of magnitude.423 2-DE–based quantification detects only extreme differences and inaccurately estimates quantity changes. Furthermore, 2-DE is a labor and time consuming strategy that allows only individual gel spots to be identified one at a time.
Given the limitations of 2-DE-based methods for quantification, several strategies have emerged to quantify the proteome based on the mass spectrometry data. The current MS-based quantitative approaches are shown in Figure 6. Since 2-DE quantification has largely been replaced by MS-based methods, the following discussion will cover only the LC-MS-based quantitative strategies. MS-based quantitative data are obtained by either stable isotope labeling or label-free approaches. The label-free strategy measures samples individually, comparing the MS ion intensity of peptides424–428 or using the number of acquired spectra175,429–430 matching a peptide/protein as an indicator for their respective amounts in a given sample. The isotope labeling approach allows the mixing of multiple samples at different experimental stages. The absolute or relative protein abundance can be obtained by measuring the intensities of different isotope coded peaks which are distinguished by mass spectrometry (Table 4). Multiplexing quantification not only makes comparison more straightforward, but also reduces valuable instrument time. There are two methods that are used to derive quantitative information from mass spectrometry data: one is to calculate peptide precursor ion abundance in the MS1 scan; alternatively, the isotope coded reporter ions (which reflect peptide quantity) can be detached from the peptide by fragmentation and measured in the MS2 scan.
Figure 6.
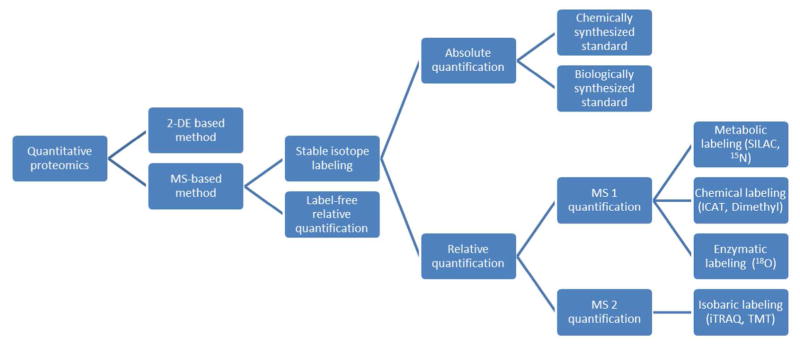
Categorization of the main strategies for quantitative proteomics.
Table 4.
Isotope labeling quantitative strategies
| Methods | Labeling residues | Multiplexing | MS1/MS2 | Mass shift or reporter ionmasses |
|---|---|---|---|---|
| ICAT | Cys | 2 | MS1 | +8 Da in heavy |
| ICPL | Lys | 2 | MS1 | +6 Da in heavy |
| Dimethyl | N-terminus, Lys | 3 | MS1 | +4 Da in medium |
| +8 Da in heavy | ||||
| 18O | C-terminus | 2 | MS1 | +2,+4 Da in heavy |
| SILAC | Lys, Arg | 3 | MS1 | +4,+6,+8,+10 Da in heavy |
| SILAM | All AAs | 2 | MS1 | Typically >10 Daa |
| iTRAQ | N-terminus, Lys | 8 | MS2 | 113–119, 121 Da for 8-plex |
| TMT | N-terminus, Lys | 6 | MS2 | 126–127 Da for 2-plex |
| 126–131 Da for 6-plex |
The mass shift is determined by the number of 15N and/or 13C atoms in the amino acid and peptide.
4.1 Relative quantification
4.1.1 MS1-based quantification by isotope labeling
4.1.1.1 Chemical reaction labeling
Initial MS-based quantification methods relied on chemical labeling to add isotope-coded reagents to reactive groups on the side chains of amino acids or to the peptide termini. The first chemical labeling methods used for mass spectrometry-based quantification made use of the reaction between the thiol side chain of cysteine and isotope-coded tags in a method called ICAT (isotope-coded affinity tag).431–432 The ICAT reagent consists of three different elements: a biotin affinity tag, a thiol specific reactive group, and a linker which contains either light or heavy isotopes. In an ICAT experiment, cysteine residues are selectively derivatized with an ICAT reagent containing either eight 1H or eight 2H atoms, and the protein mixture is then subjected to avidin affinity chromatography to purify ICAT coded proteins. Thereafter, proteins are digested with trypsin and the peptide mixture is analyzed by LC-MS. Because cysteine is not found in every peptide, the ICAT technique can significantly reduce the complexity of the peptide mixture, thus simplifying analysis of complex samples. On the other hand, ICAT obviously eliminates all non–cysteine-containing peptides and therefore is not suitable for comprehensive large-scale quantification. Furthermore, the deuterium tag results in a retention time shift between light and heavy peptides in reversed-phase chromatography, which complicates subsequent data analysis.433 The second generation of ICAT has been modified to include a 13C-labeled linker instead of deuterium.434–436 A similar isotope-coded protein label (ICPL) 437 method uses either six light 12C or heavy 13C in isotope tags attached to free amino groups in proteins.
Another chemical labeling strategy using formaldehyde to introduce dimethyl labels, has been used to label the N-terminus and amino group of Lys residues (Figure 7a).438–439 In this method, the light form of formaldehyde is reacted with cyanoborohydride to introduce double chemical groups of CH3 to each primary amine in a peptide (Figure 7a). The medium and heavy labeled reagents generate two sets of CHD2 and 13CD3, respectively. As a result, 4 Da of mass difference can be detected between three groups by mass spectrometry (Figure 8a–c). Although dimethyl labeling has been shown as an easy, efficient and inexpensive approach, there are still some restrictions. Like in the original ICAT method, there is a chromatographic retention time shift caused by deuterium labeling. Additionally, in the case where the mass difference is only 4 Da, observed in 3-plex labeling (Figure 7a), the small mass difference may lead to isotopic peak overlapping between two peptides (Figure 8b), especially for larger peptides.
Figure 7.

Labeling reactions of triplex stable isotope dimethyl labels and duplex TMT labels. Both labeling methods target the N-terminus and Lys of peptides with a reactive isotopic group. a: Dimethyl labeling introduces different mass increases via different isotopic reagents. b: TMT labeling introduces equal mass increases via different reagents. The reporter ions with different masses are released during peptide fragmentation. Asterisk indicates a 13C atom replacement.
Figure 8.

Two quantitative strategies based on chemical reaction. The representative peptide is doubly charged, and consisting of 15 molecules of averagine, a hypothetical amino acid. Averagine has a molecular formula of C4.9384 H7.7583 N1.3577 O1.4773 S0.0417, which is derived from statistical occurrence of amino acids in the protein identification resource protein database. a, b, c: Dimethyl labeling. The quantification is calculated based on the ion intensities in MS1. The MS2 is only used to identify the peptide sequence (c). This given peptide has slight isotopic peak overlap between the three groups (b), the overlapped areas will become more significant for longer peptides. d, e, f, g: 6-plex TMT labeling. The quantification is calculated based on the report ion intensities in MS2 (g). The MS2 is used for both peptide sequence identification (f) and quantification (g). The mixed peptide groups have the same m/z in MS1 (e).
4.1.1.2 18O labeling
18O-labeling is an MS1-based stable isotope labeling method in which the isotope is introduced during enzymatic reaction.440–442 In this method, the C-terminal carboxyl group of proteolytic peptide is labeled with two atoms of 18O by amide bond cleavage and oxygen exchange in the presence of 18O water. The labeled and unlabeled peptides are distinguished by a 4 Da mass difference in mass spectrometry. 18O-labeling is an easy and inexpensive isotope labeling method. However, 18O-labeling is less widely used than other quantitative methods for a number of reasons. The variable incorporation of 18O atoms into peptides443–445 is the primary limitation of the method. As oxygen exchange is not always complete, one labeled peptide may contain both singly labeled and doubly labeled subgroups. Together with unlabeled peptides, there will be a total of three groups of peptides with only a 2 Da mass shift separating them, leading to complicated data analysis. A modified 18O-labeling approach decoupled from protein digestion has been developed which increases the efficiency of producing doubly labeled peptides.446 However, even with all peptides doubly labeled, a mass difference of 4 Da is still relatively small, especially for large peptides with broad isotope peak distributions. Quantitative algorithms for 18O-labeled data must be mindful of isotopic peak overlapping and variable labeling efficiencies in these samples.445,447
4.1.1.3 Metabolic labeling
Metabolic labeling of proteins for quantification employs a stable isotope-enriched medium or diet to culture or feed living systems. The isotopic atoms are incorporated into the whole proteome through protein synthesis during protein turnover and cell multiplication. The labeled peptides have a mass increase that can be detected by a mass spectrometer. When labeled and unlabeled samples are combined prior to introduction into the mass spectrometer, the ratio of peak intensities in the mass spectrum reflects the relative abundances of the peptides. Metabolic labeling is considered to have higher quantitative accuracy than other labeling methods, since it allows samples to be mixed at the protein level prior to any sample preparation, avoiding the introduction of sample handling errors and systematic variance. However, unlike chemical or enzymatic isotope labeling, metabolic labeling cannot be applied universally to all samples. Stable isotope metabolic labeling first was introduced by Langen et al. in 1998, who used an 15N- and 13C-labeling approach to compare protein quantities with 2-DE.448 Other research groups soon reported the successful use of 15N metabolic labeling in both yeast449 and a mammalian cell line.450 Nitrogen, rather than carbon, is typically chosen as the isotopic marker because the isotopic nitrogen reagent is easier to obtain. Moreover, there are on average four times as many carbon atoms in a protein as nitrogen atoms. As a result, a 13C-labeled peptide usually results in a broad distribution of the peptide isotopic peak, making data analysis more challenging. 15N-labeling technology has been applied successfully to cells in culture,450–451 plants,452–455 Drosophila melanogaster,456 Caenorhabditis elegans,456–457 and mammals.458–460 15N labeling of mammal is referred to as “stable isotope labeling of amino acids in mammals” (SILAM).52,461 Another metabolic labeling method, known as “stable isotope labeling with amino acids in cell culture” (SILAC), was introduced in 2002.462 The major difference between SILAM and SILAC is that SILAM results in the labeling of one atom in all amino acids, whereas SILAC labeling is limited to select amino acids (usually Lys and/or Arg). In a typical SILAC experiment, cells are differentially labeled by growing them in light medium with normal Arg or Lys (e.g. Arg-0 or Lys-0) or labeled medium with heavy Arg or Lys (e.g. Arg-6 or Lys-6). The subsequent trypsin digest cleaves the proteins at arginine and lysine residues. Therefore, every tryptic peptide except for the C-terminal contains one labeled amino acid, which makes the mass increase of the labeled peptide predictable. Originally, SILAC was used only for cell culture. However, the SILAC approach also has been recently applied to mouse labeling 463 by feeding the mice a 13C6-lysine–labeled diet for four generations, and Drosophila melanogaster464 by feeding with labeled yeast.
The two main forms of metabolic labeling, SILAM and SILAC, each have strengths and shortcomings. SILAC and SILAM display different isotope patterns for labeled peptides in mass spectra (Figure 9). Since only one (or limited) labeled amino acid can be incorporated in any given tryptic SILAC peptide, the mass difference between the unlabeled and labeled peptide can be predicted, which facilitates data analysis. By contrast, the mass increase of a 15N labeled peptide depends on its chemical composition as well as on the labeling incorporation rate. This variable mass gain usually makes subsequent data analysis more challenging. However, the variable mass shift caused by the 15N atom number can also be a potential benefit for larger peptides. Thus the fixed mass difference derived from SILAC, e.g. 6 Da, may not be large enough for complete separation of the isotope patterns of each peptide (Figure 9).
Figure 9.
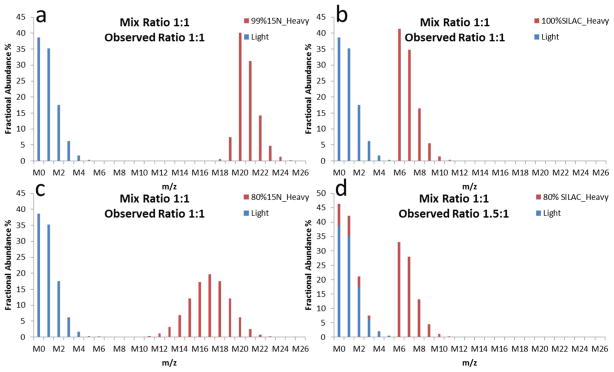
Comparison of 15N and SILAC quantifications. The peptide presented here consists of 15 molecules of hypothetical amino acid, averagine. Averagine has a molecular formula of C4.9384 H7.7583 N1.3577 O1.4773 S0.0417, which is derived from statistical occurrence of amino acids in the protein identification resource protein database. Each spectrum represents a 1:1 mixture of unlabeled and labeled peptides. (a), (b): The mass spectra observed when the labeling efficiency is or nearly complete for 15N and SILAC quantifications. 15N labeling typically generates bigger mass increase compared to SILAC labeling. (c), (d): The mass spectra observed when the labeling efficiency is 80% for 15N and SILAC quantifications. 15N is still able to result in an accurate quantitative ratio, whereby the SILAC labeling leads to a false ratio. SILAC quantitative labeling is not compatible with partial labeling because the observed unlabeled peaks do not exclusively originate from unlabeled sample.
The requirement for labeling efficiency varies between 15N-SILAM and SILAC. Generally, complete or nearly complete labeling is necessary for a straightforward data processing and reliable quantification. However, the relative isotope abundance (RIA) ordinarily does not reach absolute 100% in either 15N or SILAC, especially in mammal labeling, because of residual unlabeled atoms in the nutritional source and metabolic amino acid recycling. SILAC peptides appear only in two forms in the MS: labeled and unlabeled. If a protein is only partially labeled, the MS of unlabeled peptide is a mixture composed of two parts, the original unlabeled peptide and the partially labeled peptide (Figure 9d). To avoid this, the labeling incorporation rate of SILAC should be close to 100%. By contrast, as the incorporation rate increases in the SILAM method, the labeled MS peaks of 15N peptide gradually moves towards higher mass. A relatively low labeling incorporation rate is sufficient to separate the labeled and unlabeled MS peak envelopes of 15N peptides (Figure 9c). Consequently, a high labeling efficiency for the 15N quantitative strategy is not as stringently required as for SILAC (Figure 9c and d), which reduces the cost and time required for labeling. Complete labeling is easily achieved for actively dividing cells in cell-based experiments because the medium that contains the labeled amino acids can serve as the whole nutritional source for protein synthesis. Moreover, the metabolic rate of cultured cells is normally very high. Mammals such as mouse and rat are not easily fully labeled because of the relatively slow turnover of both proteins and its precursor in the amino acid pool. A labeling approach starting in utero has been used to achieve successful labeling.52,461
Although there is no clear biological bias caused by incorporation of heavy isotopes, a label swapping strategy is recommended to avoid such a risk, and other systematic technical bias. In a label swapping experiment, the isotope types for two samples are switched in two replicates.465 Thus any potential effects caused by incomplete SILAC labeling efficiency, protein contaminations, or isotope itself can be removed. An ideal correlation between two swapping replicates should result in two ratios (e.g. Light/Heavy) which are reciprocal to each other.
Although metabolic labeling may provide the best quantification precision and accuracy, it is still used infrequently in proteomic studies, especially those involving animals. One reason for its limited use is the high cost due to the difficulties in manufacturing isotope enriched reagents and the requirement of large quantities of reagents to label animals. Also, not every organism is amendable to metabolic labeling, particularly human samples, although heavy leucine infusion has been used to track human surfactant protein in newborn infants. 466 An indirect ‘spike-in’ strategy was introduced to address these issues.459 Briefly, labeled proteins are used as an internal standard, which is simultaneously mixed with every sample to be compared. The final quantification between samples can be derived from the individual ratios between each sample and the uniform standard. The benefits of using ‘spike-in’ are obvious. First, although the heavy stable isotopes or isotope enriched protein sources are thought to be a safe replacement for light ones, there may be some unknown biological effects caused by changed isotopes or diets. A labeled internal standard is able to eliminate such potential effects. Secondly, once an organism is labeled, it can be used for many diverse experiments. A labeled mouse can provide researchers with organs (brain, heart, liver etc.) with adequate protein content for many studies and so the cost per experiment for metabolic labeling is not as high as it might appear. For organisms not suitable for metabolic labeling, a labeled internal standard which shares the same genome background and has a considerable proteome overlap with the target sample, can be used for quantification.467–468 Liao et al. used 15N labeled rat brain as ‘spike-in’ to quantify the proteome and phosphoproteome in cultured primary neurons.467 The ‘spike-in’ method allows comparison of unlimited number of samples in parallel but has some inherent restrictions. The overlapping proteins, especially in ‘tissue/cell’ experiments, represent a reduced portion of the whole proteome since the samples originate from different cell types. Because a ratio of ratios (ratio/ratio) is used for quantification, only the proteins found in every experiment can be used to draw the final quantitative map. Furthermore, the statistical deviations in a ‘spike-in’ experiment are typically higher than those in a direct comparison.
4.1.2 MS2-based quantification by isotope labeling
Isobaric tags for relative and absolute quantification (iTRAQ®) 469 and tandem mass tags (TMT®),470 consist of several functional elements: a unique mass reporter, a cleavable linker as a mass balancer, and an amine-reactive group (Figure 7b). All labeling subdivisions in a set of multiplex tags have the same total mass weight (Figure 7b). Importantly, these labeling elements facilitate co-elution of peptides during LC and co-isolation for fragmentation during MS/MS. Peptide mixtures representing different biological samples are labeled with different forms of the tag by reacting the amine- reactive group of the tag with the peptide N-termini and lysine residues of the peptide. During peptide fragmentation in the mass spectrometer the linker is fragmented, releasing the mass reporter, where the intensity represents the relative abundance of the original peptide (Figure 8d–g). There are several features of isobaric labeling which have led to its widespread use in proteomics. For instance, an isobaric labeling strategy is capable of analyzing multiple labeled pools of peptides, up to 6-plex for TMT471 and 8-plex472 for iTRAQ, in a single analysis, reducing analytical time significantly. In contrast, all other isotope labeling approaches are limited to 2 or 3 isotope comparisons. Another benefit of using an isobaric label is that it does not increase the complexity of the MS1 scan (Figure 8e) and does not decrease the precursor signal sensitivity (as in SILAC and SILAM), since all the tags lead to the same mass increase for each labeled peptide. However, isobaric reagents are undetectable in conventional CID in ion trap instruments because these low-mass reporters are ejected from the ion trap during activation.473 To circumvent this issue, a modified activation method, pulsed q dissociation (PQD)474 can be used which enables MS/MS reporter ions to be detected in an ion trap mass analyzer. Higher-energy collisional dissociation (HCD)273 has also been routinely used in iTRAQ and TMT analysis.275,475 HCD provides better MS2 data quality, because all the MS2 data are acquired with high mass accuracy, but it requires more ions and time to generate a MS2 spectrum compared with that from normal CID. As a result, the HCD-based quantification normally leads to lower proteome coverage. Although isobaric labeling has been shown to be a powerful tool for quantitative proteomics, it suffers from a lack of quantification accuracy,476–477 which is largely influenced by co-fragmentation of co-eluting peptides with similar m/z. When the MS selects a peptide precursor for subsequent fragmentation, it isolates the precursor in a wide m/z window, which may cover both target peptide and the co-eluting peptides. In this case, the reporter ions do not originate from a pure peptide population, but a mixture. Thus if the co-fragmented peptides do not have the same quantitative ratios, it will result in inaccurate quantifications. Recently, two independent studies have sought to overcome this limitation.478–479 Ting et al. 478 employed an additional stage of mass spectrometry to improve the ion selection specificity. In this case, the most intense MS2 fragment ion was selected for a further fragmentation, and the reporter ions released during the second fragmentation were used for quantification. To avoid selection of non-labeled fragments in MS2, the researchers used protease Lys-C, not trypsin, to digest the proteins. The resulting peptides all contained Lys and were labeled with isobaric tags at both termini. Thus all the fragment ions in MS2 were tagged and able to release reporter ions in the MS3 analysis. Wenger et al.479 reduced the charge of peptides by using proton-transfer ion-ion reactions, generating more purified precursors for further fragmentation. For instance, if a doubly charged peptide and a triply charged peptide have the same m/z, using the Wenger method both charges can be reduced by one, generating singly charged and doubly charged peptides respectively. These two newly charged peptides will now have different m/z, avoiding precursor interference. Both strategies show promise as good solutions for isobaric labeling, but an increase in the number of steps in the procedures may lead to fewer peptide measurements and identifications over the same period of analysis time.
Similarly, another potential weakness of the isobaric strategy, which has not been widely recognized, is the bias caused by using a single intensity measurement. In a shotgun proteomic experiment, a peptide is usually triggered for fragmentation only once (or limited times) due to the ‘dynamic exclusion’ function. Therefore the reporter ions used for quantification only reflect the peptide abundances at that given time. In contrast, MS1-based quantification normally measures the whole peptide elution profile, which reduces relative variability, especially for low abundance peptides.
4.1.3 Label free quantification
As has been described, use of a labeling method that employs stable isotopes allows for accurate quantification of protein expression. However, certain limitations, including additional sample processing steps, cost of labeling reagents, inefficient labeling, difficulty in analysis of low abundance peptides, and limitation of sample number, are associated with use of these labeling techniques. As an alternative, label-free methods can be used to avoid the drawbacks of labeling methods. Quantification of protein expression using a label-free methods can be achieved by two methods: 1) spectral counting uses the frequency of peptide identification of a particular protein as a measure of relative abundance and 2) ion intensity uses the mass spectrometric chromatographic signal intensity of peptide peaks belonging to a particular protein.480
In spectral counting175, 429, 430 the frequency of peptide spectral matches of a specific protein can be correlated with the amount of a protein. Use of the spectral counting method can be applied to low to moderate mass resolution (0.1–1 Da) LC-MS data. Spectral counting has shown a linear correlation and good reproducibility over a large dynamic range for determination of relative protein abundance.481,482 In addition, the spectral count approach makes use of simpler normalization and statistical analysis than does the ion intensity method. A protein abundance index (PAI), defined as the number of identified peptides divided by the number of theoretically observable peptides for each protein, is used in label-free quantification to calculate the abundance of a protein.483 This has been further converted to exponentially modified PAI (emPAI), which has greater proportionality to the protein abundance in a sample.484 The emPAI calculation can be used for database search platforms such as SEQUEST and Mascot. One of the drawbacks of spectral counting is the inherency of peptides with different physicochemical properties to produce bias in MS result. To improve this disadvantage, a modified spectral counting method, called the absolute protein expression (APEX) was introduced for measurement of protein concentration per cell, based on the number of observed peptides for a protein and the probability of detection of peptides by MS.485 APEX is a useful tool for large-scale analysis of proteomic data, as shown by estimation of cellular protein concentrations of human pathogen Leptospira interrogans.486
The intensity based approach for quantitative label free MS involves integration of all chromatographic peak areas of a given protein; the area under the curve (AUC) directly correlates with the concentration of peptides in the range of 10 fmol – 100 pmol.424,425 Thus, the process for quantification of proteins based on AUC by measurement of ion abundance at specific retention times for given ionized peptides, called the ion count, is useful for quantification within the given detection limits of the instrument.487 Although the basic idea behind this method is rather straightforward, various factors to ensure reproducibility and accuracy must be taken into account. Factors that need be taken into consideration include co-eluting peptides, particularly when peptide signals are spread over a large retention time, multiple signals for the same peptide due to technical or biological variation in retention time, mass spectrometer speed and sensitivity, and background noise due to chemical interference. Computational methods that consider mass accuracy and alignment of retention times of peptides across various sets, background noise, and peak abundance normalization have been used to address these issues.488 Finding the balance between MS and MS/MS frequency for quantification of proteins using AUC methods, while at the same time maximizing protein identifications, is imperative. With the advent of high mass accuracy mass spectrometers, this can be accomplished by performing multiple analyses of the sample separately in MS and MS/MS modes,427 matching accurate mass and retention times for identification of peptides, and integrating the ion intensities of corresponding peptides to calculate the protein concentration.489 A combination of both spectral counting- and ion intensity-based label-free quantification further improved accuracy. 490
As described in the “Mass spectrometers and peptide MS analysis” section, data-dependent analysis (DDA), where the mass spectrometer scans parent ions and selects the most abundant ions for fragmentation, is used for processing of most MS analysis. Using this method, low abundance peptides are often omitted, resulting in a low dynamic range of detection. Data-independent analysis (DIA) acquires data based on the sequential isolation and fragmentation of specific precursor windows. Using this method, signal to noise ratio showed 3–5 fold improvement, and peptides unidentified by DDA methods were detected.233 Use of an advanced method, called XDIA, with increased spectra and peptide identification using ETD and CID, was reported to improve confidence in quantification statistics and protein coverage.491 Recently, a DIA method called SWATH was developed for quantitative and qualitative detection of all proteins and peptides in a single analysis using fast, high resolution Q-ToF.236
Despite the fact that there are always new developments in software programs and technical aspects of analytical instruments, high quality results that are both sensitive and specific can be generated only if the software is compatible with the specified instrument. Therefore, one of the obvious challenges for quantitative proteomics is choosing the most appropriate analysis software, considering file compatibility, user friendliness, computational requirements, data visualization, and automation. Some software tools for label-free quantification have been described below. SIEVE, developed by ThermoFisher Scientific, makes use of the base peak chromatogram to extract data and align peptide signals across LC-MS runs with statistical validation for determination of changes in peptide abundance. Other software including QuanLynx (Waters), Elucidator (Rosetta Biosoftware), and Expressionist (Genedata) are also commercially available.492 ProteinQuant detects the first occurrence of a peptide MS/MS scan and notes its corresponding retention time in the master file.493 Within the retention time window associated with the precursor MS/MS scan time, it generates a base peak chromatogram for precursor m/z and selects the maximum intensity ions. IDEAL-Q is another automated tool for use in label free quantification.494 This tool accepts raw data in mzXML format and peptide and protein identifications from search engines such as SEQUEST,495 Mascot,496 or X!Tandem.497 IDEAL-Q uses a fragmental regression algorithm to find unidentified peptides in a specific LC-MS/MS run through a predicted retention time from the same identified peptide in other runs. The predicted elution time is used to detect the precursor ion isotope cluster of the assigned peptide for quantification after noise filtering. SuperHirn498 and PEPPeR499 software make use of MS/MS scan in addition to retention time and m/z, which significantly improves alignment accuracy, but is still limited to high resolution data. SuperHirn uses an alternative alignment strategy and intensity correlation to detect outliers with significantly lower similarity values between LC-MS runs; therefore, low quality runs for the alignment process are excluded.492,498 Census, which is compatible with label and label-free analyses, reads the spectral file and constructs the chromatogram for each peptide generating a XML file, which is further loaded into a Census graphic user interface application. Results are exported after consideration of various peptide parameters, including regression ratio, regression score, determinant factor, data points, and outlier peptides.500 A new developed software called IdentiQuantXL was compared with various software packages, including SIEVE, Msight, PEPPeR, ProteinQuant, and IDEAL-Q, based on key features, such as elution patterns, global or individual alignment, pattern- or identity-based, and multiple filters using various different samples, i.e., standard peptides, kidney tissue lysates, HT29-MTX cell lysates, and serum.501 Recently, Skyline, open source software tool for quantitative data processing from targeted proteomics experiments performed using SRM,502 expanded its capabilities to process label-free quantification of proteomics data using Skyline MS1 filtering.503 This software provides key features including visual inspection of peak picking and both automated and manual integration, and can be used with mass spectrometers from major companies.
Methods for label-free quantification in high throughput shotgun proteomics have come a long way in recent years. Each method has advantages and disadvantages and it is difficult to say that one method is more accurate than the others. With the advent of a large number of fast, accurate, and sensitive instruments and software program for validation, label-free quantification is becoming a popular alternative to the use of labeling methods.
4.2 Absolute quantification
The relative quantification methods described above are currently the standard methods used in the quantitative proteomics field, providing valuable information about altered protein expression. However, absolute quantification is still a much sought after goal in proteomics, as it allows us to have a more precise and comparable definition of the proteins and their PTMs within a biological system, which could include detailed information on cellular organization, protein quantities and dynamics, and protein stoichiometries within complexes, among other biological phenomena.
The basic principle of current absolute quantification methods is to introduce stable isotope labeled standards whose abundances are predefined. This method is equivalent to ‘isotope dilution analysis’, which was initially used in small molecule determination.504 As discussed previously, metabolically labeled proteins can also be ‘spiked-in’ to serve as internal standards in proteomics experiments. For relative quantification, metabolically labeled standards usually contain the whole proteome, but protein abundance for individual proteins is unknown. The ‘spike-in’ methods used for absolute quantification employ standards with limited number of peptides and known concentration. Labeled standards can be generated in three ways: chemically synthesized stable isotope labeled peptides (AQUA),505 biologically synthesized artificial quantification concatemer (QconCAT) peptides506 and intact isotope labeled protein standard absolute quantification (PSAQ) or absolute SILAC.507–509
The AQUA method relies on the relative comparison between an internal isotope-labeled standard peptide and unlabeled sample digest, in which a chemically identical peptide is expected. The labeled peptide can be mixed with the sample during protein digestion or right before the LC-MS analysis. Analysis of paired peptides in selective mode (SRM or MRM)510 enables the MS to monitor both the intact peptide mass and one or more specific fragment/transition ions of that peptide. In combination with the retention time, the AQUA platform can eliminate ambiguities in peptide assignments and extend the quantification dynamic range. The preferred instrument for SRM/MRM analysis is the triple quadrupole mass spectrometer, since the three space tandem quadrupole analyzers can provide the best performance in precursor selection, fragmentation, and transition ion scan. In addition, the AQUA method is suitable for PTM determination.505,511–512 A synthesized peptide with modified residue and heavy isotope label is used as the internal standard. An unmodified heavy peptide standard can also be added to extract quantitative information on both the total protein and modified protein levels. A disadvantage of AQUA is that this method is not fully compatible with protein fractionation. A target protein subjected to sample fractionation normally has incomplete recovery, leading to an increased error in the quantification.513 The selection of the optimal peptide standard and the amount of the standard to be added to the sample are very important criteria for the AQUA method. A survey run is always recommended to determine which peptides are well ionized and fragmented and if there are any interfering ions. The selected peptides are typically fully tryptic, without missed cleavage, and not excessively long. Moreover, peptides with reactive amino acids and peptides shared by more than one protein are avoided. Unlike the other relatively global quantitative approaches, AQUA does not measure protein quantity in a high throughput manner but determines one or a few target peptides of interest.
QconCAT is an AQUA-like strategy which enables absolute quantification on a larger scale. Briefly, an artificial protein formed from concatenation of tryptic peptides can be produced by either in vivo or in vitro methods from a single artificial gene, and then purified by its His6x-tag. The QconCAT polypeptide is mixed with the biological samples prior to proteolysis. After trypsin digestion, all released peptides can act as internal standards for multiple proteins. QconCAT can now include roughly 50 peptide standards,514 which may correspond to 20–30 proteins. Similar to AQUA, a well-designed QconCAT construct is necessary for the final success of quantification. The design of QconCAT involves many aspects, which have been reviewed by Brownridge el al.514 The major advantage of QconCAT is its ability to monitor several proteins simultaneously, which is very useful in protein complex and pathway studies. However, like AQUA, QconCAT is not compatible with protein fractionation, because the spiked-in standard is an artificial protein different than any of the target proteins.
The PSAQ method possesses some features of both AQUA and QconCAT.507 Like AQUA, a PSAQ standard targets one protein. However, PSAQ employs an intact stable isotope labeled protein (which can be expressed in vivo or in vitro) rather than one peptide for use as the internal standard, therefore it provides multiple peptide standards for a given protein, with higher sequence coverage and better statistical reliability. Another strength of PSAQ is that the standard and sample can be mixed at the beginning stage of the sample preparation, making it compatible with prefractionation and resulting in enhanced sensitivity and the release of peptides during proteolysis will mimic the rate of release for the target protein.
Both QconCAT and PSAQ can provide higher quantitative efficiency than AQUA, as the former two allow quantifying multiple peptides by spiking in one standard. For QconCAT and PSAQ strategies, an accurate measurement of the standard quantity is important for subsequent quantification of peptides. Cysteine or amino acid analysis have been used for this purpose,506–507 where the protein is first hydrolyzed and then quantified by comparison with amino acid standards. A drawback of QconCAT and PSAQ is they are not easily used to measure modified peptides, whereas AQUA is more adaptable to synthesis of peptides with specific modifications.
Besides the isotope labeled standard methods discussed above, there is another type of absolute quantification which is less used, but potentially useful. This strategy employs synthetic unlabeled peptides which may be labeled with isotope reagent, such as iTRAQ54 or 18O water.515 The synthesized peptide and the endogenous peptide sample, including its counterpart, are labeled with different isotopes by chemical or enzymatic reactions. The advantage of this method is the use of unlabeled synthetized peptides and readily available isotopic labeling reagents.
Absolute quantification has shown promise in targeted proteomics. However, currently it can only be carried out on a limited number of target proteins and peptides, mainly due to the need for a synthetic internal peptide standard. Moreover, the degree to which the measured quantity accurately reflects the real sample quantity, especially after the time-consuming sample preparation procedures and physical/chemical treatment of the sample, is still under debate. The reliability of the quantification can be greatly affected by protein degradation and the completeness of protein digestion. Therefore it is possible that the absolute protein concentration derived from these strategies does not accurately reflect the real protein level in the biological samples. Measurement of larger peptides with middle-down proteomics or of intact proteins with top-down may help to alleviate these challenges.
4.3 Multiple comparisons
From ground-breaking development and automation of instrumentation, analytical methodologies, and bioinformatics pipelines, the most common proteomics experiment has quickly shifted from methodological to biological. Global quantitative biological comparisons are now possible, particularly with increasingly parallelized isotopic peptide labeling strategies,516 which has increased the need for appropriate statistical consideration of protein expression changes with multiple testing correction.517 The comparisons made with proteomics are similar to genomics and transcriptomics studies,518 so many of the same principles are beginning to be used in data analysis. These include the ANOVA t-test519–520 and multiple test corrections of Bonferroni,521 Benjamini-Hochberg,522 Storey-Tibshirani.523, and Bayes.524 Application and description of these tests in a proteomic context have been demonstrated on label-free spectral counting data525–527 and metabolic-labeling data.270,524 These comparison allow for extraction of statistically-significant changed proteins for biological validation. Further development and application of these methodologies to shotgun proteomic data sets will be essential to finding interesting biological changes.
5 Bioinformatics
Bioinformatics is an essential aspect of shotgun proteomics, especially with the production of increasingly complex data sets from increasingly comprehensive MS-based proteomic analyses. A schematic of a common shotgun proteomics bioinformatics pipeline is illustrated in Figure 10b. The integration of bioinformatic tools into proteomics pipelines and bundled software packages has begun to help standardize and simplify proteomic analysis for transfer of complicated, powerful methodologies from the experts to the users. Examples of these are the Integrated Proteomics Pipeline (IP2, http://integratedproteomics.com/), pFind Studio (http://pfind.ict.ac.cn/),528 ProteoIQ (http://www.bioinquire.com/), ProteomeDiscoverer (www.thermoscientific.com), Scaffold (http://www.proteomesoftware.com/), MaxQuant (http://maxquant.org/),529 and Transproteomics Pipeline (http://tools.proteomecenter.org).530
Shotgun proteomics has developed into an automated pipeline of powerful analytical techniques. The automation has the advantage of wide-spread use – and unfortunately also misuse. A systematic study by the Human Proteome Organization (HUPO) of multiple proteomics labs revealed dramatic variability in results for a 20 protein test sample.531 This highlighted the need for standardization of proteomic methodologies, which has followed,532 and appropriate operator training, understanding, and usage of database search methods. As complex proteomes are commonly analyzed with shotgun proteomics, more complex standards are being developed and characterized for evaluation of system performance.533–536 Other recent efforts for addressing this issue include development of quality control software to monitor key proteomic metrics both during and after LC-MS runs and bioinformatics analysis.537–539 Proper use540 and comparison of proteomic algorithms and their performance541 has also been highlighted.
5.1 Automated computational peptide identification methods
After analytical methodologies were worked out for the identification of peptides with tandem mass spectrometry,542 one of the main limitations was manual interpretation of fragmentation spectra. Interpretation generally required an expert hand and, even then, was time consuming. For a LC-MS/MS run of a complex protein/peptide mixture, manual interpretation of all spectra was unrealistic. Thus, the crux of and one of the most influential contributions to the field of mass spectrometry-based proteomics was automation of identification of candidate peptide sequences from MS/MS spectra with software. An excellent conceptual review on this topic provides an overview of the different methodologies for matching peptide spectra to peptide sequences.543 The first software developed for this purpose, SEQUEST, leveraged two timely technological developments, sequencing of genomes and computer software algorithms to match MS/MS peptide spectra to peptide sequences, and is still routinely used today.495 Manually interpreting peptide MS/MS spectra is done by finding mechanistically-expected amino acid-specific fragment ions or mass intervals to build confidence in a sequence. The SEQUEST algorithm uses a similar strategy by simultaneously comparing all experimental fragment ions to theoretically generated fragment ions at the spectrum level. The SEQUEST software makes two key calculations which define whether a peptide sequence is a confident match for a fragmentation spectrum: XCorr and ΔCN. XCorr is a statistical calculation of the correlation of the theoretical and experimental spectra. ΔCN, the difference between the top peptide spectrum match (PSM) and the second best PSM, is then calculated. Initially, ΔCN was used as the best measure of whether a PSM was correct,543 but subsequent filtering methods and software have been introduced to statistically assess the confidence of a large set of identified PSMs. The theoretical peptide spectra are generated using a database of proteins, from as complex as the entire translated genome to as simple as a list of high confidence, validated translated protein candidates. For a tryptic digestion, only theoretical tryptic peptides of the appropriate length (typically 6 – 50 amino acids long) are considered as potential PSMs. Mascot is another commonly used search engine which instead relies on the probabilistic matching of fragment ions.496 The Mascot search methodology originated from MALDI- and ESI-MS experiments on individually digested proteins where peptide mass fingerprints are used as the unique identifier of proteins. A probability score is calculated to determine how likely a calculated peptide mass fingerprint spectra matches an experimental one by chance. A similar probability scoring strategy of phosphorylation site informative fragment ions has proven useful for the confident localization of phosphorylation sites in global phosphoproteomics data.337 Mascot has since been modified and expanded to calculate probability scores for peptide MS/MS data for complex mixtures and to include decoy matches within database searches.544–545 X!Tandem followed SEQUEST and Mascot, combining three important attributes from each through the calculation of an expectation value.546–547 The expectation value is a probabilistic assessment (similar to the Mascot probability score) of the correlation of an experimental and theoretical spectrum (similar to XCorr in SEQUEST) and how much better a peptide match is than a stochastic match (similar to ΔCN in SEQUEST). The combination of database search engine results using various methods has improved overall identification numbers and confidence.548–549 New software for identifying peptides from mass spectrometry data are continually being developed to improve upon widely-used methodologies, newly-implemented fragmentation methods, and for niche applications. A number of software tools have been developed to improve upon the SEQUEST-like search methodology to improve speed, sensitivity, and accuracy through consideration of fragment ion intensity,550–552 algorithm architecture,553–556 and higher quality data.557–559 Similar to trends with SEQUEST, an improved Mascot-like search engine (Andromeda),560 mass accuracy-calibrated filtering,561 and advanced machine learning filtering with Percolator562 capitalize on higher quality data from newer mass spectrometers. On-the-fly database searching has allowed for intelligent, directed data acquisition.563–564 Fragmentation spectra of metabolically labeled peptides were used to validate peptide spectrum matches from unlabeled peptides.565 Probabilistic matching of fragment ions has also proven useful for identifying sequence tags – abundant peptide fragment ion patterns.566–569 In particular, sequence tags facilitate the identification of protein site mutations and unexpected PTMs that would otherwise be missed by a traditional SEQUEST- or Mascot-like database search.570–572 Database search engines have been either modified or newly developed to handle spectra from new fragmentation methods, such as ECD573–574 and ETD,575–577 and variant peptides, such as non-ribosomal peptides.578–579 Other metrics have been introduced to improve PSM confidence and database search speed such as peptide precursor mass accuracy249,558–559,580–584 and charge state predication,585–586 empirical statistical models,482,587 and amino acid composition.588 Statistical analysis of large data sets from CID,589–590 ETD,591–592 and HCD593 have contributed to a better understanding of peptide fragmentation mechanisms for spectral prediction and peptide identification algorithms. In an effort to combine both the computational power that has proven useful with database searches and the versatility of manual spectra interpretation, de novo sequencing methods are becoming a popular area of development. Although database searching is extremely powerful and versatile, de novo sequencing has provided a complementary and alternative unbiased means for identifying peptide sequences, particularly for unknown peptides and proteins, in an automated fashion.594–596 Combining de novo sequencing with database search methods597 have improved the speed598 and sensitivity599 of database searches and the confidence of de novo sequenced peptides.600 Application of de novo sequencing to HCD fragmented601 and Lys-N digested, ETD fragmented602 peptides have exploited less common ion types for sequence determination.
Peptide search results are a mix of correct and false PSMs. The use of a decoy protein database was cleverly introduced as a way to filter for confident PSMs and is still most commonly used,603 although some argue that a peptide probability is adequate and more resistant to false discoveries.604 A decoy protein database is created by reversing or scrambling protein sequences from a normal database which is then appended to the normal protein database. These decoy peptides and proteins are then identified, with lower frequency, during the database search and used as a measure of random, incorrect PSMs. The random and incorrect decoy PSMs can then be used to establish a cutoff for the high confidence PSMs and to estimate the false discovery rate (FDR) of PSMs, peptides, and proteins. Generally, two peptides have been required for identification of a protein, but there is also evidence that a single high confidence peptide identification can be a better indicator than two lower confidence peptides.603,605 Semi-supervised machine learning of peptide filtering improved peptide identifications 17% from tryptic digests and 77% from non-tryptic digests.606–607 Application of statistical methods in combination with the target decoy approach provided greater significance analysis of peptide matches.608 An algorithm to optimize the protein filtering improved protein identifications by ~25% over common methods.609 Considering both PSM and protein false discovery simultaneously in a two-dimensional target decoy strategy yielded a more versatile and accurate representation of peptides and proteins within a sample.610 A strategy has been presented to infer the proteins present within a complex sample from hundreds of LC-MS runs where protein false discovery rates are difficult to control using conventional PSM false discovery rates.611 Similarly, protein database size and quality directly influence the size and quality of the identified protein and peptide candidates. Essentially, with a larger, less curated database the chances of matching decoy PSMs increases, subsequently decreasing the sensitivity of correct PSMs. Thus, database curation is an essential and continuing aspect of proteomics research, recently illustrated with a customized protein database derived from RNA-Seq data.612 For newly sequenced organisms yet to be annotated, a proteogenomic approach can be used to search against the 6-frame translated genome.613–617 For organisms which have yet to be sequenced or are extinct,618–622 a combination of known databases can be used to identify peptides and proteins. These methodologies have even been used to find protein sequences and correct gene annotations for highly studied and characterized organisms such as S. cerevisiae623 C. elegans,624 and Mus musculus,625 and Arabidopsis.626 Leveraging known protein interaction networks, discarded PSMs were matched to proteins expected to be expressed and present as part of functional protein complexes.627 Although software has eased the burden of manual interpretation of tens of thousands of tandem mass spectra, manually validating peptide spectra for proteins and post-translational modifications is still an essential principle of proteomic analysis.
5.2 Protein inference from peptide identifications
Peptides identified with tandem mass spectrometry are used as surrogate representations of intact proteins and their post-translational modifications. We have already described many of the experimental advantages of analyzing proteins as peptides. However, an ongoing challenge of shotgun proteomics is correctly mapping identified peptide sequences to protein sequences, particularly for redundant proteins and isoforms. Further, as proteomics methods continue to become more sensitive and comprehensive and protein databases increase in size, the ability to properly assign peptides to proteins has become even more challenging. At the same time, shotgun proteomics experiments have become more complicated and biology-driven, so the importance of correctly identifying and quantifying proteins from peptides has continued to increase. These challenges include the stochastic sampling and identification of unique peptides from protein isoforms (homologous proteins) or unrelated proteins which share non-unique tryptic peptide sequences (redundant proteins). When peptide sequences are shared among proteins, they are by definition more prevalent and abundant than their unique peptide counterparts, and thus also more easily identified. Conversely, unique peptides are less abundant and harder to identify. Unfortunately, the hard to identify unique peptides carry the most experimental evidence for unambiguous, confident identification of both homologous and redundant proteins. Thus, many bioinformatics strategies have been proposed and implemented to directly address this inherent challenge. Due to the complexity of this issue, a number of guidelines have been established by journal editors and conference organizers which aid in simplifying publication of proteomics data.628–632
Initially, when MS data sets and protein databases were small, peptide database search engines482,587 and filtering software633 assembled and listed all proteins for which there was peptide evidence. In particular, DTASelect and Contrast software packages grouped redundant proteins and isoforms within a single proteomic analysis and allowed for comparison between experiments based on spectral counts and sequence coverage. Generation of a minimal protein list which best described the identified peptide spectrum matches with the Isoform Resolver algorithm yielded a more conservative representation of proteins present in a sample.634 A similar strategy using bipartite graphical analysis in a software package called IDPicker further improved the accuracy and transparency of protein identifications within a single proteomic analysis.635–636 Further classifying peptides as either ambiguous or unambiguous for not only protein sequences and protein isoforms, but also genes using the ProteinClassifier software added further confidence and clarity to protein inferences.637 The majority of these strategies rely solely on the prevalence of peptide identifications, but a few methods have incorporated protein probabilities. The software tool PANORAMICS facilitated calculation of peptide-to-protein assignment probabilities by combining Mascot PSM probabilities and the probabilities of peptides and proteins generating spectra.638 Other distinctive strategies seek to bypass assembling protein identifications from peptide identifications and directly perform protein sequencing from tandem mass spectra of peptides. An “overlap → layout → consensus” strategy for assembling proteins was borrowed from DNA fragment sequencing for “sequencing” proteins from non-specific protein digestions.639 Essentially, repeat peptide identifications were clustered and signal averaged to generate a consensus spectra. Then the consensus spectra were all aligned until the overlaps created a full protein sequence for α-synuclein. A similar strategy with peptide alignment using spectral network analysis has facilitated the unbiased identification of post-translational modifications on proteins.640–641 Although these sequencing strategies have yet to be applied to highly complex mixtures, it has aided in clustering millions of tandem mass spectra from large scale experiments for faster and more sensitive database searches.642 An excellent tutorial on the protein inference problem and implementation of many of these methodologies has been described elsewhere.643
The identification of a single high confidence unique peptide spectrum match can provide high confidence in the presence of a protein, particularly when other high confidence non-unique peptides are also present to support that protein inference. However, quantification by both label-free and isotopic labeling methods can be more complicated. Generally, strategies that remedy the protein inference problem also improve protein quantification.637 In the case of label-free detection using spectral counting, non-unique peptides must be appropriately assigned to redundant proteins to estimate their relative abundances. Similar strategies to address protein identification inference are regularly applied to spectral counting-based quantification, such as with Abacus,644 but caveats exist. A systematic study using six homologous albumins spiked into a complex mixture illustrated that distributing shared spectral counts based on the number of unique spectral counts led to the most accurate and reproducible quantification results.645 For relative ratio measurements using either label-free peptide ion currents or isotopically-labeled peptide ratios, the most accurate method for protein quantification is the use of only unique peptides sequences.646–648 This method is the most stringent as it completely ignores the problem of shared peptides, and unfortunately a wealth of quantitative measurements, making it the least sensitive and comprehensive. Additionally, this method is highly dependent on multiple proteomics parameters; high complexity samples, poor LC-MS sensitivity, and large database size can all limit the number of unique peptides identified and thus quantified from a sample. Further, a small number of quantitative measurements from unique peptides can limit statistical analysis. An advantage of label-free ion current and metabolically-labeled peptide quantification is that multiple sequential measurements are made on peptide chromatographic peaks from MS1 precursor scans, accounting for measurement variability and noise within MS1 scans over the chromatographic peak timescale. Isobaric peptide labeling is used to perform quantification in the MS2 scan and is thus only measured when a peptide precursor ion is sampled for fragmentation. The estimation of measurement variability and noise for a peptide can only be done on peptides that are resampled and thus are highly dependent on the abundance of a protein and its corresponding peptides. Therefore, the ability to use all peptide quantification information, unique or not, would benefit isobaric labeling methods for protein quantification the most. One proposed solution for the use of shared peptides in protein quantification using ratio measurements was demonstrated with peptide ion current measurements.649 The methodology combines the concepts described above used for protein identification inference and for distributing spectral counts of shared peptides among proteins with unique peptide counts. With peptide ratio measurements, peptides shared among proteins can be grouped and assigned to proteins with unique peptide ratio measurements which are statistically similar. The study showed that peptide measurements for protein groups from transferrin and histone 1 isoforms could be appropriately grouped to quantitate individual isoforms of each. Similarly, the differentiation of peptide measurements among the shared peptides from the redundant proteins desmin, vimentin, and keratin was possible. A similar strategy for inclusion of shared peptides in protein quantification was recently demonstrated using a combinatorial optimization to reduce relative abundance measurement error.650 The effect of shared peptides on protein identification and quantification accuracy remains a common challenge in shotgun proteomics. Further software development in the bioinformatics field should continue to address these challenges.651 The continued development of middle-down proteomics, which identifies larger peptide fragments with higher probability of being unique, should also help to address this wide-spread challenge.14,297,652–654
6 Applications
6.1 Protein-protein interactions and protein complexes
Typically, biological processes are carried out by interactions between many biomolecules. There are diverse types of interactions, such as protein-DNA or RNA, DNA-DNA, DNA-RNA and protein-protein interactions. Of these biomolecule interactions, protein-protein interaction are challenging to study due to their high diversity.
The classic approach to studying protein-protein interactions is yeast two-hybrid (Y2H) system (Figure 11a) which was introduced more than 20 years ago.655 In a Y2H experiment, a transcript factor is split into two subunits, one is the binding domain (BD) and the other one is the activating domain (AD). The engineered bait protein is fused to the BD and the second protein (prey) is fused to the AD. If the bait and prey proteins interact with each other, the transcript factor can be activated, starting the transcription of reporter gene. Otherwise, there will be no transcription of the reporter gene (Figure 11a). Y2H was designed to investigate direct binary interactions. The initial Y2H experiments focused on the interactions between a limited number of proteins. However, after genome scaled resources of open reading frames (ORFeomes) became available, comprehensive network maps have been drawn for various model organisms by large scale Y2H, including Saccharomyces cerevisiae,656–659 Drosophila melanogaster,660 Caenorhabditis elegans,661 and more recently even human.662–665
Figure 11.

The protein-protein interaction detected by Y2H and AP-MS. a: Y2H is used to detect binary interaction. The results here demonstrate the protein B can interact with protein A and C, but not D. b: AP-MS is used to identify the whole protein complex. All the interactors binding to protein B, including both direct and indirect binders, are identified by shotgun proteomics.
While Y2H has been widely used in high throughput protein interactome studies, there are limitations. The primary limitation is that the protein interactions do not occur in their physiological cellular conditions, and it is only possible to detect direct interaction between two proteins; any information on indirect interactions will be ignored.
An approach complementary to Y2H based on affinity purification and mass spectrometry (AP-MS) was developed to explore the protein-protein interaction for both targeted and large scale research. In an AP-MS experiment the target protein of interest, together with its interacting partners, is purified from a protein mixture. The purified protein complex is then subjected to shotgun proteomic identification and quantification (Figure 11b).10,614 PTM information can also be collected if desired. Because it is carried out under endogenous conditions, the AP-MS strategy enables identification of both direct and indirect interactors. Generally, the topology of the protein interactome is not found from the AP-MS strategy because it is incapable of distinguishing direct and indirect interactors (Figure 11b). However, chemical cross-linking of protein complexes and the analysis of their cross-linked peptides can provide this information.666 Alternatively, the reverse purification of protein complex components can be used to infer topology, as in global AP-MS studies. Methods which analyze intact protein complexes are also being developed to address these issues.667–668 Ideally, interactome experiments based on AP-MS should employ high quality monoclonal antibodies against the bait proteins. However, this is sometimes difficult due to a lack of good antibodies. Commonly, an engineered protein with an affinity has been used in AP-MS based protein interactome studies. Instead of using a specific antibody against target protein, the affinity tag system employs a uniform tag specific purification which can be used for many bait proteins. A widely used tag system is tandem affinity purification (TAP),669 which consists of calmodulin-binding peptide (CBP) and protein A of Staphylococcus aureus (ProtA), linked by a tobacco etch virus (TEV) cleavage site (Figure 12). The TAP fused protein and its interactors are first pulled down by the distal ProtA affinity tag, and then released by cutting at the TEV cleavage site. The bait protein complex is subsequently subjected to the second purification step, which binds the CBP (Figure 12). The advantage of TAP compared with the normal single-step procedure is reduced background protein levels. Ideally, all the proteins non-specifically binding to the affinity beads are excluded after the second purification. Many other variations of TAP have been developed with other features.670
Figure 12.

Scheme of tandem affinity purification (TAP). Two steps of purification significantly remove the unspecific binding proteins.
Large scale studies on protein interactomes have also been achieved using AP-MS approach. The pioneering large scale work by AP-MS focused on the yeast system,671–674 but other organisms have also been investigated, including Escherichia.coli,562,675–676 and human.677
Although AP-MS has potential for drawing the whole interactome map, results can contain both false positive and false negative interactors. False positives are mainly caused by nonspecific interactions, such as proteins binding to affinity matrices while false negatives are generally from weak interactions. If experimental conditions do not mimic the physiological conditions, weakened binding between interactors can be observed. Because removal of non-specific binding protein typically requires intensive wash steps, weak interacting proteins can be lost.
Using AP-MS, either in target or large scale studies, researchers have obtained valuable evidence on how proteins interact. This information can help us gain understanding of disease and biological process mechanisms, and the influenced pathways can provide promising targets for pharmaceutical discovery. Furthermore, the multiple interactors in a network may work together as diagnostic or prognostic biomarkers.
6.2 Comparative systems analysis
Many comparative global proteomic studies seek to find the most relevant proteins in a biological process through expression changes upon perturbation. With enough relative protein change measurements, comparative analysis of entire biological systems can be performed. Proteomic systems analysis has been primarily driven by improvements in the comprehensiveness of quantitative analysis and the bioinformatics tools which facilitate these categorizations and comparisons. Quantification of protein expression and post-translational modification changes on thousands of proteins consecutively allows for analysis of the entire system under either normal or perturbed conditions. In particular, pathway analysis tools such as Ingenuity have simplified these comparisons. A PubMed search with key words “comparative”, “proteomics”, and “mass spectrometry” yields almost 2,500 citations. This large number of publications is a representation of how prevalent and important these types of studies have become. Since this number of publications is surely outside the scope of this review we have attempted to list and briefly describe notable studies in a chronological fashion below. Phosphoproteomic-based systems based studies are described in the ‘Investigation of signaling networks through phosphoproteomics” section. These references should provide examples of the capabilities of shotgun proteomics in systems biology.
Integration of quantitative proteomics data with DNA microarray and protein interaction data from yeast initially demonstrated the ability to perform quantitative pathway analysis.678 Nutrient limitation of yeast and comparison of transcript and protein expression data revealed alternative carbon source pathways are transcriptionally upregulated with reduced glucose, while nitrogen scavenging pathways are upregulated post-transcriptionally through more efficient translation and/or reduced protein degradation with reduced ammonia.679 Application of absolute protein quantification measurements revealed protein abundance within prokaryotes (E. coli) is equally regulated between transcriptional and translational mechanisms while in eukaryotes (S. cerevisiae) > 70% is controlled by post-transcriptional, mRNA-directed mechanisms.680 Subtractive proteomics on nuclear envelopes discovered new integral membrane proteins linked to dystrophies.681 Comparative proteomic analysis of long-lived C. elegans mutants identified insulin signaling targets that modulate lifespan.457 Comprehensive quantitative proteomics of haploid versus diploid yeast suggested efficient control of the pheromone pathway and mating response.178 Proteomic analyses revealed evolutionary conservation and divergence of N-terminal acetyltransferases from yeast and humans.682 Lysine acetylation was found to target protein complexes and co-regulate major cellular functions.405 New roles for protein glycosylation were discovered in eukaryotes, namely mitochondrial protein function and localization, from global analysis of the yeast glycoproteome.683 Three functionally different human cell lines were compared; large abundance differences from various functional protein classes were observed along with low abundance cell-type specific proteins and highly enriched cell-surface proteins.684 Comparison of transcript and protein levels in yeast upon osmotic stress revealed transcript increases correlated to protein increases, but transcript decreases didn’t affect protein abundance.685 A quantitative comparison between human induced-pluripotent and embryonic stem cell lines found the majority of proteins (97.8%) unchanged, indicating differences are from experimental conditions and not molecular signatures; the 58 changed proteins were involved in metabolism, antigen processing, and cell adhesion.686 Through systematic deletion of the two kinases, one phosphatase, and two N-acetyltransferases within Mycoplasma pneumonia, followed by proteomic analysis, the cross-talk between phosphorylation and lysine acetylation modifications and their roles in regulating protein abundance were demonstrated.687 From these system-wide discoveries, there is no doubt that shotgun proteomics has become an essential tool in biological studies.
6.3 Systems analysis of PTMs
Signal networks induced by various extracellular and intracellular signals are essential for regulation of cells and organisms; many diseases can occur due to malfunctions in signal pathways. In order to understand biology and pathology in cell systems, study of the mechanisms of signal networks is necessary. Regulation of post-translational modifications (PTMs), including phosphorylation, glycosylation, acetylation, ubiquitination, and methylation, is one of the major mechanisms in signal networks. For example, once binding of endogenous or exogenous ligands to membrane receptors has occurred, a signal can usually be amplified through a phosphorylation cascade, affecting the level of expression of various genes. In addition, a signaling network may be involved in crosstalk with other signaling networks.
Western blotting using specific antibodies has traditionally been performed for detection of these PTMs, with signal intensities from Western blotting as an estimation of changes to PTMs in a specific state. However, limitations to use of antibodies include nonspecificity of antibodies, variance in quantification, and absence of specific antibodies to specific proteins or PTM motifs. The advantages of methods recently introduced for mapping PTM with MS have been demonstrated, even though there are challenges to identification of modified peptides of low abundance and analysis of MS/MS spectra from complex data sets have been reported.688,689 Below, we have described how various applications of MS-based shotgun proteomics are utilized for characterization of signal networks through PTMs.
6.3.1 Investigation of signal networks through phosphoproteomics
The first study of the global signaling network of epidermal growth factor (EGF) based on MS was reported in 2004.690 In this study, the time course of EGF signals through their activation upon stimulation of epidermal growth factor was determined by identifying 81 signaling proteins and 31 novel effectors. In addition, 6,600 phosphorylation sites from 2,244 proteins showing dynamic regulation by EGF stimulation were found.690 Several studies focusing on Tyr phosphorylation signaling have been reported for insulin stimulation, which plays an important role in control of glucose, and many new insulin-regulated substrates have been identified.691 Similarly, Tyr phosphorylated proteins have been quantified in order to reveal signal networks of platelet-derived growth factor (PDGF) for proliferation of mesenchymal stem cells.692 In addition, a SILAC-based study of the differentiation of human embryonic stem cells identified 3,067 phosphorylation sites.693 A label-free quantification study of the effect of multiple tyrosine receptor kinases in growth of undifferentiated embryonic stem cells identified 2,546 phosphorylation sites.694 Phosphoproteomic analysis of toll-like receptor (TLR)-activated macrophages confirmed canonical targets within the TLR pathway and identified the cytoskeleton and new signaling molecules as targets of phosphorylation.695 Based on two different fragmentation methods, CID and ETD, more than 10,000 phosphorylation sites have been detected in embryonic stem cells.696
In yeast, quantitative phosphoproteomics has been applied to the study of the pheromone signaling pathway and 139 of the more than 700 identified phosphopeptides were found to be differentially regulated.697 In addition, findings from a study of MAPK pathways required for mating versus filamentous growth determined that Fus3 (mating-specific MAPK) can prevent crosstalk between the two pathways.698 Recent work on the phosphoproteome of the yeast centrosome identified 297 phosphorylation sites from different cell cycle stages, and mutation studies of phosphorylated residues, identified by MS in Spc42 and γ-tubulin, demonstrated the important roles of phosphorylation in the biology and function of centrosomes.699
Through phosphorylation, protein kinases can affect the activity, cellular location, protein binding, and stability of proteins. The catalytic domains of most kinases are highly conserved and are involved in ATP binding and phosphorylation of target proteins; allosteric modulation of this catalytic domain is exerted through a regulatory domain. Based on substrate recognition sites, kinases can be categorized into two classes: Ser/Thr kinases and tyrosine kinases. Many global approaches to phosphorylation have been reported. However, due to low abundance of protein kinases, compared with their substrate proteins, phosphorylation studies of protein kinases have been underrepresented.314,315,350,700 Antibody-mediated purification of tyrosine phosphorylated proteins692 and immobilized kinase inhibitors has been performed for concurrent enrichment of protein kinases.701,702
Use of kinase-selective affinity purification for the kinome approach across the cell cycle resulted in quantification of 219 protein kinases from S and M phase-arrested human cancer cells and also identified more than 1,000 phosphorylation sites on protein kinases.703 Development of an integrated method termed KAYAK (Kinase ActivitY Assay for Kinome profiling) for large-scale kinase activity profiling using stable-isotope dilution and high resolution MS has been reported.704 In this study, 90 site-specific peptide phosphorylations were measured, and the source of activity for a peptide derived from a PI3K regulatory subunit was identified, which was confirmed to be a novel Src family kinase site in vivo.704 Throughput and multiplicity in this method was improved by assessing rates of phosphorylation for all 90 of the same peptides used previously in a single reaction.705 The modified KAYAK strategy reports activation of cellular signaling pathways, including mitogen stimulation of HEK-293 and HeLa cells. In addition, combining single-reaction KAYAK with kinase inhibition enables resolution of pathway specificity.705
6.3.2 Investigation of signal networks through proteomics of other PTMs
O-GlcNAc (β-O-linked 2-acetamino-2-deoxy-β-D-glucopyranose) modification plays an important role in signaling networks, including nuclear transport of cytosolic proteins, protein degradation, and tolerance of cellular stress. This modification is reversible and is controlled by two enzymes, O-GlcNAc transferase (OGT) and O-GlcNAcase (OGA).706 O-GlcNAcylation competes with phosphorylation at the same serine/threonine sites or at proximal sites on some proteins. O-GlcNAc modification is a low abundance and labile modification, therefore, detection of the structure of glycans and of modification sites on proteins using traditional mass spectrometric methods is difficult. For identification of O-GlcNAcylated proteins or modification sites, a number of enrichment strategies have been employed including: O-GlcNAc specific lectin succinyl wheat germ agglutinin (sWGA),707 immunoprecipitation using O-GlcNAc specific antibody,708 peptide tagging with BEMED (β-eliminated followed by Michael addition with dithiothreitol),709 chemoenzymatic tagging-enrichment strategy,710 and a photocleavable biotin-alkyne reagent (PCbiotin-alkyne) tag.711 In studies to determine a dynamic relationship between O-GlcNAcylation and GSK-3 dependent phosphorylation, at least 10 proteins showed increased O-GlcNAcylation upon GSK-3 inhibition by lithium, whereas 19 other proteins showed decreased O-GlcNAcylation.712 To examine the effect of site-specific phosphorylation dynamics on globally elevated O-GlcNAcylation, sequential phosphopeptide enrichment was combined with iTRAQ labeling which resulted in the quantification of 711 phosphopeptides in NIH3T3 cells.713 According to finding from these studies, cross-talk between two major PTMs is extensive; this result may be due to both steric competition of occupancy at the same or proximal sites and regulation of the other’s enzymatic activity. In addition, regulation of activities of Calcium/calmodulin-dependent kinase IV (CaMKIV) and IKappaB kinase (IKK) by O-GlcNAc modification has been reported.714,715 Pharmacologically or genetically induced increases in O-GlcNAc resulted in severe defects in mitotic progression and cytokinesis.716,717 These data clearly exemplify the importance of the interplay between O-GlcNAcylation and phosphorylation in cellular signaling pathways.
Ubiquitination (Ub), conjugation of Ub to the 3-amino group of a lysine in a substrate protein, is involved in regulation of various cellular pathways, including signal network, protein degradation, and cell division. While mono-Ub is related to ligand-mediated endocytosis, poly-Ub is related to the proteasome pathway for protein degradation. Using quantitative MS, identification and quantification of various forms of Ub bound to EGFR have been achieved using the Ub-AQUA method. This result demonstrated that more than 50% of all EGFR bound Ub was a poly-Ub form, which was targeted to the lysosome.718 Cyclin B1 is also modified by Ub chains of complex topology, rather than by homogeneous Lys 48-linked chains, and is degraded by the 26S proteasome.719
Methylation and acetylation of histones is known to be part of an epigenetic marking system using different combinations of histone modification for control of gene expression.720,721 Findings from SILAC-based proteomic analysis in breast cancer cells treated with a histone deacetylase (HDAC) inhibitor showed induction of lysine acetylation in chromatin-associated proteins as well as non-histone proteins, including transcriptional factors, chaperones, and cell structure proteins.722 Regulation of EGFR trafficking by lysine deacetylase HDAC6 through control of acetylation of alpha-tubulin has been reported.723
S-nitrosylation, modification of cysteine thiol by a nitric oxide (NO), is emerging as an important PTM involved in regulation of cell signaling.724 Due to the labile nature of the S-NO bond, detection of S-nitrosylated proteins is difficult, because it is frequently lost during sample preparation. Several methods, including the biotin switch assay and the chemical reduction/chemiluminescence assay, have been developed.725,726 The biotin switch method converts S-nitrosylated Cys to biotinylated Cys. This method has been used for identification and characterization of S-nitrosylated proteins in Arabidopsis plants, resulting in identification of 63 proteins from cell cultures and 52 proteins from leaves as candidates for S-nitrosylation, including signaling, redox-related, and stress-related proteins.727
Classical biochemical studies using antibody-based approaches to conduct unbiased large-scale studies of various extracellular and intracellular signals are limited. Because regulation of many proteins occurs after transcription of genes, global MS-based PTM proteomics enables system-wide characterization of signaling networks and complements gene expression analysis.
6.4 Protein turnover
With modern mass spectrometers and quantitative methods, large scale and targeted protein information is obtainable, including measurement of quantitative protein abundance levels and protein modifications. However, current methods only provide a ‘snapshot picture’ of a cellular state at the time that sampling occurs. Protein abundance and modification are both highly dynamic and tightly regulated. Measurement of the dynamics of a proteome may provide critical answers for many biological questions. It has been shown that there is a poor correlation between mRNA and protein levels,678,728–729 which may be partly explained by the protein synthesis/degradation rate. Moreover, protein turnover information can also be valuable as a biomarker. Since protein quantity is determined by synthesis and degradation rates, a change in protein turnover rates may precede a change in protein expression level. Several studies have observed significant changes in protein turnover but smaller changes on protein expression.730–731
Protein turnover analysis is not a new idea, and can be dated back to 1930’s.732 A typical turnover study involves administering either radioactive or stable isotope labeled tracers, which are incorporated into the protein synthesis. The resulting labeled proteins can be captured and determined by either scintillation counting or mass spectrometry. The classic ‘pulse-chase’ strategy uses radioactive isotopes to partially label proteins in a ‘pulse’ period, and measures their decay during the ‘chase’ period, when the non-radioactive isotope is applied. The advantages of this platform are that it only requires labeling part of a protein, and only the labeled fraction is measured along the time course. However, this method is more suitable for assessment of the average decay rate for all proteins in a biological system. Individual protein turnover information can only be obtained by protein purification, which limits the throughput of this method.
Besides isotope tracers, there are other methods developed for protein turnover or stability studies. One strategy is to inhibit the protein biosynthesis using cycloheximide.733 The protein degradation rates can be assessed by protein band intensities during the time course of cycloheximide treatment because there is no newly synthesized protein during this period. This method is usually used for the measurement of one or a limited number of proteins, since western blot is a low-efficiency detection assay. Recently, this strategy was scaled up to nearly 4,000 proteins by using a collection of yeast strains expressing tandem affinity purification (TAP) tag733 (Figure 12), which was universally used for target in immunodetection. One drawback of this method is that the inhibition of protein synthesis may greatly influence the biological nature of cells, and further change protein stability. Other newly developed methods rely on the libraries of clones expressing different proteins tagged by fluorescence.734–735 These methods indeed make protein turnover analysis possible on a large scale. However, the establishment and utilization of such engineered libraries are time and labor intensive processes and it is still quite challenging to apply this method to all organisms, especially mammals.
As discussed above, radioactive labeling, protein synthesis inhibition, and fusion protein libraries all have benefits and shortcomings for protein dynamics studies. Alternatively, several MS and stable isotope based approaches have emerged to explore protein turnover on a large scale for both single cell systems and animals. Compared with the radioactive isotope ‘pulse-chase’ method, a stable isotope labeling turnover experiment typically only includes a ‘pulse’ phase. This means that upon switching the medium/diet, the organism is only grown in an isotope-enriched environment until the sampling time points. The ratios between unlabeled and labeled peptides are used to interpret the protein turnover rates.
The most common type of protein turnover study is carried out on a single cell system, such as a cultured cell line. In this case, the design of the experiment is relatively straightforward: the protein synthesis precursor pool is principally composed of the amino acids from the medium. A switch of medium from an unlabeled to a labeled state or vice versa results in a rapid incorporation of isotopes in the newly synthesized proteins. In other words, almost all the newly synthesized proteins generated after the medium change will be labeled with the same relative isotope abundance (RIA) as is present in the medium. Data analysis is straightforward because the two groups of proteins, pre-existing and newly synthesized, both have defined RIA and predictable mass spectrometry distribution.736 An example of this method used the pulsed SILAC (pSILAC) approach to show the influence of microRNAs on protein synthesis.737 miRNA transfected and control Hela cells were subjected to either medium-heavy or heavy SILAC medium in the pulse. The mass spectrometry peak abundances of medium-heavy or heavy groups, representing the newly synthesized proteins, were used to compare the protein synthesis. More than 3000 proteins were quantified on their synthesis level, and hundreds of genes were observed to be directly repressed by microRNA. Another study employed a triple-SILAC method to measure protein synthesis and degradation on 8,041 Hela cell proteins.738
However, this strategy cannot be easily adapted to whole animal studies because the change of dietary isotope does not lead to a sudden and complete labeling of the precursor pool. Incomplete labeling results from the breakdown and re-use of unlabeled amino acids in protein recycling. For animals, such a rapid precursor pool change can only occur via intravenous injection of the isotope tracer by either continuous infusion739–740 or a flooding dose.741 Alternatively, oral administration of stable isotope labeled water, 2H2O or H218O,742 also achieves fast equilibration between body water and free amino acid. The limitation of these methods is that measuring protein turnover of individual proteins in a high throughput manner is not always possible due to its low overall RIA. Two recent studies have used this water strategy, measuring the protein turnover on a global scale.743–744 Next, the sudden intake of the isotope tracer by intravenous injection may alter protein synthesis and lead to artificial protein turnover results,745 and the hydrogen/deuterium exchange is reversible and can result in a back-exchange from deuterium to hydrogen during sample preparation in aqueous solvents.746–747 Furthermore, the water method relies on the analysis of a minor isotopic peak pattern change, which could be easily influenced by error in the ion intensity measurement. To avoid these complications the isotope tracer can be administered more naturally via the diet748–749 with fewer side effects. The major challenge here is that the protein synthesized during pulse phase will be labeled to varied isotope extents since the precursor pool will saturate gradually. In one study, chicken was chosen because of its continuous diet intake which leads to a quick increase and plateauing of precursor RIA that subsequently remains constant.748 However, this method is not applicable to other mammals, including mice.
Two recent independent studies have employed similar 15N labeled diets to determine the protein turnover in mice at the proteome scale.749–750 Both groups switched the normal diets of the mice to a 15N labeled diet at a given time point and analyzed the protein samples after different feeding times, ranging from a half day to several weeks. They then measured the ratio between unlabeled and labeled peptides derived from the brain and plasma proteins. The ratio of the unlabeled/labeled peptides reflects the abundances of pre-existing and newly synthesized proteins (Figure 13). Both studies revealed the mouse protein turnover information on a large scale. For quantification purposes, special algorithms were developed for data interpretation, as the partial 15N labeled peptides generated complicated isotopic peak distribution. Price et al tried to define the 15N incorporation rates of all newly synthesized peptides.750 The observed 15N peptides were a heterogeneous group synthesized from a time window with varied incorporation rates. Furthermore, the 14N and 15N peptides are most likely to overlap with each other when the precursor RIA is low (Figure 13b–c). Zhang et al. avoided the requirement for the knowledge of labeling incorporation rates and complete separation of the tryptic peptides, providing a straightforward data processing platform.749 In both studies, an 15N diet was used instead of a SILAC diet to determine protein turnover in mammals because if a SILAC diet was used, part of the newly synthesized SILAC peptide would appear in the unlabeled isotope pattern unless the precursor is fully labeled, making it impossible to distinguish between the two with MS. Although the newly synthesized SILAM peptides may also appear at a low incorporation rate shortly after the labeling, it is still possible to separate it from the pre-existing unlabeled peptide. The 15N-labeled tracer, present in all amino acids, significantly amplifies protein labeling efficiency (Figure 13). For instance, if a protein is synthesized in a 20% labeled precursor pool, SILAC will have 80% of total newly synthesized peptides appearing in unlabeled form, whereas SILAM will have little chance of generating totally unlabeled peptides, because all the 20 amino acids are labeled.
Figure 13.

The protein turnover measured by 15N partial labeling with the software ProTurnyzer.749 The representative peptide has an amino acid sequence of LDKSQIHDIVLVGGSTR derived from mouse heat shock cognate 71 kDa protein. The yellow peaks represent the pre-existing peptide with natural isotopic composition, whereby the purple peaks represent peptide synthesized during 15N feeding. The gain of purple and removal of yellow reflect protein synthesis and protein degradation, respectively. The red bars indicate the intensity error between theoretical and measured peptide isotope distributions. The inset figures are the observed mass spectra for which the unlabeled and labeled peptide peaks were analyzed.
The order of isotopic treatment is not critical, since newly synthesized peptides can be detected as either heavy or light. Both will lead to equivalent results. However, since fully labeling an organism consumes a great deal of time and money, it is generally preferable to start with peptides in an initial condition of natural isotope, followed by partial heavy isotope labeling. Recently, a reverse strategy was conducted in rat to study extremely long-lived proteins which may provide insight into cell aging and neurodegenerative diseases.751 The rats were fed a 15N diet starting in utero. After the labeling efficiency reached 100%, the food supply was switched to standard 14N. After 12 months, almost all the proteins had been resynthesized with natural isotope composition and any remaining 15N peptides represented the initially synthesized proteins. These long-lived proteins were found to be related to the nuclear pore complex, the central transport channels that mediate all molecular trafficking in and out of the nucleus. Clearly, the reverse-labeling method was more suitable for this study, since it did not require long term (12 months) isotope feeding and avoided any confusion caused by 14N peptide contamination which comes from other sources, such as keratin. In another study, researchers used multi-isotope imaging mass spectrometry, together with 15N-labeling, to reveal that the stereocilia were generally remarkably slowly turned over, but a rapid turnover was found only at the tips of stereocilia.752
With current MS-based strategies, decoupled protein synthesis and degradation rates cannot be easily measured simultaneously, because the quantitative measurements only represent the relative abundance, not the absolute abundance. The ratio between unlabeled and labeled isotope peaks can be affected by any change in pre-existing and newly synthesized proteins and the turnover rate measured describes the relative change between protein synthesis and degradation. Currently, the fractional turnover rate calculation is based on the assumption that the protein is in steady-state (i.e. the protein has equal rates for synthesis and degradation), is not always true.
6.5 Clinical application
Recent advances in MS-based proteomics have made it an indispensable tool for use in the clinic. The goal of clinical proteomics is the identification of disease-specific biomarkers using clinical samples, such as plasma and tissues from patients. Identification of useful biomarkers of disease should provide a better chance for early diagnosis, optimization of treatment, and means for monitoring progress during treatment. To increase the chance for identification of biomarkers, MS-based proteomics technologies that enable identification of a large number of proteins with high throughput using small amounts of materials have been developed. Clinical proteomics using the latest proteomic technologies in conjunction with advanced bioinformatics is currently being used for identification of molecular signatures of diseases based on protein pathways and signaling cascades, and holds great promise for the future of medicine.
6.5.1 Biomarkers
A biomarker is a substance used as an indicator of normal biological processes, pathogenic processes, or pharmacological responses to a therapeutic invention.753,754 A biomarker can be a traceable substance used for examination of change in expression of a protein that reflects the risk or progression of a disease, or the susceptibility of the disease to a treatment. Serum markers, such as prostate-specific antigen (PSA) for prostate cancer, C-reactive protein (CRP) for heart disease, CA-125 for ovarian cancer, and CA 19-9 for colorectal and pancreatic cancer, are currently being used; however, they do not show sufficient sensitivity or specificity for early detection. Ideally, a unique biomarker for each disease should have the capacity for diagnosis of patients who do not have specific symptoms. Development of biomarker panels comprised of several proteins could result in improved detection and clinical management of various patients and provide higher sensitivities and specificities than a single protein biomarker.
6.5.2 Biomarker discovery based on clinical proteomics
6.5.2.1 Sources for biomarkers
Blood is in contact with virtually all cells of the organism; therefore, it is considered the optimal source for discovery of biomarkers. As a source of biomarkers, blood is easily accessible, and its collection is low risk and relatively non-invasive. Release of tissue-related proteins into the blood stream occurs through a specific secretory mechanisms, either shedding from the cell surface or nonspecific leakage.755
As an alternative to blood, other biofluids, including urine, cerebrospinal fluid, pancreatic juice, nipple aspirate fluid, and bile can be used. Urine is a common source for discovery of biomarkers (for urogenital disease as well as non-urogenital) due to its simple and non-invasive collection.756 Urinary exosomes, endogenous microparticles identified in urine, have been shown to be a source for urine biomarker discovery using LC-based proteomics.757,758 Cerebrospinal fluid can be used for discovery of biomarkers for disease of the central nervous system.759 Pancreatic juice is used for non-invasive diagnosis of pancreatic cancer. Nipple aspirate fluid, found within the ductal and lobular system in non-pregnant and non-lactating women760 has been used in proteomic analysis of breast cancer.761 Proximity of bile to the biliary tract makes it important for study of cholangiocarcinoma, a primary cancer that arises from biliary epithelial cells; secreted or shed proteins in bile can be relevant for its study.762
Use of tumor tissues as a source of biomarkers is crucial for cancer biology. While the use of tumor tissue is limited by the small size of sample collected, the advantage of using clinical samples for biomarker discovery is that normal tissue from the surrounding area of the tumor can be used for paired analysis. Laser Capture Microdissection (LCM) has been employed to reduce the heterogeneity in human tumor tissues used in oncoproteomics studies.763 Recent work to extract intact proteins from formalin fixed and paraffin-embedded (FFPE) tissues has provided a huge potential for conduct of biomarker studies using millions of stored specimens.764
6.5.2.2 Prefractionation and pre-treatment of clinical samples
The complexity of the serum proteome presents a broad range of technical limitations for its use in clinical proteome analysis. Plasma proteins show a dynamic range of 10 orders of magnitude in concentration from albumin to the least abundant proteins.55 Fortunately, clinical proteomics research has benefitted from development of various fractionation techniques and sensing approaches for management of the complexity of proteins and dynamic range in serum samples,765,766 further described in the “Protein depletion and equalization methods” section. One strategy designed to overcome the issue of dynamic range coupled protein prefractionation with depletion methods for removal of abundant proteins in plasma proteomes. Several approaches can be used for removal of abundant proteins from plasma. One approach involves the use of immunoaffinity columns such as top-12 and top-14 IgY depletion columns.767
Most protein biomarkers used clinically, such as PSA, CA125, and CEA, are glycosylated.768,769,770,771 Alteration of cellular glycosylation is known to occur in association with different disease states.772 There has been a great deal of work in discovering new potential markers using the shotgun method based on glycopeptides/glycoproteins or glycans structures, especially in the cancer area. In the study of glycoproteins using proteomic approaches, various types of lectin chromatography are known to be capable of enriching glycosylated proteins from complex matrices387 and a covalent method for capture using hydrazide is used for capture of glycoproteins/glycopeptides.773 In addition, a combination of titanium dioxide chromatography with HILIC showed selective enrichment of sialic acid-containing glycopeptides.774 Recently, MS-based analysis of glycopeptides generated from immobilized-Pronase digestion has been enhanced by sensitive and reproducible chip-based porous graphitized carbon (PGC) nano-LC.775 Simultaneously, the shotgun method based on glycans structures has been developed to discover new potential markers, especially in the cancer area. Two methods, compositional mass profiling and structure-specific chromatographic profiling, are currently used for comprehensive analysis of glycans. For compositional mass profiling method, Lebrilla’s group has reported extensively on the application of a MALDI-MS based glycomics platform to discover glycans biomarkers of various cancers.776–778 To differentiate or distinguish between glycans isomers, a method for structure-specific chromatographic profiling of glycans has been introduced 779–780 These studies utilize structure-sensitive chromatography, such as PGC and HILIC, to separate glycans online prior to MS analysis. Recently, a microfluidic chip packed with graphitized carbon was used to chromatographically separate the glycans and 300 N-glycan species were identified from serum samples of prostate cancer patients.781 Meanwhile, O-glycan structures of MUC1, a cell-surface glycoprotein, in breast, prostate, and gastric cancer samples have been determined by LC-MS/MS.782 Software to analyze tandem spectra of oligosaccharides has been developed. For N-linked glycans analysis, GlycosidIQ 783 including only known glycans in its library, and GlycoFragment/GlycoSearchMS 784 including hypothetical glycans structures have been developed. Recently, GlycoWorkbench 785 was designed specifically to assist those with greater knowledge of glycans MS with annotation of glycans fragment spectra. Moreover, Cartoonist Two 786 was developed for interpreting tandem spectra of O-linked glycans.
Different sample processing techniques, such as size fractionation, protein A/G depletion, and magnetic bead separation (C3, C8 and WCX), are known to be effective for reduction of the dynamic range and complexity of serum samples.787,788 Evolution of a combination of separation, detection and labeling strategies has enhanced possibility for sensitive, multiplexed detection of low-abundance disease-specific protein biomarkers in serum samples.
6.5.2.3 Example of biomarkers identified for various diseases
Proteomics has been used widely for identification of biomarkers of various diseases, including cancer, autoimmune disease, and infectious disease. In a gel-based proteomic study, increased expression of epidermal fatty acid binding protein 5, methylcrotonoyl-CoA carboxylase 2, palmitated protein A2, ezrin, and stomatin-like protein 2, and decreased expression of smooth muscle 22 were identified as diagnostic markers associated with lymph node metastasis in prostate cancer.789 2-D DIGE and MALDI-ToF MS were used for detection of potential serological biomarkers, S100A8 and S100A9 (Calgranulin A and B), in colorectal cancer.790 In an experiment for discovery of biomarkers for head-and-neck squamous cell carcinoma, 4-plex iTRAQ was used for comparison of paired and non-paired non-cancerous samples with cancerous tissues.791 iTRAQ has also been used to study of cancer angiogenesis, metastasis, epithelial mesenchymal transition, cancer therapy resistance, and cancer secretome. In another study, sera of patients with colorectal cancer were investigated using LC-MS/MS; growth/differentiation factor 15, divergent member of the transforming growth factor-beta superfamily, and trefoil factor 3, which is secreted from goblet cells of the gastrointestinal tract with mitogenic and antiapoptotic activity, were identified as potential biomarkers for early diagnosis of colorectal cancer.792 Performance of serum profiling using proteomics has resulted in identification of biomarkers for many autoimmune diseases, including systemic lupus erythematosus (SLE),793 rheumatoid arthritis (RA),794 multiple sclerosis,795 and Crohn’s disease (CD).796 In addition, use of serum profiling has also resulted in identification of biomarkers for many other human diseases, including stroke,797 non-alcoholic fatty liver disease (NAFLD),798 diabetic nephropathy,799 Down syndrome (DS),800 sarcoidosis,801 and graft-versus-host disease.802 The Van Eyk group has performed extensive work in the area of proteomics for predicting heart attacks.803–804 In addition to cancers and autoimmune disorders, serum proteome analysis has also provided biomarkers for many infectious diseases, including tuberculosis,805 severe acute respiratory syndrome (SARS),806 and hepatitis.807 Most of proteins listed in this section are putative biomarkers and have not been rigorously verified.
6.5.2.4 Verification and validation of biomarkers3
6.5.3
MS based proteomics holds special promise for identification of biomarkers that can be used for blood tests. However, as shown in Figure 14, only a small number of blood-based biomarkers have been qualified or verified,808 and even fewer have been validated (which requires larger groups of patients for testing of the proposed biomarker)809 because current proteomics methods present several bottlenecks for analysis of large numbers of samples. Verification of biomarkers can require 100 – 1,000 samples, whereas validation of biomarkers requires analysis of even larger numbers (thousands to tens of thousands).808 The same assays are used for verification and clinical validation of biomarkers.810 Due to high throughput and high sensitivity for quantification of proteins, ELISA is regarded as a general assay method. However, development of an ELISA method for one biomarker candidate is expensive and requires more than one year, and specific antibodies are sometimes unavailable.811 Due to its multiplexibility, specificity, and sensitivity, MRM can also be used for validation, large-scale validation, or validation for subsequent analysis.812 In addition, using MRM, reproducibility can be maintained across multiple laboratories. Monitoring initiated detection and sequencing-multiple reaction monitoring (MIDAS-MRM) allows for rapid and cost-effective absolute quantification and validation of biomarkers without the need for antibodies.813 As examples of high-throughput MRM analysis using clinical samples, MRM-MS was applied to verify 12 target proteins for diabetic retinopathy using 3 groups of vitreous and plasma samples from 3 different stages of patients.814 Kuzyk et al. demonstrated the rigorous MRM quantification of the 45 endogenous plasma proteins with 31 of these being putative biomarkers of cardiovascular disease.815 This study was done without sample enrichment or fractionation in a single 45 min MRM analysis, in combination with stable-isotope labeled peptide standards. To improve the limit of quantification, MS3 fragment ions were monitored instead of MS2 fragment ions for SRM transitions, termed MRM3.816 It was demonstrated that this method could show 3- to 5-fold improvements in limit of detection using 5 model proteins and detect protein biomarkers at the low ng/mL level in nondepleted human serum.816 In addition, coupling a nanospray ionization multicapillary inlet/dual electrodynamic ion funnel interface to a commercial triple quadrupole mass spectrometer improved ion transmission efficiency that increased by ~70-fold of average MRM peak intensities.817 Various software related to MRMs has been developed to facilitate surrogate peptide determination and data processing. The commercial software include Pinpoint from Thermo Scientific and MultiQuant from AB Sciex for their TSQ and QTRAP mass spectrometers, and the open source software includes Skyline502 and MRMer.818 Methods such as SISCAPA (Stable Isotope Standards and Capture by Anti-Peptide Antibodies) and PRISM (high-pressure, high-resolution separations coupled with intelligent selection and multiplexing) have been introduced as alternative versions of MRMs. SISCAPA819–820 uses a combination of bead-based affinity co-capture of native and SIS peptides, and their relative amounts are quantified by MRM-MS. SISCAPA has been shown to increase the sensitivity of MRM-MS by 1,800 and 18,000-fold for selected tryptic peptides of alpha(1)-antichymotrypsin and lipopolysaccharide-binding protein, respectively. 821 Recently, a group developed an antibody-free strategy that involves PRISM for sensitive SRM-based targeted protein quantification. This approach demonstrated accurate and reproducible quantification of proteins at concentrations in the 50–100 pg/mL range in human plasma/serum.822 Prospects
Figure 14.
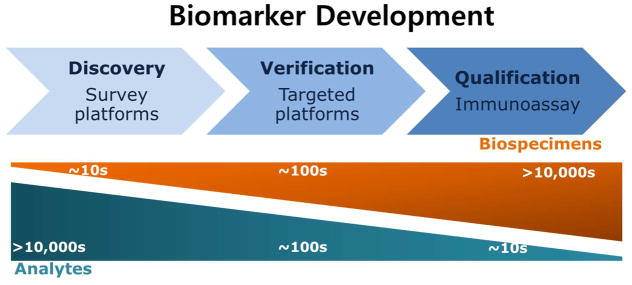
Steps of biomarker development
Despite the discovery of many new potential markers using proteomics, only a few biomarkers have been developed into clinical applications for disease screening and patient monitoring and approved by the FDA.823 OVA1, the first biomarker identified through proteomics, has recently been approved by the US FDA. OVA1 uses the in vitro diagnostic multivariate index assay (IVDMIA), which includes five biomarkers for assessment of ovarian cancer risk in women diagnosed with ovarian tumors prior to a planned surgery. The experience with development of the first FDA-cleared biomarker has demonstrated that the path from discovery, validation, to clinical use of a biomarker is long and arduous and that proper study design and development of assays that employ robust analytical methods suitable for large-scale validation are needed. Recent advances in MS-based proteomics technology with sensitive and accurate MS technology, innovative bioinformatics, and MRM methods will support each step in biomarker development, from discovery to clinical application.
7 Perspectives
Mass spectrometry-based methods to analyze and identify proteins are clearly a powerful approach to study biology. Initial uses of the technology simply involved common experiments such as analyzing proteins separated by gel electrophoresis. These experiments quickly evolved into approaches to directly identify proteins in complexes and then new types of experiments were developed such as methods to identify the topology of proteins embedded in lipid bilayers. As a powerful ‘hypothesis-generating engine’,19 shotgun proteomics has shed light on many different biological processes. Large-scale studies, including both protein expression and PTM characterizations enable us to have a systematic picture of all the expressed proteins in biological networks. Additionally, targeted studies are gaining use as a way to answer specific biological questions using MS-based technology. Mass spectrometry complements traditional biochemistry and molecular biology techniques for both biological discovery and validation and its role in biology has dramatically expanded.
Beyond the initial biological experiment the shotgun proteomic process consists of 4 steps and it is at each step where improvements in technology or methodology can be realized to improve the overall process. As shotgun proteomics requires the digestion of complex mixtures of proteins, the proteolysis of proteins is a crucial first step of the process. The success of a shotgun analysis is thus dependent on efficient and complete digestion of proteins as this can lead to high sequence coverage. Not surprisingly there have been several studies to optimize the process and to improve the analysis of recalcitrant proteins such as membrane proteins.824 Membrane proteins are a class of proteins that can be difficult to digest because most of the protein is embedded in a lipid bilayer. This attribute of membrane proteins has been exploited by Blackler et al to better identify membrane proteins.825 Proteinase K is used to digest exposed protein regions in the lipid bilayer and peripheral membrane proteins. Once the digestion is complete the solution is centrifuged to remove peptides from the solution. The transmembrane regions of the membrane proteins precipitate with the lipid bilayer. These polypeptides are then digested with cyanogen bromide since many of these regions have methionine located in these segments. As these peptides are often hydrophobic, Blackler and Wu showed much improved separation and recovery of these peptides by using liquid chromatography at elevated temperature.184 The interesting aspect of this method was the improved specificity for detection of membrane proteins, which can be difficult to achieve as proteins can stick to the lipid bilayer or get denatured during the cell lysis procedure. Methods have also appeared to improve the digestion of proteins or to preferentially digest and deplete proteins based on abundance.65,81 The state of sample preparation is good, but there can always be improvements especially on methods to improve digestion of low abundance proteins.
A critical function of peptide separations is to reduce ion suppression, increase dynamic range, and minimize isobaric interferences. The digestion of whole cell lysates can potentially produce 100,000’s of peptides over a wide range of abundances, isoelectric points, and hydrophobicities. These peptide mixtures need to be separated to avoid the simultaneous introduction of large numbers of peptides into the mass spectrometer, which would compromise dynamic range and recovery by suppressing the ionization of peptides. To this end, much emphasis has been placed on creating separation strategies to fractionate complex mixtures of peptides. Most strategies combine different separation techniques together to create multidimensional methods although reversed-phase HPLC is generally the method used to introduce peptides into the mass spectrometer. Offline strategies of gel electrophoresis, isoelectric focusing, chromatofocusing and HPLC have been used at the protein level to reduce the complexity of protein mixtures. Isoelectric focusing and ion exchange methods have been employed to prefractionate peptides in an offline manner. Ion exchange has been combined with reversed-phase HPLC to effect multidimensional separations both online and offline. While efforts to push single dimension separations to achieve sufficient resolution and peak capacity to resolve 100,000’s of peptides are underway, they are unlikely to achieve the peak capacity of multidimensional separations.
Despite the maturity of mass analyzers the last decade has seen significant innovation. Time-of-Flight mass analyzers have continued to evolve in terms of resolution and scan speed. MALDI-ToF methods have seen a drop in use in proteomics in favor of tandem MS methods in which the ToF is often combined with quadrupole mass filters. The last decade saw significant innovations in the development of the linear ion trap, which increased the ion capacity of ion traps and improved performance. The big innovation for proteomics was the optimization and development of the Orbitrap mass spectrometer.241,826 While this device has been around for many years, it took the invention of methods to inject ions into the device and the development of Fourier transform methods to record ion currents to create a powerful high resolution, high mass accuracy mass analyzer. The other older mass analyzer experiencing a renaissance was the ion mobility device.827 Ion mobility separates by both m/z and molecular shape and thus can be useful to provide a separation method prior to mass analysis. It is potentially a good strategy to fractionate ion populations using a gas phase method prior to tandem mass spectrometry of individual ions. A clear advantage to doing this by ion mobility is the much faster time frames for ion separation versus chromatographic methods, but fractionation of the ion population has to occur with reasonable resolution to minimize ion dilution. Ultimately, tandem mass spectrometers should be able to completely sample the population of peptide ions in a reasonable amount of time.
An essential component of shotgun proteomics is software to interpret the data. The basic framework for large-scale analysis of tandem mass spectrometry data is completed. Software tools are available, efficient and reasonably accurate for the analysis of shotgun proteomic data.543 There is concern that some tools over-fit data or use filtering criteria that don’t meet community standards, but in general results are excellent when community standards are followed.44,828 Additional capabilities will derive from software tools that aid in the identification of mutations, de novo analysis, and the identification of heavily modified peptides. As dissociation methods are better able to fragment larger polypeptides, tools to dissect out the combinations and patterns of modifications will improve. Software tools for the analysis of quantitative data are improving and many tools are able to analyze most of the different quantitative strategies that have been developed. An area that will see more activity is data-independent acquisition (DIA).233,829 As detection limits improve in mass spectrometers it is increasingly difficult to cleanly isolate and fragment a unique peptide ion (isobaric interferences) and consequently methods have been developed to acquire multiple precursor ions simultaneously for fragmentation. Software tools to deconvolute and analyze the data have been developed, but more tools are needed especially as people innovate with new methods and experiments for DIA.
As mass spectrometers have improved for the analysis of intact proteins, increasingly shotgun proteomics will be combined with “top down” analysis to develop a more complete picture of the proteoforms for a protein. The dissociation methods such as ETD and ECD will allow the fragmentation of larger polypeptides, which can fill the middle space between bottom up and top down. In the past decade, the development of mass spectrometers designed for peptide/protein complex analysis has advanced rapidly, mostly in mass accuracy and sensitivity. However, there is still room for further improvement. Deep proteome discovery will require enhanced signal sensitivity for low abundant peptides in samples with large dynamic ranges. Direct detection of large or modified peptides/proteins will require innovations in fragmentation and ionization methods to improve spectra quality. In addition to improvements to the mass spectrometer, advances in the techniques involved in sample preparation, fractionation, or enrichment prior to MS and data processing after MS will also enhance the role of proteomics in biology.
Acknowledgments
We gratefully thank Claire Delahunty and Xuemei Han for their critical review of this manuscript and constructive comments and suggestions. Funding was provided by the following NIH grants P41 GM103533/P41 RR011823, R01 DK074798, R01 HL079442, and R01 MH067880.
9 Abbreviations
- 2D-PAGE
two dimensional polyacrylamide gel electrophoresis
- APEX
absolute protein expression
- AP-MS
affinity purification and mass spectrometry
- AQUA
absolute quantification
- BD
binding domain
- CID/CAD
collision-induced/assisted dissociation
- CID
collision-induced dissociation
- DDA
data-dependent analysis
- DIA
data-independent analysis
- DIGE
difference gel electrophoresis
- ECD
electron capture dissociation
- ESI
electrospray ionization
- ETcaD
ETD with supplementary CID fragmentation
- ETD
electron transfer dissociation
- ETnoD
non-dissociative electron transfer
- FDR
false discovery rate
- FT-ICR
fourier transform ion cyclotron resonance
- HAP
hydroxyapatite
- HCD
higher-energy collisional dissociation
- HILIC
hydrophilic interaction liquid chromatography
- IAA
iodoacetamide
- ICAT
isotope-coded affinity tag
- ICPL
isotope-coded protein label
- IEF
isoelectric focusing
- IMAC
ion affinity chromatography
- IPG
immobilized pH gradient
- iTRAQ
isobaric tags for relative and absolute quantitation
- LC-MS
liquid chromatography-mass spectrometry
- MRM
multiple reaction monitoring
- MudPIT
Multidimensional protein identification technology
- nLC
nanoflow liquid chromatography
- NMR
nuclear magnetic resonance
- PQD
pulsed Q dissociation
- PSAQ
intact isotope labeled protein standard absolute quantification
- PSM
peptide spectrum match
- PTMs
post-translational modifications
- Q
quadrupole
- QQQ
triple quadrupole
- RIA
relative isotope abundance
- SCX
strong-cation exchange
- SILAC
stable isotope labeling with amino acids in cell culture
- SILAM
stable isotope labeling of amino acids in mammals
- SRM
selected reaction monitoring
- TAP
tandem affinity purification
- TEV
tobacco etch virus
- TF
transcription factors
- TMT
tandem mass tag
- ToF
time of flight
- Ub
ubiquitin
- UBDs
Ub binding domains
- UBLs
ubiquitin-like proteins
- UPLC
ultrahigh pressure liquid chromatography
- WAX
weak anion exchange
- WGA
wheat germ agglutinin
- Y2H
yeast two-hybrid
Biographies
Author Photos and Biographies.

Yaoyang Zhang was born in Zhengzhou, a city in central China, in 1981. Yaoyang completed his bachelor and master degrees from Beijing Institute of Technology in 2006, under supervision of Professor Yulin Deng. He then spent four years at Max-Planck Institute of Psychiatry in Munich with Professor Christoph W. Turck, and obtained his Ph.D. in 2010. Yaoyang joined the Yates lab as a research associate at The Scripps Research Institute in 2011. His research interests include using mass spectrometry in quantitative proteomics, protein-protein interaction studies, detection of protein post-translational modifications, and protein turnover analysis.

Bryan R. Fonslow studied chemistry (B.S.) at Michigan Technological University. He then received his Ph.D. in analytical chemistry from the University of Minnesota where he worked with Professor Michael T. Bowser developing micro free-flow electrophoresis for bioanalytical separations and assays. His interest in applying mass spectrometry to bioanalytical separations led him to a postdoctoral position in the Yates lab at The Scripps Research Institute. His current work focuses on applying capillary separations and mass spectrometry to the analysis of protein complexes and post-translational modifications involved in the biology of aging.

Bing Shan was born in China in 1981. She obtained her Ph.D. in biology from University of Munich in 2010, and then joined in the Yates lab as a postdoctoral fellow at the Scripps Research Institute in 2011. Currently she focuses on proteomic studies in heart and neurodegenerative diseases.

Moon-Chang Baek received a Ph.D. in Pharmacy at Seoul National University in 1997 and has held postdoctoral fellow positions in the Department of Biological Chemistry and Molecular Pharmacology at Harvard Medical School (1998–2002) as well as in the Department of Life Science at POSTECH (2002–2005). During the periods, he has studied on traditional proteomics using various mass spectrometries and also developed a fusion technology bridging between cell biology and proteomics. He is currently an associate professor at School of Medicine of Kyungpook National University, Korea and has focused on the identification of biomarker candidates for kidney diseases, drug-induced liver injury, and cancer diseases by developing various proteomics technologies including glycoproteomics, membrane proteomics as well as enrichment technologies for clinic specimen (especially microvesicles) analysis.

Dr. Yates is a Professor in the Department of Chemical Physiology at The Scripps Research Institute. His research interests include development of integrated methods for tandem mass spectrometry analysis of protein mixtures, bioinformatics using mass spectrometry data, and biological studies involving proteomics. He is the lead inventor of the SEQUEST software for correlating tandem mass spectrometry data to sequences in the database and principle developer of the shotgun proteomics technique for the analysis of protein mixtures. His laboratory has developed the use of proteomic techniques to analyze protein complexes, posttranslational modifications, organelles and quantitative analysis of protein expression for the discovery of new biology. Many proteomic approaches developed by Yates have become a national and international resource to many investigators in the scientific community. Dr. Yates led an NIDCR funded Center to characterize the Saliva proteome and has been involved in an NCRR funded Research Resource Center for the last 15 years and was involved in an NSF funded Science and Technology Center for 10 years. He has received the American Society for Mass Spectrometry research award, the Pehr Edman Award in Protein Chemistry, the American Society for Mass Spectrometry Biemann Medal, the HUPO Distinguished Achievement Award in Proteomics, Herbert Sober Award from the ASBMB, and the Christian Anfinsen Award from The Protein Society. He has published 580 scientific articles.
Contributor Information
Yaoyang Zhang, Email: zhangyy@scripps.edu.
Bryan R. Fonslow, Email: fonslow@scripps.edu.
Bing Shan, Email: bingshan@scripps.edu.
Moon-Chang Baek, Email: mcbaek@scripps.edu.
References
- 1.Lander ES, Linton LM, Birren B, Nusbaum C, Zody MC, Baldwin J, Devon K, Dewar K, Doyle M, FitzHugh W, Funke R, Gage D, Harris K, Heaford A, Howland J, Kann L, Lehoczky J, LeVine R, McEwan P, McKernan K, Meldrim J, Mesirov JP, Miranda C, Morris W, Naylor J, Raymond C, Rosetti M, Santos R, Sheridan A, Sougnez C, Stange-Thomann N, Stojanovic N, Subramanian A, Wyman D, Rogers J, Sulston J, Ainscough R, Beck S, Bentley D, Burton J, Clee C, Carter N, Coulson A, Deadman R, Deloukas P, Dunham A, Dunham I, Durbin R, French L, Grafham D, Gregory S, Hubbard T, Humphray S, Hunt A, Jones M, Lloyd C, McMurray A, Matthews L, Mercer S, Milne S, Mullikin JC, Mungall A, Plumb R, Ross M, Shownkeen R, Sims S, Waterston RH, Wilson RK, Hillier LW, McPherson JD, Marra MA, Mardis ER, Fulton LA, Chinwalla AT, Pepin KH, Gish WR, Chissoe SL, Wendl MC, Delehaunty KD, Miner TL, Delehaunty A, Kramer JB, Cook LL, Fulton RS, Johnson DL, Minx PJ, Clifton SW, Hawkins T, Branscomb E, Predki P, Richardson P, Wenning S, Slezak T, Doggett N, Cheng JF, Olsen A, Lucas S, Elkin C, Uberbacher E, Frazier M. Nature. 2001;409:860. [Google Scholar]
- 2.Venter JC, Adams MD, Myers EW, Li PW, Mural RJ, Sutton GG, Smith HO, Yandell M, Evans CA, Holt RA, Gocayne JD, Amanatides P, Ballew RM, Huson DH, Wortman JR, Zhang Q, Kodira CD, Zheng XH, Chen L, Skupski M, Subramanian G, Thomas PD, Zhang J, Gabor Miklos GL, Nelson C, Broder S, Clark AG, Nadeau J, McKusick VA, Zinder N, Levine AJ, Roberts RJ, Simon M, Slayman C, Hunkapiller M, Bolanos R, Delcher A, Dew I, Fasulo D, Flanigan M, Florea L, Halpern A, Hannenhalli S, Kravitz S, Levy S, Mobarry C, Reinert K, Remington K, Abu-Threideh J, Beasley E, Biddick K, Bonazzi V, Brandon R, Cargill M, Chandramouliswaran I, Charlab R, Chaturvedi K, Deng Z, Di Francesco V, Dunn P, Eilbeck K, Evangelista C, Gabrielian AE, Gan W, Ge W, Gong F, Gu Z, Guan P, Heiman TJ, Higgins ME, Ji RR, Ke Z, Ketchum KA, Lai Z, Lei Y, Li Z, Li J, Liang Y, Lin X, Lu F, Merkulov GV, Milshina N, Moore HM, Naik AK, Narayan VA, Neelam B, Nusskern D, Rusch DB, Salzberg S, Shao W, Shue B, Sun J, Wang Z, Wang A, Wang X, Wang J, Wei M, Wides R, Xiao C, Yan C. Science. 2001;291:1304. [Google Scholar]
- 3.Wilkins MR, Pasquali C, Appel RD, Ou K, Golaz O, Sanchez JC, Yan JX, Gooley AA, Hughes G, Humphery-Smith I, Williams KL, Hochstrasser DF. Biotechnology (N Y) 1996;14:61. doi: 10.1038/nbt0196-61. [DOI] [PubMed] [Google Scholar]
- 4.James P. Q Rev Biophys. 1997;30:279. doi: 10.1017/s0033583597003399. [DOI] [PubMed] [Google Scholar]
- 5.Gstaiger M, Aebersold R. Nat Rev Genet. 2009;10:617. doi: 10.1038/nrg2633. [DOI] [PubMed] [Google Scholar]
- 6.Makarov A, Denisov E, Kholomeev A, Balschun W, Lange O, Strupat K, Horning S. Anal Chem. 2006;78:2113. doi: 10.1021/ac0518811. [DOI] [PubMed] [Google Scholar]
- 7.Makarov A. Anal Chem. 2000;72:1156. doi: 10.1021/ac991131p. [DOI] [PubMed] [Google Scholar]
- 8.Wolters DA, Washburn MP, Yates JR., 3rd Anal Chem. 2001;73:5683. doi: 10.1021/ac010617e. [DOI] [PubMed] [Google Scholar]
- 9.Yates JR., 3rd Annu Rev Biophys Biomol Struct. 2004;33:297. doi: 10.1146/annurev.biophys.33.111502.082538. [DOI] [PubMed] [Google Scholar]
- 10.Link AJ, Eng J, Schieltz DM, Carmack E, Mize GJ, Morris DR, Garvik BM, Yates JR., 3rd Nat Biotechnol. 1999;17:676. doi: 10.1038/10890. [DOI] [PubMed] [Google Scholar]
- 11.Yates JR., 3rd J Mass Spectrom. 1998;33:1. doi: 10.1002/(SICI)1096-9888(199801)33:1<1::AID-JMS624>3.0.CO;2-9. [DOI] [PubMed] [Google Scholar]
- 12.Han X, Jin M, Breuker K, McLafferty FW. Science. 2006;314:109. doi: 10.1126/science.1128868. [DOI] [PubMed] [Google Scholar]
- 13.Tran JC, Zamdborg L, Ahlf DR, Lee JE, Catherman AD, Durbin KR, Tipton JD, Vellaichamy A, Kellie JF, Li M, Wu C, Sweet SM, Early BP, Siuti N, LeDuc RD, Compton PD, Thomas PM, Kelleher NL. Nature. 2011;480:254. doi: 10.1038/nature10575. [DOI] [PMC free article] [PubMed] [Google Scholar]
- 14.Wu C, Tran JC, Zamdborg L, Durbin KR, Li M, Ahlf DR, Early BP, Thomas PM, Sweedler JV, Kelleher NL. Nat Methods. 2012;9:822. doi: 10.1038/nmeth.2074. [DOI] [PMC free article] [PubMed] [Google Scholar]
- 15.Yates JR. Nat Methods. 2011;8:633. [Google Scholar]
- 16.Ong SE, Mann M. Nat Chem Biol. 2005;1:252. doi: 10.1038/nchembio736. [DOI] [PubMed] [Google Scholar]
- 17.Aebersold R, Mann M. Nature. 2003;422:198. doi: 10.1038/nature01511. [DOI] [PubMed] [Google Scholar]
- 18.McDonald WH, Yates JR., 3rd Curr Opin Mol Ther. 2003;5:302. [PubMed] [Google Scholar]
- 19.Cravatt BF, Simon GM, Yates JR., 3rd Nature. 2007;450:991. doi: 10.1038/nature06525. [DOI] [PubMed] [Google Scholar]
- 20.Han X, Aslanian A, Yates JR., 3rd Curr Opin Chem Biol. 2008;12:483. doi: 10.1016/j.cbpa.2008.07.024. [DOI] [PMC free article] [PubMed] [Google Scholar]
- 21.Yates JR, Ruse CI, Nakorchevsky A. Annu Rev Biomed Eng. 2009;11:49. doi: 10.1146/annurev-bioeng-061008-124934. [DOI] [PubMed] [Google Scholar]
- 22.Ahrens CH, Brunner E, Qeli E, Basler K, Aebersold R. Nat Rev Mol Cell Biol. 2010;11:789. doi: 10.1038/nrm2973. [DOI] [PubMed] [Google Scholar]
- 23.Choudhary C, Mann M. Nat Rev Mol Cell Biol. 2010;11:427. doi: 10.1038/nrm2900. [DOI] [PubMed] [Google Scholar]
- 24.Britton LM, Gonzales-Cope M, Zee BM, Garcia BA. Expert Rev Proteomics. 2011;8:631. doi: 10.1586/epr.11.47. [DOI] [PMC free article] [PubMed] [Google Scholar]
- 25.Bensimon A, Heck AJ, Aebersold R. Annu Rev Biochem. 2012;81:379. doi: 10.1146/annurev-biochem-072909-100424. [DOI] [PubMed] [Google Scholar]
- 26.Gingras AC, Raught B. FEBS Lett. 2012;586:2723. doi: 10.1016/j.febslet.2012.03.065. [DOI] [PMC free article] [PubMed] [Google Scholar]
- 27.Mann M, Kelleher NL. Proc Natl Acad Sci U S A. 2008;105:18132. doi: 10.1073/pnas.0800788105. [DOI] [PMC free article] [PubMed] [Google Scholar]
- 28.Boersema PJ, Mohammed S, Heck AJ. J Mass Spectrom. 2009;44:861. doi: 10.1002/jms.1599. [DOI] [PubMed] [Google Scholar]
- 29.Cox J, Mann M. Annu Rev Biochem. 2011;80:273. doi: 10.1146/annurev-biochem-061308-093216. [DOI] [PubMed] [Google Scholar]
- 30.Angel TE, Aryal UK, Hengel SM, Baker ES, Kelly RT, Robinson EW, Smith RD. Chem Soc Rev. 2012;41:3912. doi: 10.1039/c2cs15331a. [DOI] [PMC free article] [PubMed] [Google Scholar]
- 31.Di Palma S, Hennrich ML, Heck AJ, Mohammed S. J Proteomics. 2012;75:3791. doi: 10.1016/j.jprot.2012.04.033. [DOI] [PubMed] [Google Scholar]
- 32.Ramautar R, Heemskerk AA, Hensbergen PJ, Deelder AM, Busnel JM, Mayboroda OA. J Proteomics. 2012;75:3814. doi: 10.1016/j.jprot.2012.04.050. [DOI] [PubMed] [Google Scholar]
- 33.Stergachis AB, MacLean B, Lee K, Stamatoyannopoulos JA, MacCoss MJ. Nat Methods. 2011;8:1041. doi: 10.1038/nmeth.1770. [DOI] [PMC free article] [PubMed] [Google Scholar]
- 34.Jiang X, Ye M, Liu G, Feng S, Cui L, Zou H. J Proteome Res. 2007;6:2287. doi: 10.1021/pr070056t. [DOI] [PubMed] [Google Scholar]
- 35.Mosley AL, Florens L, Wen Z, Washburn MP. J Proteomics. 2009;72:110. doi: 10.1016/j.jprot.2008.10.008. [DOI] [PMC free article] [PubMed] [Google Scholar]
- 36.Gauci S, Veenhoff LM, Heck AJ, Krijgsveld J. J Proteome Res. 2009;8:3451. doi: 10.1021/pr9000948. [DOI] [PubMed] [Google Scholar]
- 37.Hwang SI, Lundgren DH, Mayya V, Rezaul K, Cowan AE, Eng JK, Han DK. Mol Cell Proteomics. 2006;5:1131. doi: 10.1074/mcp.M500162-MCP200. [DOI] [PubMed] [Google Scholar]
- 38.Emmott E, Rodgers MA, Macdonald A, McCrory S, Ajuh P, Hiscox JA. Mol Cell Proteomics. 2010;9:1920. doi: 10.1074/mcp.M900345-MCP200. [DOI] [PMC free article] [PubMed] [Google Scholar]
- 39.Moulder R, Lonnberg T, Elo LL, Filen JJ, Rainio E, Corthals G, Oresic M, Nyman TA, Aittokallio T, Lahesmaa R. Mol Cell Proteomics. 2010;9:1937. doi: 10.1074/mcp.M900483-MCP200. [DOI] [PMC free article] [PubMed] [Google Scholar]
- 40.Foster LJ, de Hoog CL, Zhang Y, Xie X, Mootha VK, Mann M. Cell. 2006;125:187. doi: 10.1016/j.cell.2006.03.022. [DOI] [PubMed] [Google Scholar]
- 41.Emmott E, Wise H, Loucaides EM, Matthews DA, Digard P, Hiscox JA. J Proteome Res. 2010;9:5335. doi: 10.1021/pr100593g. [DOI] [PubMed] [Google Scholar]
- 42.Li J, Cai T, Wu P, Cui Z, Chen X, Hou J, Xie Z, Xue P, Shi L, Liu P, Yates JR, 3rd, Yang F. Proteomics. 2009;9:4539. doi: 10.1002/pmic.200900101. [DOI] [PubMed] [Google Scholar]
- 43.Jiang XS, Zhou H, Zhang L, Sheng QH, Li SJ, Li L, Hao P, Li YX, Xia QC, Wu JR, Zeng R. Mol Cell Proteomics. 2004;3:441. doi: 10.1074/mcp.M300117-MCP200. [DOI] [PubMed] [Google Scholar]
- 44.Rezaul K, Wu L, Mayya V, Hwang SI, Han D. Mol Cell Proteomics. 2005;4:169. doi: 10.1074/mcp.M400115-MCP200. [DOI] [PMC free article] [PubMed] [Google Scholar]
- 45.Deng N, Zhang J, Zong C, Wang Y, Lu H, Yang P, Wang W, Young GW, Korge P, Lotz C, Doran P, Liem DA, Apweiler R, Weiss JN, Duan H, Ping P. Mol Cell Proteomics. 2011;10:M110 000117. doi: 10.1074/mcp.M110.000117. [DOI] [PMC free article] [PubMed] [Google Scholar]
- 46.Meany DL, Xie H, Thompson LV, Arriaga EA, Griffin TJ. Proteomics. 2007;7:1150. doi: 10.1002/pmic.200600450. [DOI] [PubMed] [Google Scholar]
- 47.Forner F, Foster LJ, Campanaro S, Valle G, Mann M. Mol Cell Proteomics. 2006;5:608. doi: 10.1074/mcp.M500298-MCP200. [DOI] [PubMed] [Google Scholar]
- 48.Warren CM, Geenen DL, Helseth DL, Jr, Xu H, Solaro RJ. J Proteomics. 2010;73:1551. doi: 10.1016/j.jprot.2010.03.016. [DOI] [PMC free article] [PubMed] [Google Scholar]
- 49.Li K, Hornshaw MP, van Minnen J, Smalla KH, Gundelfinger ED, Smit AB. J Proteome Res. 2005;4:725. doi: 10.1021/pr049802+. [DOI] [PubMed] [Google Scholar]
- 50.Cheng D, Hoogenraad CC, Rush J, Ramm E, Schlager MA, Duong DM, Xu P, Wijayawardana SR, Hanfelt J, Nakagawa T, Sheng M, Peng J. Mol Cell Proteomics. 2006;5:1158. doi: 10.1074/mcp.D500009-MCP200. [DOI] [PubMed] [Google Scholar]
- 51.Li KW, Miller S, Klychnikov O, Loos M, Stahl-Zeng J, Spijker S, Mayford M, Smit AB. J Proteome Res. 2007;6:3127. doi: 10.1021/pr070086w. [DOI] [PubMed] [Google Scholar]
- 52.McClatchy DB, Liao L, Park SK, Venable JD, Yates JR. Genome Res. 2007;17:1378. doi: 10.1101/gr.6375007. [DOI] [PMC free article] [PubMed] [Google Scholar]
- 53.McClatchy DB, Liao L, Lee JH, Park SK, Yates JR., 3rd J Proteome Res. 2012;11:2467. doi: 10.1021/pr201176v. [DOI] [PMC free article] [PubMed] [Google Scholar]
- 54.Munton RP, Tweedie-Cullen R, Livingstone-Zatchej M, Weinandy F, Waidelich M, Longo D, Gehrig P, Potthast F, Rutishauser D, Gerrits B, Panse C, Schlapbach R, Mansuy IM. Mol Cell Proteomics. 2007;6:283. doi: 10.1074/mcp.M600046-MCP200. [DOI] [PubMed] [Google Scholar]
- 55.Anderson NL, Anderson NG. Mol Cell Proteomics. 2002;1:845. doi: 10.1074/mcp.r200007-mcp200. [DOI] [PubMed] [Google Scholar]
- 56.Colantonio DA, Dunkinson C, Bovenkamp DE, Van Eyk JE. Proteomics. 2005;5:3831. doi: 10.1002/pmic.200401235. [DOI] [PubMed] [Google Scholar]
- 57.Kay R, Barton C, Ratcliffe L, Matharoo-Ball B, Brown P, Roberts J, Teale P, Creaser C. Rapid Commun Mass Spectrom. 2008;22:3255. doi: 10.1002/rcm.3729. [DOI] [PubMed] [Google Scholar]
- 58.Warder SE, Tucker LA, Strelitzer TJ, McKeegan EM, Meuth JL, Jung PM, Saraf A, Singh B, Lai-Zhang J, Gagne G, Rogers JC. Anal Biochem. 2009;387:184. doi: 10.1016/j.ab.2009.01.013. [DOI] [PubMed] [Google Scholar]
- 59.Mahn A, Ismail M. J Chromatogr B Analyt Technol Biomed Life Sci. 2011;879:3645. doi: 10.1016/j.jchromb.2011.09.024. [DOI] [PubMed] [Google Scholar]
- 60.Pieper R, Su Q, Gatlin CL, Huang ST, Anderson NL, Steiner S. Proteomics. 2003;3:422. doi: 10.1002/pmic.200390057. [DOI] [PubMed] [Google Scholar]
- 61.Tu C, Rudnick PA, Martinez MY, Cheek KL, Stein SE, Slebos RJ, Liebler DC. J Proteome Res. 2010;9:4982. doi: 10.1021/pr100646w. [DOI] [PMC free article] [PubMed] [Google Scholar]
- 62.Thulasiraman V, Lin S, Gheorghiu L, Lathrop J, Lomas L, Hammond D, Boschetti E. Electrophoresis. 2005;26:3561. doi: 10.1002/elps.200500147. [DOI] [PubMed] [Google Scholar]
- 63.Li L, Sun C, Freeby S, Yee D, Kieffer-Jaquinod S, Guerrier L, Boschetti E, Lomas L. J Proteomics Bioinform. 2009;2:485. [Google Scholar]
- 64.Fonslow BR, Carvalho PC, Academia K, Freeby S, Xu T, Nakorchevsky A, Paulus A, Yates JR., 3rd J Proteome Res. 2011;10:3690. doi: 10.1021/pr200304u. [DOI] [PMC free article] [PubMed] [Google Scholar]
- 65.Fonslow BR, Stein BD, Webb KJ, Xu T, Choi J, Park SK, Yates JR., 3rd Nat Methods. 2013;10:54. doi: 10.1038/nmeth.2250. [DOI] [PMC free article] [PubMed] [Google Scholar]
- 66.Keil B. Specificity of proteolysis. Springer-Verlag; Berlin ; New York: 1992. [Google Scholar]
- 67.Siepen JA, Keevil EJ, Knight D, Hubbard SJ. J Proteome Res. 2007;6:399. doi: 10.1021/pr060507u. [DOI] [PMC free article] [PubMed] [Google Scholar]
- 68.Thiede B, Lamer S, Mattow J, Siejak F, Dimmler C, Rudel T, Jungblut PR. Rapid Commun Mass Spectrom. 2000;14:496. doi: 10.1002/(SICI)1097-0231(20000331)14:6<496::AID-RCM899>3.0.CO;2-1. [DOI] [PubMed] [Google Scholar]
- 69.MacCoss MJ, McDonald WH, Saraf A, Sadygov R, Clark JM, Tasto JJ, Gould KL, Wolters D, Washburn M, Weiss A, Clark JI, Yates JR., 3rd Proc Natl Acad Sci U S A. 2002;99:7900. doi: 10.1073/pnas.122231399. [DOI] [PMC free article] [PubMed] [Google Scholar]
- 70.Xu T, Wong CC, Kashina A, Yates JR., 3rd Nat Protoc. 2009;4:325. doi: 10.1038/nprot.2008.248. [DOI] [PMC free article] [PubMed] [Google Scholar]
- 71.Choudhary G, Wu SL, Shieh P, Hancock WS. J Proteome Res. 2003;2:59. doi: 10.1021/pr025557n. [DOI] [PubMed] [Google Scholar]
- 72.Swaney DL, Wenger CD, Coon JJ. J Proteome Res. 2010;9:1323. doi: 10.1021/pr900863u. [DOI] [PMC free article] [PubMed] [Google Scholar]
- 73.Klammer AA, MacCoss MJ. J Proteome Res. 2006;5:695. doi: 10.1021/pr050315j. [DOI] [PMC free article] [PubMed] [Google Scholar]
- 74.Tran BQ, Hernandez C, Waridel P, Potts A, Barblan J, Lisacek F, Quadroni M. J Proteome Res. 2011;10:800. doi: 10.1021/pr100951t. [DOI] [PubMed] [Google Scholar]
- 75.Bian Y, Ye M, Song C, Cheng K, Wang C, Wei X, Zhu J, Chen R, Wang F, Zou H. J Proteome Res. 2012;11:2828. doi: 10.1021/pr300242w. [DOI] [PubMed] [Google Scholar]
- 76.Gilmore JM, Kettenbach AN, Gerber SA. Anal Bioanal Chem. 2012;402:711. doi: 10.1007/s00216-011-5466-5. [DOI] [PMC free article] [PubMed] [Google Scholar]
- 77.Gauci S, Helbig AO, Slijper M, Krijgsveld J, Heck AJ, Mohammed S. Anal Chem. 2009;81:4493. doi: 10.1021/ac9004309. [DOI] [PubMed] [Google Scholar]
- 78.Strader MB, Tabb DL, Hervey WJ, Pan C, Hurst GB. Anal Chem. 2006;78:125. doi: 10.1021/ac051348l. [DOI] [PubMed] [Google Scholar]
- 79.Hervey WJt, Strader MB, Hurst GB. J Proteome Res. 2007;6:3054. doi: 10.1021/pr070159b. [DOI] [PubMed] [Google Scholar]
- 80.Chen EI, Cociorva D, Norris JL, Yates JR., 3rd J Proteome Res. 2007;6:2529. doi: 10.1021/pr060682a. [DOI] [PMC free article] [PubMed] [Google Scholar]
- 81.Manza LL, Stamer SL, Ham AJ, Codreanu SG, Liebler DC. Proteomics. 2005;5:1742. doi: 10.1002/pmic.200401063. [DOI] [PubMed] [Google Scholar]
- 82.Wisniewski JR, Zougman A, Nagaraj N, Mann M. Nat Methods. 2009;6:359. doi: 10.1038/nmeth.1322. [DOI] [PubMed] [Google Scholar]
- 83.Zhou JY, Dann GP, Shi T, Wang L, Gao X, Su D, Nicora CD, Shukla AK, Moore RJ, Liu T, Camp DG, 2nd, Smith RD, Qian WJ. Anal Chem. 2012;84:2862. doi: 10.1021/ac203394r. [DOI] [PMC free article] [PubMed] [Google Scholar]
- 84.Chen EI, McClatchy D, Park SK, Yates JR., 3rd Anal Chem. 2008;80:8694. doi: 10.1021/ac800606w. [DOI] [PMC free article] [PubMed] [Google Scholar]
- 85.Kadiyala CS, Tomechko SE, Miyagi M. PLoS One. 2010;5:e15332. doi: 10.1371/journal.pone.0015332. [DOI] [PMC free article] [PubMed] [Google Scholar]
- 86.Sun L, Tao D, Han B, Ma J, Zhu G, Liang Z, Shan Y, Zhang L, Zhang Y. Anal Bioanal Chem. 2011;399:3387. doi: 10.1007/s00216-010-4381-5. [DOI] [PubMed] [Google Scholar]
- 87.Wang H, Qian WJ, Mottaz HM, Clauss TR, Anderson DJ, Moore RJ, Camp DG, 2nd, Khan AH, Sforza DM, Pallavicini M, Smith DJ, Smith RD. J Proteome Res. 2005;4:2397. doi: 10.1021/pr050160f. [DOI] [PMC free article] [PubMed] [Google Scholar]
- 88.Wang N, Xu M, Wang P, Li L. Anal Chem. 2010;82:2262. doi: 10.1021/ac9023022. [DOI] [PubMed] [Google Scholar]
- 89.Chatterjee D, Ytterberg AJ, Son SU, Loo JA, Garrell RL. Anal Chem. 2010;82:2095. doi: 10.1021/ac9029373. [DOI] [PubMed] [Google Scholar]
- 90.Moon H, Wheeler AR, Garrell RL, Loo JA, Kim CJ. Lab Chip. 2006;6:1213. doi: 10.1039/b601954d. [DOI] [PubMed] [Google Scholar]
- 91.Nelson WC, Peng I, Lee GA, Loo JA, Garrell RL, Kim CJ. Anal Chem. 2010;82:9932. doi: 10.1021/ac101833b. [DOI] [PMC free article] [PubMed] [Google Scholar]
- 92.Wheeler AR, Moon H, Bird CA, Loo RR, Kim CJ, Loo JA, Garrell RL. Anal Chem. 2005;77:534. doi: 10.1021/ac048754+. [DOI] [PubMed] [Google Scholar]
- 93.Wheeler AR, Moon H, Kim CJ, Loo JA, Garrell RL. Anal Chem. 2004;76:4833. doi: 10.1021/ac0498112. [DOI] [PubMed] [Google Scholar]
- 94.Freije JR, Mulder PP, Werkman W, Rieux L, Niederlander HA, Verpoorte E, Bischoff R. J Proteome Res. 2005;4:1805. doi: 10.1021/pr050142y. [DOI] [PubMed] [Google Scholar]
- 95.Ethier M, Hou W, Duewel HS, Figeys D. J Proteome Res. 2006;5:2754. doi: 10.1021/pr060312m. [DOI] [PubMed] [Google Scholar]
- 96.Guo W, Bi H, Qiao L, Wan J, Qian K, Girault HH, Liu B. Mol Biosyst. 2011;7:2890. doi: 10.1039/c1mb05140g. [DOI] [PubMed] [Google Scholar]
- 97.Qin W, Song Z, Fan C, Zhang W, Cai Y, Zhang Y, Qian X. Anal Chem. 2012;84:3138. doi: 10.1021/ac2029216. [DOI] [PubMed] [Google Scholar]
- 98.Lopez-Ferrer D, Capelo JL, Vazquez J. J Proteome Res. 2005;4:1569. doi: 10.1021/pr050112v. [DOI] [PubMed] [Google Scholar]
- 99.Lopez-Ferrer D, Heibeck TH, Petritis K, Hixson KK, Qian W, Monroe ME, Mayampurath A, Moore RJ, Belov ME, Camp DG, 2nd, Smith RD. J Proteome Res. 2008;7:3860. doi: 10.1021/pr800161x. [DOI] [PMC free article] [PubMed] [Google Scholar]
- 100.Sun W, Gao S, Wang L, Chen Y, Wu S, Wang X, Zheng D, Gao Y. Mol Cell Proteomics. 2006;5:769. doi: 10.1074/mcp.T500022-MCP200. [DOI] [PubMed] [Google Scholar]
- 101.Segu ZM, Hammad LA, Mechref Y. Rapid Commun Mass Spectrom. 2010;24:3461. doi: 10.1002/rcm.4774. [DOI] [PubMed] [Google Scholar]
- 102.Ye X, Li L. Anal Chem. 2012;84:6181. doi: 10.1021/ac301169q. [DOI] [PubMed] [Google Scholar]
- 103.Ye X, Li L. Anal Chem. 2012;84:6181. doi: 10.1021/ac301169q. [DOI] [PubMed] [Google Scholar]
- 104.Lin S, Yao G, Qi D, Li Y, Deng C, Yang P, Zhang X. Anal Chem. 2008;80:3655. doi: 10.1021/ac800023r. [DOI] [PubMed] [Google Scholar]
- 105.Chen WY, Chen YC. Anal Chem. 2007;79:2394. doi: 10.1021/ac0614893. [DOI] [PubMed] [Google Scholar]
- 106.Swatkoski S, Gutierrez P, Ginter J, Petrov A, Dinman JD, Edwards N, Fenselau C. J Proteome Res. 2007;6:4525. doi: 10.1021/pr0704682. [DOI] [PubMed] [Google Scholar]
- 107.Basile F, Hauser N. Anal Chem. 2011;83:359. doi: 10.1021/ac1024705. [DOI] [PMC free article] [PubMed] [Google Scholar]
- 108.Lee AM, Sevinsky JR, Bundy JL, Grunden AM, Stephenson JL., Jr J Proteome Res. 2009;8:3844. doi: 10.1021/pr801119h. [DOI] [PubMed] [Google Scholar]
- 109.Lopez-Ferrer D, Petritis K, Hixson KK, Heibeck TH, Moore RJ, Belov ME, Camp DG, 2nd, Smith RD. J Proteome Res. 2008;7:3276. doi: 10.1021/pr7008077. [DOI] [PMC free article] [PubMed] [Google Scholar]
- 110.Lopez-Ferrer D, Petritis K, Lourette NM, Clowers B, Hixson KK, Heibeck T, Prior DC, Pasa-Tolic L, Camp DG, 2nd, Belov ME, Smith RD. Anal Chem. 2008;80:8930. doi: 10.1021/ac800927v. [DOI] [PMC free article] [PubMed] [Google Scholar]
- 111.Klose J. Humangenetik. 1975;26:231. doi: 10.1007/BF00281458. [DOI] [PubMed] [Google Scholar]
- 112.O’Farrell PH. J Biol Chem. 1975;250:4007. [PMC free article] [PubMed] [Google Scholar]
- 113.Banks RE, Dunn MJ, Hochstrasser DF, Sanchez JC, Blackstock W, Pappin DJ, Selby PJ. Lancet. 2000;356:1749. doi: 10.1016/S0140-6736(00)03214-1. [DOI] [PubMed] [Google Scholar]
- 114.Perdew GH, Schaup HW, Selivonchick DP. Anal Biochem. 1983;135:453. doi: 10.1016/0003-2697(83)90711-x. [DOI] [PubMed] [Google Scholar]
- 115.Rabilloud T, Adessi C, Giraudel A, Lunardi J. Electrophoresis. 1997;18:307. doi: 10.1002/elps.1150180303. [DOI] [PMC free article] [PubMed] [Google Scholar]
- 116.Wildgruber R, Reil G, Drews O, Parlar H, Gorg A. Proteomics. 2002;2:727. doi: 10.1002/1615-9861(200206)2:6<727::AID-PROT727>3.0.CO;2-2. [DOI] [PubMed] [Google Scholar]
- 117.Ghiggeri GM, Candiano G, Delfino G, Queirolo C, Vecchio G, Gianazza E, Righetti PG. Carbohydr Res. 1985;145:113. doi: 10.1016/s0008-6215(00)90417-8. [DOI] [PubMed] [Google Scholar]
- 118.Wildgruber R, Harder A, Obermaier C, Boguth G, Weiss W, Fey SJ, Larsen PM, Gorg A. Electrophoresis. 2000;21:2610. doi: 10.1002/1522-2683(20000701)21:13<2610::AID-ELPS2610>3.0.CO;2-H. [DOI] [PubMed] [Google Scholar]
- 119.Chevalier F, Centeno D, Rofidal V, Tauzin M, Martin O, Sommerer N, Rossignol M. J Proteome Res. 2006;5:512. doi: 10.1021/pr050194n. [DOI] [PubMed] [Google Scholar]
- 120.Chevallet M, Luche S, Diemer H, Strub JM, Van Dorsselaer A, Rabilloud T. Proteomics. 2008;8:4853. doi: 10.1002/pmic.200800321. [DOI] [PubMed] [Google Scholar]
- 121.Agrawal GK, Thelen JJ. Methods Mol Biol. 2009;527:3. doi: 10.1007/978-1-60327-834-8_1. [DOI] [PubMed] [Google Scholar]
- 122.Sondej M, Denny PA, Xie Y, Ramachandran P, Si Y, Takashima J, Shi W, Wong DT, Loo JA, Denny PC. Clin Proteomics. 2009;5:52. doi: 10.1007/s12014-008-9021-0. [DOI] [PMC free article] [PubMed] [Google Scholar]
- 123.Lopez JL. J Chromatogr B Analyt Technol Biomed Life Sci. 2007;849:190. doi: 10.1016/j.jchromb.2006.11.049. [DOI] [PubMed] [Google Scholar]
- 124.Unlu M, Morgan ME, Minden JS. Electrophoresis. 1997;18:2071. doi: 10.1002/elps.1150181133. [DOI] [PubMed] [Google Scholar]
- 125.Bredemeyer AJ, Lewis RM, Malone JP, Davis AE, Gross J, Townsend RR, Ley TJ. Proc Natl Acad Sci U S A. 2004;101:11785. doi: 10.1073/pnas.0402353101. [DOI] [PMC free article] [PubMed] [Google Scholar]
- 126.Lee AY, Park BC, Jang M, Cho S, Lee DH, Lee SC, Myung PK, Park SG. Proteomics. 2004;4:3429. doi: 10.1002/pmic.200400979. [DOI] [PubMed] [Google Scholar]
- 127.Hecker M, Antelmann H, Buttner K, Bernhardt J. Proteomics. 2008;8:4958. doi: 10.1002/pmic.200800278. [DOI] [PubMed] [Google Scholar]
- 128.Mahairas GG, Sabo PJ, Hickey MJ, Singh DC, Stover CK. J Bacteriol. 1996;178:1274. doi: 10.1128/jb.178.5.1274-1282.1996. [DOI] [PMC free article] [PubMed] [Google Scholar]
- 129.Afjehi-Sadat L, Lubec G. Nat Protoc. 2007;2:2318. doi: 10.1038/nprot.2007.317. [DOI] [PubMed] [Google Scholar]
- 130.Laemmli UK. Nature. 1970;227:680. doi: 10.1038/227680a0. [DOI] [PubMed] [Google Scholar]
- 131.Shevchenko A, Wilm M, Vorm O, Mann M. Anal Chem. 1996;68:850. doi: 10.1021/ac950914h. [DOI] [PubMed] [Google Scholar]
- 132.Lundby A, Olsen JV. Methods Mol Biol. 2011;753:143. doi: 10.1007/978-1-61779-148-2_10. [DOI] [PubMed] [Google Scholar]
- 133.Michel PE, Reymond F, Arnaud IL, Josserand J, Girault HH, Rossier JS. Electrophoresis. 2003;24:3. doi: 10.1002/elps.200390030. [DOI] [PubMed] [Google Scholar]
- 134.Heller M, Michel PE, Morier P, Crettaz D, Wenz C, Tissot JD, Reymond F, Rossier JS. Electrophoresis. 2005;26:1174. doi: 10.1002/elps.200410106. [DOI] [PubMed] [Google Scholar]
- 135.Wang H, Chang-Wong T, Tang HY, Speicher DW. J Proteome Res. 2010;9:1032. doi: 10.1021/pr900927y. [DOI] [PMC free article] [PubMed] [Google Scholar]
- 136.Moritz RL, Ji H, Schutz F, Connolly LM, Kapp EA, Speed TP, Simpson RJ. Anal Chem. 2004;76:4811. doi: 10.1021/ac049717l. [DOI] [PubMed] [Google Scholar]
- 137.Moritz RL, Clippingdale AB, Kapp EA, Eddes JS, Ji H, Gilbert S, Connolly LM, Simpson RJ. Proteomics. 2005;5:3402. doi: 10.1002/pmic.200500096. [DOI] [PubMed] [Google Scholar]
- 138.Chen EI, Hewel J, Felding-Habermann B, Yates JR., 3rd Mol Cell Proteomics. 2006;5:53. doi: 10.1074/mcp.T500013-MCP200. [DOI] [PubMed] [Google Scholar]
- 139.Garbis SD, Roumeliotis TI, Tyritzis SI, Zorpas KM, Pavlakis K, Constantinides CA. Anal Chem. 2011;83:708. doi: 10.1021/ac102075d. [DOI] [PubMed] [Google Scholar]
- 140.Wang H, Clouthier SG, Galchev V, Misek DE, Duffner U, Min CK, Zhao R, Tra J, Omenn GS, Ferrara JL, Hanash SM. Mol Cell Proteomics. 2005;4:618. doi: 10.1074/mcp.M400126-MCP200. [DOI] [PubMed] [Google Scholar]
- 141.Schlautman JD, Rozek W, Stetler R, Mosley RL, Gendelman HE, Ciborowski P. Proteome Sci. 2008;6:26. doi: 10.1186/1477-5956-6-26. [DOI] [PMC free article] [PubMed] [Google Scholar]
- 142.Wilm M, Mann M. Anal Chem. 1996;68:1. doi: 10.1021/ac9509519. [DOI] [PubMed] [Google Scholar]
- 143.Hillenkamp F, Karas M. Methods Enzymol. 1990;193:280. doi: 10.1016/0076-6879(90)93420-p. [DOI] [PubMed] [Google Scholar]
- 144.Cramer R, Gobom J, Nordhoff E. Expert Rev Proteomics. 2005;2:407. doi: 10.1586/14789450.2.3.407. [DOI] [PubMed] [Google Scholar]
- 145.Ogorzalek Loo RR, Stevenson TI, Mitchell C, Loo JA, Andrews PC. Anal Chem. 1996;68:1910. doi: 10.1021/ac951223o. [DOI] [PubMed] [Google Scholar]
- 146.Ogorzalek Loo RR, Mitchell C, Stevenson TI, Martin SA, Hines WM, Juhasz P, Patterson DH, Peltier JM, Loo JA, Andrews PC. Electrophoresis. 1997;18:382. doi: 10.1002/elps.1150180312. [DOI] [PubMed] [Google Scholar]
- 147.Miliotis T, Kjellstrom S, Nilsson J, Laurell T, Edholm LE, Marko-Varga G. J Mass Spectrom. 2000;35:369. doi: 10.1002/(SICI)1096-9888(200003)35:3<369::AID-JMS944>3.0.CO;2-N. [DOI] [PubMed] [Google Scholar]
- 148.Preisler J, Hu P, Rejtar T, Karger BL. Anal Chem. 2000;72:4785. doi: 10.1021/ac0005870. [DOI] [PubMed] [Google Scholar]
- 149.Preisler J, Hu P, Rejtar T, Moskovets E, Karger BL. Anal Chem. 2002;74:17. doi: 10.1021/ac010692p. [DOI] [PubMed] [Google Scholar]
- 150.Rejtar T, Hu P, Juhasz P, Campbell JM, Vestal ML, Preisler J, Karger BL. J Proteome Res. 2002;1:171. doi: 10.1021/pr015519o. [DOI] [PubMed] [Google Scholar]
- 151.Wall DB, Berger SJ, Finch JW, Cohen SA, Richardson K, Chapman R, Drabble D, Brown J, Gostick D. Electrophoresis. 2002;23:3193. doi: 10.1002/1522-2683(200209)23:18<3193::AID-ELPS3193>3.0.CO;2-Y. [DOI] [PubMed] [Google Scholar]
- 152.Chen HS, Rejtar T, Andreev V, Moskovets E, Karger BL. Anal Chem. 2005;77:7816. doi: 10.1021/ac050956y. [DOI] [PubMed] [Google Scholar]
- 153.Zhang N, Li N, Li L. J Proteome Res. 2004;3:719. doi: 10.1021/pr034116g. [DOI] [PubMed] [Google Scholar]
- 154.Takats Z, Wiseman JM, Ifa DR, Cooks RG. CSH Protoc. 2008;2008:pdb top37. doi: 10.1101/pdb.top37. [DOI] [PubMed] [Google Scholar]
- 155.Takats Z, Wiseman JM, Ifa DR, Cooks RG. CSH Protoc. 2008;2008:pdb prot4993. doi: 10.1101/pdb.prot4993. [DOI] [PubMed] [Google Scholar]
- 156.Peng IX, Shiea J, Ogorzalek Loo RR, Loo JA. Rapid Commun Mass Spectrom. 2007;21:2541. doi: 10.1002/rcm.3154. [DOI] [PubMed] [Google Scholar]
- 157.Nayak R, Liu J, Sen AK, Knapp DR. Anal Chem. 2008;80:8840. doi: 10.1021/ac801586r. [DOI] [PubMed] [Google Scholar]
- 158.Peng IX, Ogorzalek Loo RR, Shiea J, Loo JA. Anal Chem. 2008;80:6995. doi: 10.1021/ac800870c. [DOI] [PubMed] [Google Scholar]
- 159.Trimpin S, Inutan ED, Herath TN, McEwen CN. Mol Cell Proteomics. 2010;9:362. doi: 10.1074/mcp.M900527-MCP200. [DOI] [PMC free article] [PubMed] [Google Scholar]
- 160.Qiao L, Sartor R, Gasilova N, Lu Y, Tobolkina E, Liu B, Girault HH. Anal Chem. 2012;84:7422. doi: 10.1021/ac301332k. [DOI] [PubMed] [Google Scholar]
- 161.Inutan ED, Trimpin S. Mol Cell Proteomics. 2012 doi: 10.1074/mcp.M112.023663. [DOI] [PMC free article] [PubMed] [Google Scholar]
- 162.Pagnotti VS, Chubatyi ND, McEwen CN. Anal Chem. 2011;83:3981. doi: 10.1021/ac200556z. [DOI] [PubMed] [Google Scholar]
- 163.Pagnotti VS, Inutan ED, Marshall DD, McEwen CN, Trimpin S. Anal Chem. 2011;83:7591. doi: 10.1021/ac201982r. [DOI] [PubMed] [Google Scholar]
- 164.Wang B, Inutan ED, Trimpin S. J Am Soc Mass Spectrom. 2012;23:442. doi: 10.1007/s13361-011-0320-8. [DOI] [PubMed] [Google Scholar]
- 165.Peng Y, Zhang S, Gong X, Ma X, Yang C, Zhang X. Anal Chem. 2011;83:8863. doi: 10.1021/ac2024969. [DOI] [PubMed] [Google Scholar]
- 166.Jung S, Effelsberg U, Tallarek U. Anal Chem. 2011;83:9167. doi: 10.1021/ac202413z. [DOI] [PubMed] [Google Scholar]
- 167.Cech NB, Krone JR, Enke CG. Anal Chem. 2001;73:208. doi: 10.1021/ac0006019. [DOI] [PubMed] [Google Scholar]
- 168.Kocher T, Swart R, Mechtler K. Anal Chem. 2011;83:2699. doi: 10.1021/ac103243t. [DOI] [PubMed] [Google Scholar]
- 169.Krisp C, McKay MJ, Wolters DA, Molloy MP. Anal Chem. 2012;84:1592. doi: 10.1021/ac2028485. [DOI] [PubMed] [Google Scholar]
- 170.Kulevich SE, Frey BL, Kreitinger G, Smith LM. Anal Chem. 2010;82:10135. doi: 10.1021/ac1019792. [DOI] [PMC free article] [PubMed] [Google Scholar]
- 171.Cagney G, Amiri S, Premawaradena T, Lindo M, Emili A. Proteome Sci. 2003;1:5. doi: 10.1186/1477-5956-1-5. [DOI] [PMC free article] [PubMed] [Google Scholar]
- 172.Consortium CeS. Science. 1998;282:2012. [Google Scholar]
- 173.Adams MD, Celniker SE, Holt RA, Evans CA, Gocayne JD, Amanatides PG, Scherer SE, Li PW, Hoskins RA, Galle RF, George RA, Lewis SE, Richards S, Ashburner M, Henderson SN, Sutton GG, Wortman JR, Yandell MD, Zhang Q, Chen LX, Brandon RC, Rogers YH, Blazej RG, Champe M, Pfeiffer BD, Wan KH, Doyle C, Baxter EG, Helt G, Nelson CR, Gabor GL, Abril JF, Agbayani A, An HJ, Andrews-Pfannkoch C, Baldwin D, Ballew RM, Basu A, Baxendale J, Bayraktaroglu L, Beasley EM, Beeson KY, Benos PV, Berman BP, Bhandari D, Bolshakov S, Borkova D, Botchan MR, Bouck J, Brokstein P, Brottier P, Burtis KC, Busam DA, Butler H, Cadieu E, Center A, Chandra I, Cherry JM, Cawley S, Dahlke C, Davenport LB, Davies P, de Pablos B, Delcher A, Deng Z, Mays AD, Dew I, Dietz SM, Dodson K, Doup LE, Downes M, Dugan-Rocha S, Dunkov BC, Dunn P, Durbin KJ, Evangelista CC, Ferraz C, Ferriera S, Fleischmann W, Fosler C, Gabrielian AE, Garg NS, Gelbart WM, Glasser K, Glodek A, Gong F, Gorrell JH, Gu Z, Guan P, Harris M, Harris NL, Harvey D, Heiman TJ, Hernandez JR, Houck J, Hostin D, Houston KA, Howland TJ, Wei MH, Ibegwam C. Science. 2000;287:2185. doi: 10.1126/science.287.5461.2185. [DOI] [PubMed] [Google Scholar]
- 174.Usaite R, Wohlschlegel J, Venable JD, Park SK, Nielsen J, Olsson L, Yates JR., III J Proteome Res. 2008;7:266. doi: 10.1021/pr700580m. [DOI] [PMC free article] [PubMed] [Google Scholar]
- 175.Washburn MP, Wolters D, Yates JR., 3rd Nat Biotechnol. 2001;19:242. doi: 10.1038/85686. [DOI] [PubMed] [Google Scholar]
- 176.Schrimpf SP, Weiss M, Reiter L, Ahrens CH, Jovanovic M, Malmstrom J, Brunner E, Mohanty S, Lercher MJ, Hunziker PE, Aebersold R, von Mering C, Hengartner MO. PLoS Biol. 2009;7:e48. doi: 10.1371/journal.pbio.1000048. [DOI] [PMC free article] [PubMed] [Google Scholar]
- 177.Brunner E, Ahrens CH, Mohanty S, Baetschmann H, Loevenich S, Potthast F, Deutsch EW, Panse C, de Lichtenberg U, Rinner O, Lee H, Pedrioli PG, Malmstrom J, Koehler K, Schrimpf S, Krijgsveld J, Kregenow F, Heck AJ, Hafen E, Schlapbach R, Aebersold R. Nat Biotechnol. 2007;25:576. doi: 10.1038/nbt1300. [DOI] [PubMed] [Google Scholar]
- 178.de Godoy LM, Olsen JV, Cox J, Nielsen ML, Hubner NC, Frohlich F, Walther TC, Mann M. Nature. 2008;455:1251. doi: 10.1038/nature07341. [DOI] [PubMed] [Google Scholar]
- 179.Nagaraj N, Kulak NA, Cox J, Neuhauser N, Mayr K, Hoerning O, Vorm O, Mann M. Mol Cell Proteomics. 2012;11:M111 013722. doi: 10.1074/mcp.M111.013722. [DOI] [PMC free article] [PubMed] [Google Scholar]
- 180.Gatlin CL, Eng JK, Cross ST, Detter JC, Yates JR., 3rd Anal Chem. 2000;72:757. doi: 10.1021/ac991025n. [DOI] [PubMed] [Google Scholar]
- 181.Gatlin CL, Kleemann GR, Hays LG, Link AJ, Yates JR., 3rd Anal Biochem. 1998;263:93. doi: 10.1006/abio.1998.2809. [DOI] [PubMed] [Google Scholar]
- 182.Masuda T, Sugiyama N, Tomita M, Ishihama Y. Anal Chem. 2011;83:7698. doi: 10.1021/ac201093g. [DOI] [PubMed] [Google Scholar]
- 183.Zhou F, Lu Y, Ficarro SB, Webber JT, Marto JA. Anal Chem. 2012;84:5133. doi: 10.1021/ac2031404. [DOI] [PMC free article] [PubMed] [Google Scholar]
- 184.Speers AE, Blackler AR, Wu CC. Anal Chem. 2007;79:4613. doi: 10.1021/ac0700225. [DOI] [PubMed] [Google Scholar]
- 185.Venable JD, Okach L, Agarwalla S, Brock A. Anal Chem. 2012;84:9601. doi: 10.1021/ac302488h. [DOI] [PMC free article] [PubMed] [Google Scholar]
- 186.MacNair JE, Lewis KC, Jorgenson JW. Anal Chem. 1997;69:983. doi: 10.1021/ac961094r. [DOI] [PubMed] [Google Scholar]
- 187.Motoyama A, Venable JD, Ruse CI, Yates JR., 3rd Anal Chem. 2006;78:5109. doi: 10.1021/ac060354u. [DOI] [PubMed] [Google Scholar]
- 188.Chen CJ, Chen WY, Tseng MC, Chen YR. Anal Chem. 2012;84:297. doi: 10.1021/ac202549y. [DOI] [PubMed] [Google Scholar]
- 189.Winter D, Pipkorn R, Lehmann WD. J Sep Sci. 2009;32:1111. doi: 10.1002/jssc.200800691. [DOI] [PubMed] [Google Scholar]
- 190.Cristobal A, Hennrich ML, Giansanti P, Goerdayal SS, Heck AJ, Mohammed S. Analyst. doi: 10.1039/c2an35445d. [DOI] [PubMed] [Google Scholar]
- 191.Marchetti N, Cavazzini A, Gritti F, Guiochon G. J Chromatogr A. 2007;1163:203. doi: 10.1016/j.chroma.2007.06.046. [DOI] [PubMed] [Google Scholar]
- 192.Marchetti N, Guiochon G. J Chromatogr A. 2007;1176:206. doi: 10.1016/j.chroma.2007.11.012. [DOI] [PubMed] [Google Scholar]
- 193.Ruta J, Guillarme D, Rudaz S, Veuthey JL. J Sep Sci. 2010;33:2465. doi: 10.1002/jssc.201000023. [DOI] [PubMed] [Google Scholar]
- 194.Schuster SA, Boyes BE, Wagner BM, Kirkland JJ. J Chromatogr A. 2012;1228:232. doi: 10.1016/j.chroma.2011.07.082. [DOI] [PMC free article] [PubMed] [Google Scholar]
- 195.Schuster SA, Wagner BM, Boyes BE, Kirkland JJ. J Chromatogr Sci. 2010;48:566. doi: 10.1093/chromsci/48.7.566. [DOI] [PubMed] [Google Scholar]
- 196.Iwasaki M, Miwa S, Ikegami T, Tomita M, Tanaka N, Ishihama Y. Anal Chem. 2010;82:2616. doi: 10.1021/ac100343q. [DOI] [PubMed] [Google Scholar]
- 197.Iwasaki M, Sugiyama N, Tanaka N, Ishihama Y. J Chromatogr A. 2012;1228:292. doi: 10.1016/j.chroma.2011.10.059. [DOI] [PubMed] [Google Scholar]
- 198.Yamana R, Iwasaki M, Wakabayashi M, Nakagawa M, Yamanaka S, Ishihama Y. J Proteome Res. 2013;12:214. doi: 10.1021/pr300837u. [DOI] [PubMed] [Google Scholar]
- 199.Boersema PJ, Mohammed S, Heck AJ. Anal Bioanal Chem. 2008;391:151. doi: 10.1007/s00216-008-1865-7. [DOI] [PMC free article] [PubMed] [Google Scholar]
- 200.Yang Y, Boysen RI, Hearn MT. J Chromatogr A. 2009;1216:5518. doi: 10.1016/j.chroma.2009.05.085. [DOI] [PubMed] [Google Scholar]
- 201.Chen ML, Li LM, Yuan BF, Ma Q, Feng YQ. J Chromatogr A. 2012;1230:54. doi: 10.1016/j.chroma.2012.01.065. [DOI] [PubMed] [Google Scholar]
- 202.de Jong EP, Griffin TJ. J Proteome Res. 2012;11:5059. doi: 10.1021/pr300638n. [DOI] [PMC free article] [PubMed] [Google Scholar]
- 203.Busnel JM, Schoenmaker B, Ramautar R, Carrasco-Pancorbo A, Ratnayake C, Feitelson JS, Chapman JD, Deelder AM, Mayboroda OA. Anal Chem. 2010;82:9476. doi: 10.1021/ac102159d. [DOI] [PubMed] [Google Scholar]
- 204.Zhong X, Maxwell EJ, Chen DD. Anal Chem. 2011;83:4916. doi: 10.1021/ac200636y. [DOI] [PubMed] [Google Scholar]
- 205.Faserl K, Sarg B, Kremser L, Lindner H. Anal Chem. 2011;83:7297. doi: 10.1021/ac2010372. [DOI] [PubMed] [Google Scholar]
- 206.Li Y, Champion MM, Sun L, Champion PA, Wojcik R, Dovichi NJ. Anal Chem. 2012;84:1617. doi: 10.1021/ac202899p. [DOI] [PMC free article] [PubMed] [Google Scholar]
- 207.Heemskerk AA, Busnel JM, Schoenmaker B, Derks RJ, Klychnikov O, Hensbergen PJ, Deelder AM, Mayboroda OA. Anal Chem. 2012;84:4552. doi: 10.1021/ac300641x. [DOI] [PubMed] [Google Scholar]
- 208.Wang Y, Fonslow BR, Wong CC, Nakorchevsky A, Yates JR., 3rd Anal Chem. 2012;84:8505. doi: 10.1021/ac301091m. [DOI] [PMC free article] [PubMed] [Google Scholar]
- 209.Li Y, Wojcik R, Dovichi NJ, Champion MM. Anal Chem. 2012;84:6116. doi: 10.1021/ac300926h. [DOI] [PMC free article] [PubMed] [Google Scholar]
- 210.Shen Y, Jacobs JM, Camp DG, 2nd, Fang R, Moore RJ, Smith RD, Xiao W, Davis RW, Tompkins RG. Anal Chem. 2004;76:1134. doi: 10.1021/ac034869m. [DOI] [PubMed] [Google Scholar]
- 211.Motoyama A, Xu T, Ruse CI, Wohlschlegel JA, Yates JR., 3rd Anal Chem. 2007;79:3623. doi: 10.1021/ac062292d. [DOI] [PMC free article] [PubMed] [Google Scholar]
- 212.Dai J, Wang LS, Wu YB, Sheng QH, Wu JR, Shieh CH, Zeng R. J Proteome Res. 2009;8:133. doi: 10.1021/pr800381w. [DOI] [PubMed] [Google Scholar]
- 213.Gilar M, Olivova P, Daly AE, Gebler JC. J Sep Sci. 2005;28:1694. doi: 10.1002/jssc.200500116. [DOI] [PubMed] [Google Scholar]
- 214.Zhou F, Cardoza JD, Ficarro SB, Adelmant GO, Lazaro JB, Marto JA. J Proteome Res. 2010;9:6242. doi: 10.1021/pr1004696. [DOI] [PMC free article] [PubMed] [Google Scholar]
- 215.Wang N, Xie C, Young JB, Li L. Anal Chem. 2009;81:1049. doi: 10.1021/ac802106z. [DOI] [PubMed] [Google Scholar]
- 216.Malmstrom J, Lee H, Nesvizhskii AI, Shteynberg D, Mohanty S, Brunner E, Ye M, Weber G, Eckerskorn C, Aebersold R. J Proteome Res. 2006;5:2241. doi: 10.1021/pr0600632. [DOI] [PubMed] [Google Scholar]
- 217.Essader AS, Cargile BJ, Bundy JL, Stephenson JL., Jr Proteomics. 2005;5:24. doi: 10.1002/pmic.200400888. [DOI] [PubMed] [Google Scholar]
- 218.Hubner NC, Ren S, Mann M. Proteomics. 2008;8:4862. doi: 10.1002/pmic.200800351. [DOI] [PubMed] [Google Scholar]
- 219.Taouatas N, Altelaar AF, Drugan MM, Helbig AO, Mohammed S, Heck AJ. Mol Cell Proteomics. 2009;8:190. doi: 10.1074/mcp.M800285-MCP200. [DOI] [PubMed] [Google Scholar]
- 220.Boersema PJ, Divecha N, Heck AJ, Mohammed S. J Proteome Res. 2007;6:937. doi: 10.1021/pr060589m. [DOI] [PubMed] [Google Scholar]
- 221.Di Palma S, Boersema PJ, Heck AJ, Mohammed S. Anal Chem. 2011;83:3440. doi: 10.1021/ac103312e. [DOI] [PubMed] [Google Scholar]
- 222.Hao P, Qian J, Ren Y, Sze SK. J Proteome Res. 2011;10:5568. doi: 10.1021/pr2007686. [DOI] [PubMed] [Google Scholar]
- 223.Hao P, Guo T, Li X, Adav SS, Yang J, Wei M, Sze SK. J Proteome Res. 2010;9:3520. doi: 10.1021/pr100037h. [DOI] [PubMed] [Google Scholar]
- 224.Hao P, Guo T, Sze SK. PLoS One. 2011;6:e16884. doi: 10.1371/journal.pone.0016884. [DOI] [PMC free article] [PubMed] [Google Scholar]
- 225.Hao P, Qian J, Dutta B, Cheow ES, Sim KH, Meng W, Adav SS, Alpert A, Sze SK. J Proteome Res. 2012;11:1804. doi: 10.1021/pr201048c. [DOI] [PubMed] [Google Scholar]
- 226.Ritorto MS, Cook K, Tyagi K, Pedrioli PG, Trost M. J Proteome Res. 2013 doi: 10.1021/pr301011r. [DOI] [PMC free article] [PubMed] [Google Scholar]
- 227.Dai J, Jin WH, Sheng QH, Shieh CH, Wu JR, Zeng R. J Proteome Res. 2007;6:250. doi: 10.1021/pr0604155. [DOI] [PubMed] [Google Scholar]
- 228.Hennrich ML, Groenewold V, Kops GJ, Heck AJ, Mohammed S. Anal Chem. 2011;83:7137. doi: 10.1021/ac2015068. [DOI] [PubMed] [Google Scholar]
- 229.Ficarro SB, Zhang Y, Carrasco-Alfonso MJ, Garg B, Adelmant G, Webber JT, Luckey CJ, Marto JA. Mol Cell Proteomics. 2011;10:O111 011064. doi: 10.1074/mcp.O111.011064. [DOI] [PMC free article] [PubMed] [Google Scholar]
- 230.Zarei M, Sprenger A, Gretzmeier C, Dengjel J. J Proteome Res. 2012;11:4269. doi: 10.1021/pr300375d. [DOI] [PubMed] [Google Scholar]
- 231.Zhou F, Sikorski TW, Ficarro SB, Webber JT, Marto JA. Anal Chem. 2011;83:6996. doi: 10.1021/ac200639v. [DOI] [PMC free article] [PubMed] [Google Scholar]
- 232.Wong CC, Cociorva D, Venable JD, Xu T, Yates JR., 3rd J Am Soc Mass Spectrom. 2009;20:1405. doi: 10.1016/j.jasms.2009.04.007. [DOI] [PMC free article] [PubMed] [Google Scholar]
- 233.Venable JD, Dong MQ, Wohlschlegel J, Dillin A, Yates JR. Nat Methods. 2004;1:39. doi: 10.1038/nmeth705. [DOI] [PubMed] [Google Scholar]
- 234.Panchaud A, Scherl A, Shaffer SA, von Haller PD, Kulasekara HD, Miller SI, Goodlett DR. Anal Chem. 2009;81:6481. doi: 10.1021/ac900888s. [DOI] [PMC free article] [PubMed] [Google Scholar]
- 235.Ledvina AR, Savitski MM, Zubarev AR, Good DM, Coon JJ, Zubarev RA. Anal Chem. 2011;83:7651. doi: 10.1021/ac201843e. [DOI] [PMC free article] [PubMed] [Google Scholar]
- 236.Gillet LC, Navarro P, Tate S, Rost H, Selevsek N, Reiter L, Bonner R, Aebersold R. Mol Cell Proteomics. 2012;11:O111 016717. doi: 10.1074/mcp.O111.016717. [DOI] [PMC free article] [PubMed] [Google Scholar]
- 237.Mayya V, Rezaul K, Cong YS, Han D. Mol Cell Proteomics. 2005;4:214. doi: 10.1074/mcp.T400015-MCP200. [DOI] [PMC free article] [PubMed] [Google Scholar]
- 238.Blackler AR, Klammer AA, MacCoss MJ, Wu CC. Anal Chem. 2006;78:1337. doi: 10.1021/ac051486a. [DOI] [PubMed] [Google Scholar]
- 239.Second TP, Blethrow JD, Schwartz JC, Merrihew GE, MacCoss MJ, Swaney DL, Russell JD, Coon JJ, Zabrouskov V. Anal Chem. 2009;81:7757. doi: 10.1021/ac901278y. [DOI] [PMC free article] [PubMed] [Google Scholar]
- 240.Syka JE, Marto JA, Bai DL, Horning S, Senko MW, Schwartz JC, Ueberheide B, Garcia B, Busby S, Muratore T, Shabanowitz J, Hunt DF. J Proteome Res. 2004;3:621. doi: 10.1021/pr0499794. [DOI] [PubMed] [Google Scholar]
- 241.Yates JR, Cociorva D, Liao L, Zabrouskov V. Anal Chem. 2006;78:493. doi: 10.1021/ac0514624. [DOI] [PubMed] [Google Scholar]
- 242.Michalski A, Damoc E, Lange O, Denisov E, Nolting D, Muller M, Viner R, Schwartz J, Remes P, Belford M, Dunyach JJ, Cox J, Horning S, Mann M, Makarov A. Mol Cell Proteomics. 2012;11:O111 013698. doi: 10.1074/mcp.O111.013698. [DOI] [PMC free article] [PubMed] [Google Scholar]
- 243.Tolmachev AV, Monroe ME, Jaitly N, Petyuk VA, Adkins JN, Smith RD. Anal Chem. 2006;78:8374. doi: 10.1021/ac0606251. [DOI] [PubMed] [Google Scholar]
- 244.Becker CH, Kumar P, Jones T, Lin H. Anal Chem. 2007;79:1702. doi: 10.1021/ac061359u. [DOI] [PubMed] [Google Scholar]
- 245.Petyuk VA, Jaitly N, Moore RJ, Ding J, Metz TO, Tang K, Monroe ME, Tolmachev AV, Adkins JN, Belov ME, Dabney AR, Qian WJ, Camp DG, 2nd, Smith RD. Anal Chem. 2008;80:693. doi: 10.1021/ac701863d. [DOI] [PMC free article] [PubMed] [Google Scholar]
- 246.Zhang J, Ma J, Dou L, Wu S, Qian X, Xie H, Zhu Y, He F. J Proteome Res. 2009;8:849. doi: 10.1021/pr8005588. [DOI] [PubMed] [Google Scholar]
- 247.Cox J, Michalski A, Mann M. J Am Soc Mass Spectrom. 2011;22:1373. doi: 10.1007/s13361-011-0142-8. [DOI] [PMC free article] [PubMed] [Google Scholar]
- 248.Lee KA, Farnsworth C, Yu W, Bonilla LE. J Proteome Res. 2011;10:880. doi: 10.1021/pr100780b. [DOI] [PubMed] [Google Scholar]
- 249.Haas W, Faherty BK, Gerber SA, Elias JE, Beausoleil SA, Bakalarski CE, Li X, Villen J, Gygi SP. Mol Cell Proteomics. 2006;5:1326. doi: 10.1074/mcp.M500339-MCP200. [DOI] [PubMed] [Google Scholar]
- 250.Scheltema RA, Kamleh A, Wildridge D, Ebikeme C, Watson DG, Barrett MP, Jansen RC, Breitling R. Proteomics. 2008;8:4647. doi: 10.1002/pmic.200800314. [DOI] [PubMed] [Google Scholar]
- 251.Zhang Y, Wen Z, Washburn MP, Florens L. Anal Chem. 2011;83:9344. doi: 10.1021/ac201867h. [DOI] [PubMed] [Google Scholar]
- 252.Wu S, Kaiser NK, Meng D, Anderson GA, Zhang K, Bruce JE. J Proteome Res. 2005;4:1434. doi: 10.1021/pr0501057. [DOI] [PubMed] [Google Scholar]
- 253.Olsen JV, de Godoy LM, Li G, Macek B, Mortensen P, Pesch R, Makarov A, Lange O, Horning S, Mann M. Mol Cell Proteomics. 2005;4:2010. doi: 10.1074/mcp.T500030-MCP200. [DOI] [PubMed] [Google Scholar]
- 254.Cox J, Mann M. Nat Biotechnol. 2008;26:1367. doi: 10.1038/nbt.1511. [DOI] [PubMed] [Google Scholar]
- 255.Steen H, Kuster B, Mann M. J Mass Spectrom. 2001;36:782. doi: 10.1002/jms.174. [DOI] [PubMed] [Google Scholar]
- 256.Elias JE, Haas W, Faherty BK, Gygi SP. Nat Methods. 2005;2:667. doi: 10.1038/nmeth785. [DOI] [PubMed] [Google Scholar]
- 257.Andrews GL, Simons BL, Young JB, Hawkridge AM, Muddiman DC. Anal Chem. 2011;83:5442. doi: 10.1021/ac200812d. [DOI] [PMC free article] [PubMed] [Google Scholar]
- 258.Michalski A, Damoc E, Hauschild JP, Lange O, Wieghaus A, Makarov A, Nagaraj N, Cox J, Mann M, Horning S. Mol Cell Proteomics. 2011;10:M111 011015. doi: 10.1074/mcp.M111.011015. [DOI] [PMC free article] [PubMed] [Google Scholar]
- 259.Kelstrup CD, Young C, Lavallee R, Nielsen ML, Olsen JV. J Proteome Res. 2012 doi: 10.1021/pr3000249. [DOI] [PubMed] [Google Scholar]
- 260.Venne K, Bonneil E, Eng K, Thibault P. Anal Chem. 2005;77:2176. doi: 10.1021/ac048410j. [DOI] [PubMed] [Google Scholar]
- 261.Saba J, Bonneil E, Pomies C, Eng K, Thibault P. J Proteome Res. 2009;8:3355. doi: 10.1021/pr801106a. [DOI] [PubMed] [Google Scholar]
- 262.Canterbury JD, Yi X, Hoopmann MR, MacCoss MJ. Anal Chem. 2008;80:6888. doi: 10.1021/ac8004988. [DOI] [PMC free article] [PubMed] [Google Scholar]
- 263.Baker ES, Livesay EA, Orton DJ, Moore RJ, Danielson WF, 3rd, Prior DC, Ibrahim YM, LaMarche BL, Mayampurath AM, Schepmoes AA, Hopkins DF, Tang K, Smith RD, Belov ME. J Proteome Res. 2010;9:997. doi: 10.1021/pr900888b. [DOI] [PMC free article] [PubMed] [Google Scholar]
- 264.Swearingen KE, Hoopmann MR, Johnson RS, Saleem RA, Aitchison JD, Moritz RL. Mol Cell Proteomics. 2012;11:M111 014985. doi: 10.1074/mcp.M111.014985. [DOI] [PMC free article] [PubMed] [Google Scholar]
- 265.Shvartsburg AA, Creese AJ, Smith RD, Cooper HJ. Anal Chem. 2011;83:6918. doi: 10.1021/ac201640d. [DOI] [PMC free article] [PubMed] [Google Scholar]
- 266.Shvartsburg AA, Smith RD. Anal Chem. 2011;83:23. doi: 10.1021/ac202386w. [DOI] [PMC free article] [PubMed] [Google Scholar]
- 267.Shvartsburg AA, Creese AJ, Smith RD, Cooper HJ. Anal Chem. 2010;82:8327. doi: 10.1021/ac101878a. [DOI] [PMC free article] [PubMed] [Google Scholar]
- 268.Shvartsburg AA, Singer D, Smith RD, Hoffmann R. Anal Chem. 2011;83:5078. doi: 10.1021/ac200985s. [DOI] [PMC free article] [PubMed] [Google Scholar]
- 269.Creese AJ, Cooper HJ. Anal Chem. 2012;84:2597. doi: 10.1021/ac203321y. [DOI] [PMC free article] [PubMed] [Google Scholar]
- 270.Ting L, Cowley MJ, Hoon SL, Guilhaus M, Raftery MJ, Cavicchioli R. Mol Cell Proteomics. 2009;8:2227. doi: 10.1074/mcp.M800462-MCP200. [DOI] [PMC free article] [PubMed] [Google Scholar]
- 271.Bereman MS, Canterbury JD, Egertson JD, Horner J, Remes PM, Schwartz J, Zabrouskov V, MacCoss MJ. Anal Chem. 2012;84:1533. doi: 10.1021/ac203210a. [DOI] [PMC free article] [PubMed] [Google Scholar]
- 272.McAlister GC, Phanstiel DH, Brumbaugh J, Westphall MS, Coon JJ. Mol Cell Proteomics. 2011;10:O111 009456. doi: 10.1074/mcp.O111.009456. [DOI] [PMC free article] [PubMed] [Google Scholar]
- 273.Olsen JV, Macek B, Lange O, Makarov A, Horning S, Mann M. Nat Methods. 2007;4:709. doi: 10.1038/nmeth1060. [DOI] [PubMed] [Google Scholar]
- 274.McAlister GC, Phanstiel D, Wenger CD, Lee MV, Coon JJ. Anal Chem. 2010;82:316. doi: 10.1021/ac902005s. [DOI] [PMC free article] [PubMed] [Google Scholar]
- 275.Pichler P, Kocher T, Holzmann J, Mohring T, Ammerer G, Mechtler K. Anal Chem. 2011;83:1469. doi: 10.1021/ac102265w. [DOI] [PMC free article] [PubMed] [Google Scholar]
- 276.Griffin TJ, Xie H, Bandhakavi S, Popko J, Mohan A, Carlis JV, Higgins L. J Proteome Res. 2007;6:4200. doi: 10.1021/pr070291b. [DOI] [PMC free article] [PubMed] [Google Scholar]
- 277.Guo T, Gan CS, Zhang H, Zhu Y, Kon OL, Sze SK. J Proteome Res. 2008;7:4831. doi: 10.1021/pr800403z. [DOI] [PubMed] [Google Scholar]
- 278.DeGnore JP, Qin J. J Am Soc Mass Spectrom. 1998;9:1175. doi: 10.1016/S1044-0305(98)00088-9. [DOI] [PubMed] [Google Scholar]
- 279.Olsen JV, Mann M. Proc Natl Acad Sci U S A. 2004;101:13417. doi: 10.1073/pnas.0405549101. [DOI] [PMC free article] [PubMed] [Google Scholar]
- 280.Schroeder MJ, Shabanowitz J, Schwartz JC, Hunt DF, Coon JJ. Anal Chem. 2004;76:3590. doi: 10.1021/ac0497104. [DOI] [PubMed] [Google Scholar]
- 281.Palumbo AM, Tepe JJ, Reid GE. J Proteome Res. 2008;7:771. doi: 10.1021/pr0705136. [DOI] [PubMed] [Google Scholar]
- 282.Ulintz PJ, Yocum AK, Bodenmiller B, Aebersold R, Andrews PC, Nesvizhskii AI. J Proteome Res. 2009;8:887. doi: 10.1021/pr800535h. [DOI] [PMC free article] [PubMed] [Google Scholar]
- 283.Nagaraj N, D’Souza RC, Cox J, Olsen JV, Mann M. J Proteome Res. 2010;9:6786. doi: 10.1021/pr100637q. [DOI] [PubMed] [Google Scholar]
- 284.Jedrychowski MP, Huttlin EL, Haas W, Sowa ME, Rad R, Gygi SP. Mol Cell Proteomics. 2011;10:M111 009910. doi: 10.1074/mcp.M111.009910. [DOI] [PMC free article] [PubMed] [Google Scholar]
- 285.Zubarev RA, Kelleher NL, McLafferty FW. Journal of the American Chemical Society. 1998;120:3265. [Google Scholar]
- 286.Syka JE, Coon JJ, Schroeder MJ, Shabanowitz J, Hunt DF. Proc Natl Acad Sci U S A. 2004;101:9528. doi: 10.1073/pnas.0402700101. [DOI] [PMC free article] [PubMed] [Google Scholar]
- 287.Kelleher NL, Zubarev RA, Bush K, Furie B, Furie BC, McLafferty FW, Walsh CT. Anal Chem. 1999;71:4250. doi: 10.1021/ac990684x. [DOI] [PubMed] [Google Scholar]
- 288.Cooper HJ, Akbarzadeh S, Heath JK, Zeller M. J Proteome Res. 2005;4:1538. doi: 10.1021/pr050090c. [DOI] [PubMed] [Google Scholar]
- 289.Creese AJ, Cooper HJ. J Am Soc Mass Spectrom. 2007;18:891. doi: 10.1016/j.jasms.2007.01.008. [DOI] [PMC free article] [PubMed] [Google Scholar]
- 290.Kalli A, Hakansson K. J Proteome Res. 2008;7:2834. doi: 10.1021/pr800038y. [DOI] [PubMed] [Google Scholar]
- 291.Sweet SM, Bailey CM, Cunningham DL, Heath JK, Cooper HJ. Mol Cell Proteomics. 2009;8:904. doi: 10.1074/mcp.M800451-MCP200. [DOI] [PMC free article] [PubMed] [Google Scholar]
- 292.Satake H, Hasegawa H, Hirabayashi A, Hashimoto Y, Baba T, Masuda K. Anal Chem. 2007;79:8755. doi: 10.1021/ac071462z. [DOI] [PubMed] [Google Scholar]
- 293.Compton PD, Strukl JV, Bai DL, Shabanowitz J, Hunt DF. Anal Chem. 2012;84:1781. doi: 10.1021/ac202807h. [DOI] [PMC free article] [PubMed] [Google Scholar]
- 294.Udeshi ND, Compton PD, Shabanowitz J, Hunt DF, Rose KL. Nat Protoc. 2008;3:1709. doi: 10.1038/nprot.2008.159. [DOI] [PMC free article] [PubMed] [Google Scholar]
- 295.Aguiar M, Haas W, Beausoleil SA, Rush J, Gygi SP. J Proteome Res. 2010;9:3103. doi: 10.1021/pr1000225. [DOI] [PMC free article] [PubMed] [Google Scholar]
- 296.Palumbo AM, Reid GE. Anal Chem. 2008;80:9735. doi: 10.1021/ac801768s. [DOI] [PubMed] [Google Scholar]
- 297.Taouatas N, Drugan MM, Heck AJ, Mohammed S. Nat Methods. 2008;5:405. doi: 10.1038/nmeth.1204. [DOI] [PubMed] [Google Scholar]
- 298.McAlister GC, Berggren WT, Griep-Raming J, Horning S, Makarov A, Phanstiel D, Stafford G, Swaney DL, Syka JE, Zabrouskov V, Coon JJ. J Proteome Res. 2008;7:3127. doi: 10.1021/pr800264t. [DOI] [PMC free article] [PubMed] [Google Scholar]
- 299.McAlister GC, Phanstiel D, Good DM, Berggren WT, Coon JJ. Anal Chem. 2007;79:3525. doi: 10.1021/ac070020k. [DOI] [PMC free article] [PubMed] [Google Scholar]
- 300.Swaney DL, McAlister GC, Wirtala M, Schwartz JC, Syka JE, Coon JJ. Anal Chem. 2007;79:477. doi: 10.1021/ac061457f. [DOI] [PMC free article] [PubMed] [Google Scholar]
- 301.Wu SL, Huhmer AF, Hao Z, Karger BL. J Proteome Res. 2007;6:4230. doi: 10.1021/pr070313u. [DOI] [PMC free article] [PubMed] [Google Scholar]
- 302.Swaney DL, McAlister GC, Coon JJ. Nat Methods. 2008;5:959. doi: 10.1038/nmeth.1260. [DOI] [PMC free article] [PubMed] [Google Scholar]
- 303.Frese CK, Altelaar AF, Hennrich ML, Nolting D, Zeller M, Griep-Raming J, Heck AJ, Mohammed S. J Proteome Res. 2011;10:2377. doi: 10.1021/pr1011729. [DOI] [PubMed] [Google Scholar]
- 304.Mischerikow N, van Nierop P, Li KW, Bernstein HG, Smit AB, Heck AJ, Altelaar AF. Analyst. 2010;135:2643. doi: 10.1039/c0an00267d. [DOI] [PubMed] [Google Scholar]
- 305.Bridon G, Bonneil E, Muratore-Schroeder T, Caron-Lizotte O, Thibault P. J Proteome Res. 2012;11:927. doi: 10.1021/pr200722s. [DOI] [PubMed] [Google Scholar]
- 306.McAlister GC, Russell JD, Rumachik NG, Hebert AS, Syka JE, Geer LY, Westphall MS, Pagliarini DJ, Coon JJ. Anal Chem. 2012;84:2875. doi: 10.1021/ac203430u. [DOI] [PMC free article] [PubMed] [Google Scholar]
- 307.Ledvina AR, Beauchene NA, McAlister GC, Syka JE, Schwartz JC, Griep-Raming J, Westphall MS, Coon JJ. Anal Chem. 2010;82:10068. doi: 10.1021/ac1020358. [DOI] [PMC free article] [PubMed] [Google Scholar]
- 308.Vasicek LA, Ledvina AR, Shaw J, Griep-Raming J, Westphall MS, Coon JJ, Brodbelt JS. J Am Soc Mass Spectrom. 2011;22:1105. doi: 10.1007/s13361-011-0119-7. [DOI] [PMC free article] [PubMed] [Google Scholar]
- 309.Ledvina AR, Lee MV, McAlister GC, Westphall MS, Coon JJ. Anal Chem. 2012;84:4513. doi: 10.1021/ac300367p. [DOI] [PMC free article] [PubMed] [Google Scholar]
- 310.Blume-Jensen P, Hunter T. Nature. 2001;411:355. doi: 10.1038/35077225. [DOI] [PubMed] [Google Scholar]
- 311.Hunter T. Cell. 2000;100:113. doi: 10.1016/s0092-8674(00)81688-8. [DOI] [PubMed] [Google Scholar]
- 312.MacDonald JA, Mackey AJ, Pearson WR, Haystead TA. Mol Cell Proteomics. 2002;1:314. doi: 10.1074/mcp.m200002-mcp200. [DOI] [PubMed] [Google Scholar]
- 313.Roepstorff P, Kristiansen K. Biomed Mass Spectrom. 1974;1:231. doi: 10.1002/bms.1200010406. [DOI] [PubMed] [Google Scholar]
- 314.Olsen JV, Blagoev B, Gnad F, Macek B, Kumar C, Mortensen P, Mann M. Cell. 2006;127:635. doi: 10.1016/j.cell.2006.09.026. [DOI] [PubMed] [Google Scholar]
- 315.Beausoleil SA, Jedrychowski M, Schwartz D, Elias JE, Villen J, Li J, Cohn MA, Cantley LC, Gygi SP. Proc Natl Acad Sci U S A. 2004;101:12130. doi: 10.1073/pnas.0404720101. [DOI] [PMC free article] [PubMed] [Google Scholar]
- 316.Pinkse MW, Uitto PM, Hilhorst MJ, Ooms B, Heck AJ. Anal Chem. 2004;76:3935. doi: 10.1021/ac0498617. [DOI] [PubMed] [Google Scholar]
- 317.Andersson L, Porath J. Anal Biochem. 1986;154:250. doi: 10.1016/0003-2697(86)90523-3. [DOI] [PubMed] [Google Scholar]
- 318.Posewitz MC, Tempst P. Anal Chem. 1999;71:2883. doi: 10.1021/ac981409y. [DOI] [PubMed] [Google Scholar]
- 319.Michel H, Hunt DF, Shabanowitz J, Bennett J. J Biol Chem. 1988;263:1123. [PubMed] [Google Scholar]
- 320.Trojer L, Stecher G, Feuerstein I, Lubbad S, Bonn GK. J Chromatogr A. 2005;1079:197. doi: 10.1016/j.chroma.2005.02.077. [DOI] [PubMed] [Google Scholar]
- 321.Haydon CE, Eyers PA, Aveline-Wolf LD, Resing KA, Maller JL, Ahn NG. Mol Cell Proteomics. 2003;2:1055. doi: 10.1074/mcp.M300054-MCP200. [DOI] [PubMed] [Google Scholar]
- 322.Ficarro SB, McCleland ML, Stukenberg PT, Burke DJ, Ross MM, Shabanowitz J, Hunt DF, White FM. Nat Biotechnol. 2002;20:301. doi: 10.1038/nbt0302-301. [DOI] [PubMed] [Google Scholar]
- 323.Han G, Ye M, Zou H. Analyst. 2008;133:1128. doi: 10.1039/b806775a. [DOI] [PubMed] [Google Scholar]
- 324.Larsen MR, Thingholm TE, Jensen ON, Roepstorff P, Jorgensen TJ. Mol Cell Proteomics. 2005;4:873. doi: 10.1074/mcp.T500007-MCP200. [DOI] [PubMed] [Google Scholar]
- 325.Thingholm TE, Jorgensen TJ, Jensen ON, Larsen MR. Nat Protoc. 2006;1:1929. doi: 10.1038/nprot.2006.185. [DOI] [PubMed] [Google Scholar]
- 326.Kweon HK, Hakansson K. Anal Chem. 2006;78:1743. doi: 10.1021/ac0522355. [DOI] [PubMed] [Google Scholar]
- 327.Li Y, Lin H, Deng C, Yang P, Zhang X. Proteomics. 2008;8:238. doi: 10.1002/pmic.200700454. [DOI] [PubMed] [Google Scholar]
- 328.Bodenmiller B, Mueller LN, Mueller M, Domon B, Aebersold R. Nat Methods. 2007;4:231. doi: 10.1038/nmeth1005. [DOI] [PubMed] [Google Scholar]
- 329.Li QR, Ning ZB, Tang JS, Nie S, Zeng R. J Proteome Res. 2009;8:5375. doi: 10.1021/pr900659n. [DOI] [PubMed] [Google Scholar]
- 330.Mazanek M, Mituloviae G, Herzog F, Stingl C, Hutchins JR, Peters JM, Mechtler K. Nat Protoc. 2007;2:1059. doi: 10.1038/nprot.2006.280. [DOI] [PubMed] [Google Scholar]
- 331.Simon ES, Young M, Chan A, Bao ZQ, Andrews PC. Anal Biochem. 2008;377:234. doi: 10.1016/j.ab.2008.03.024. [DOI] [PMC free article] [PubMed] [Google Scholar]
- 332.Thingholm TE, Jensen ON, Robinson PJ, Larsen MR. Mol Cell Proteomics. 2008;7:661. doi: 10.1074/mcp.M700362-MCP200. [DOI] [PubMed] [Google Scholar]
- 333.Iliuk AB, Martin VA, Alicie BM, Geahlen RL, Tao WA. Mol Cell Proteomics. 2010;9:2162. doi: 10.1074/mcp.M110.000091. [DOI] [PMC free article] [PubMed] [Google Scholar]
- 334.Han G, Ye M, Zhou H, Jiang X, Feng S, Tian R, Wan D, Zou H, Gu J. Proteomics. 2008;8:1346. doi: 10.1002/pmic.200700884. [DOI] [PubMed] [Google Scholar]
- 335.Alpert AJ. J Chromatogr. 1990;499:177. doi: 10.1016/s0021-9673(00)96972-3. [DOI] [PubMed] [Google Scholar]
- 336.Alpert AJ. Anal Chem. 2008;80:62. doi: 10.1021/ac070997p. [DOI] [PubMed] [Google Scholar]
- 337.Beausoleil SA, Villen J, Gerber SA, Rush J, Gygi SP. Nat Biotechnol. 2006;24:1285. doi: 10.1038/nbt1240. [DOI] [PubMed] [Google Scholar]
- 338.Hennrich ML, van den Toorn HW, Groenewold V, Heck AJ, Mohammed S. Anal Chem. 2012;84:1804. doi: 10.1021/ac203303t. [DOI] [PubMed] [Google Scholar]
- 339.Xu Y, Sprung R, Kwon SW, Kim SC, Zhao Y. J Proteome Res. 2007;6:1153. doi: 10.1021/pr060498p. [DOI] [PubMed] [Google Scholar]
- 340.Hung CW, Kubler D, Lehmann WD. Electrophoresis. 2007;28:2044. doi: 10.1002/elps.200600678. [DOI] [PubMed] [Google Scholar]
- 341.McNulty DE, Annan RS. Mol Cell Proteomics. 2008;7:971. doi: 10.1074/mcp.M700543-MCP200. [DOI] [PubMed] [Google Scholar]
- 342.Dong M, Ye M, Cheng K, Song C, Pan Y, Wang C, Bian Y, Zou H. J Proteome Res. 2012;11:4673. doi: 10.1021/pr300503z. [DOI] [PubMed] [Google Scholar]
- 343.Reynolds EC, Riley PF, Adamson NJ. Anal Biochem. 1994;217:277. doi: 10.1006/abio.1994.1119. [DOI] [PubMed] [Google Scholar]
- 344.Ruse CI, McClatchy DB, Lu B, Cociorva D, Motoyama A, Park SK, Yates JR., 3rd J Proteome Res. 2008;7:2140. doi: 10.1021/pr800147u. [DOI] [PMC free article] [PubMed] [Google Scholar]
- 345.Zhang X, Ye J, Jensen ON, Roepstorff P. Mol Cell Proteomics. 2007;6:2032. doi: 10.1074/mcp.M700278-MCP200. [DOI] [PubMed] [Google Scholar]
- 346.Ballif BA, Carey GR, Sunyaev SR, Gygi SP. J Proteome Res. 2008;7:311. doi: 10.1021/pr0701254. [DOI] [PubMed] [Google Scholar]
- 347.Rush J, Moritz A, Lee KA, Guo A, Goss VL, Spek EJ, Zhang H, Zha XM, Polakiewicz RD, Comb MJ. Nat Biotechnol. 2005;23:94. doi: 10.1038/nbt1046. [DOI] [PubMed] [Google Scholar]
- 348.Mamone G, Picariello G, Ferranti P, Addeo F. Proteomics. 2010;10:380. doi: 10.1002/pmic.200800710. [DOI] [PubMed] [Google Scholar]
- 349.Fonslow BR, Niessen SM, Singh M, Wong CC, Xu T, Carvalho PC, Choi J, Park SK, Yates JR., 3rd J Proteome Res. 2012;11:2697. doi: 10.1021/pr300200x. [DOI] [PMC free article] [PubMed] [Google Scholar]
- 350.Bodenmiller B, Mueller LN, Pedrioli PG, Pflieger D, Junger MA, Eng JK, Aebersold R, Tao WA. Mol Biosyst. 2007;3:275. doi: 10.1039/b617545g. [DOI] [PubMed] [Google Scholar]
- 351.Jin WH, Dai J, Zhou H, Xia QC, Zou HF, Zeng R. Rapid Commun Mass Spectrom. 2004;18:2169. doi: 10.1002/rcm.1604. [DOI] [PubMed] [Google Scholar]
- 352.Torres MP, Thapar R, Marzluff WF, Borchers CH. J Proteome Res. 2005;4:1628. doi: 10.1021/pr050129d. [DOI] [PubMed] [Google Scholar]
- 353.Ishihama Y, Wei FY, Aoshima K, Sato T, Kuromitsu J, Oda Y. J Proteome Res. 2007;6:1139. doi: 10.1021/pr060452w. [DOI] [PubMed] [Google Scholar]
- 354.Stensballe A, Jensen ON, Olsen JV, Haselmann KF, Zubarev RA. Rapid Commun Mass Spectrom. 2000;14:1793. doi: 10.1002/1097-0231(20001015)14:19<1793::AID-RCM95>3.0.CO;2-Q. [DOI] [PubMed] [Google Scholar]
- 355.Chi A, Huttenhower C, Geer LY, Coon JJ, Syka JE, Bai DL, Shabanowitz J, Burke DJ, Troyanskaya OG, Hunt DF. Proc Natl Acad Sci U S A. 2007;104:2193. doi: 10.1073/pnas.0607084104. [DOI] [PMC free article] [PubMed] [Google Scholar]
- 356.Molina H, Horn DM, Tang N, Mathivanan S, Pandey A. Proc Natl Acad Sci U S A. 2007;104:2199. doi: 10.1073/pnas.0611217104. [DOI] [PMC free article] [PubMed] [Google Scholar]
- 357.Lu B, Ruse C, Xu T, Park SK, Yates J., 3rd Anal Chem. 2007;79:1301. doi: 10.1021/ac061334v. [DOI] [PMC free article] [PubMed] [Google Scholar]
- 358.Diella F, Gould CM, Chica C, Via A, Gibson TJ. Nucleic Acids Res. 2008;36:D240. doi: 10.1093/nar/gkm772. [DOI] [PMC free article] [PubMed] [Google Scholar]
- 359.Gnad F, Ren S, Cox J, Olsen JV, Macek B, Oroshi M, Mann M. Genome Biol. 2007;8:R250. doi: 10.1186/gb-2007-8-11-r250. [DOI] [PMC free article] [PubMed] [Google Scholar]
- 360.Obenauer JC, Cantley LC, Yaffe MB. Nucleic Acids Res. 2003;31:3635. doi: 10.1093/nar/gkg584. [DOI] [PMC free article] [PubMed] [Google Scholar]
- 361.Wong YH, Lee TY, Liang HK, Huang CM, Wang TY, Yang YH, Chu CH, Huang HD, Ko MT, Hwang JK. Nucleic Acids Res. 2007;35:W588. doi: 10.1093/nar/gkm322. [DOI] [PMC free article] [PubMed] [Google Scholar]
- 362.Xue Y, Li A, Wang L, Feng H, Yao X. BMC Bioinformatics. 2006;7:163. doi: 10.1186/1471-2105-7-163. [DOI] [PMC free article] [PubMed] [Google Scholar]
- 363.Hershko A, Ciechanover A, Rose IA. Proc Natl Acad Sci U S A. 1979;76:3107. doi: 10.1073/pnas.76.7.3107. [DOI] [PMC free article] [PubMed] [Google Scholar]
- 364.Ciehanover A, Hod Y, Hershko A. Biochem Biophys Res Commun. 1978;81:1100. doi: 10.1016/0006-291x(78)91249-4. [DOI] [PubMed] [Google Scholar]
- 365.Pickart CM. Annu Rev Biochem. 2001;70:503. doi: 10.1146/annurev.biochem.70.1.503. [DOI] [PubMed] [Google Scholar]
- 366.Dikic I, Wakatsuki S, Walters KJ. Nat Rev Mol Cell Biol. 2009;10:659. doi: 10.1038/nrm2767. [DOI] [PMC free article] [PubMed] [Google Scholar]
- 367.Newton K, Matsumoto ML, Wertz IE, Kirkpatrick DS, Lill JR, Tan J, Dugger D, Gordon N, Sidhu SS, Fellouse FA, Komuves L, French DM, Ferrando RE, Lam C, Compaan D, Yu C, Bosanac I, Hymowitz SG, Kelley RF, Dixit VM. Cell. 2008;134:668. doi: 10.1016/j.cell.2008.07.039. [DOI] [PubMed] [Google Scholar]
- 368.Schwartz DC, Hochstrasser M. Trends Biochem Sci. 2003;28:321. doi: 10.1016/S0968-0004(03)00113-0. [DOI] [PubMed] [Google Scholar]
- 369.Welchman RL, Gordon C, Mayer RJ. Nat Rev Mol Cell Biol. 2005;6:599. doi: 10.1038/nrm1700. [DOI] [PubMed] [Google Scholar]
- 370.Grabbe C, Dikic I. Chem Rev. 2009;109:1481. doi: 10.1021/cr800413p. [DOI] [PubMed] [Google Scholar]
- 371.Boja ES, Fales HM. Anal Chem. 2001;73:3576. doi: 10.1021/ac0103423. [DOI] [PubMed] [Google Scholar]
- 372.Nielsen ML, Vermeulen M, Bonaldi T, Cox J, Moroder L, Mann M. Nat Methods. 2008;5:459. doi: 10.1038/nmeth0608-459. [DOI] [PubMed] [Google Scholar]
- 373.Xu P, Duong DM, Seyfried NT, Cheng D, Xie Y, Robert J, Rush J, Hochstrasser M, Finley D, Peng J. Cell. 2009;137:133. doi: 10.1016/j.cell.2009.01.041. [DOI] [PMC free article] [PubMed] [Google Scholar]
- 374.Vasilescu J, Smith JC, Ethier M, Figeys D. J Proteome Res. 2005;4:2192. doi: 10.1021/pr050265i. [DOI] [PubMed] [Google Scholar]
- 375.Peng J, Schwartz D, Elias JE, Thoreen CC, Cheng D, Marsischky G, Roelofs J, Finley D, Gygi SP. Nat Biotechnol. 2003;21:921. doi: 10.1038/nbt849. [DOI] [PubMed] [Google Scholar]
- 376.Xu G, Paige JS, Jaffrey SR. Nat Biotechnol. 2010;28:868. doi: 10.1038/nbt.1654. [DOI] [PMC free article] [PubMed] [Google Scholar]
- 377.Hicke L, Schubert HL, Hill CP. Nat Rev Mol Cell Biol. 2005;6:610. doi: 10.1038/nrm1701. [DOI] [PubMed] [Google Scholar]
- 378.Jones J, Wu K, Yang Y, Guerrero C, Nillegoda N, Pan ZQ, Huang L. J Proteome Res. 2008;7:1274. doi: 10.1021/pr700749v. [DOI] [PMC free article] [PubMed] [Google Scholar]
- 379.Giannakopoulos NV, Luo JK, Papov V, Zou W, Lenschow DJ, Jacobs BS, Borden EC, Li J, Virgin HW, Zhang DE. Biochem Biophys Res Commun. 2005;336:496. doi: 10.1016/j.bbrc.2005.08.132. [DOI] [PubMed] [Google Scholar]
- 380.Wohlschlegel JA, Johnson ES, Reed SI, Yates JR., 3rd J Proteome Res. 2006;5:761. doi: 10.1021/pr050451o. [DOI] [PMC free article] [PubMed] [Google Scholar]
- 381.Kirkpatrick DS, Denison C, Gygi SP. Nat Cell Biol. 2005;7:750. doi: 10.1038/ncb0805-750. [DOI] [PMC free article] [PubMed] [Google Scholar]
- 382.Huang H, Jeon MS, Liao L, Yang C, Elly C, Yates JR, 3rd, Liu YC. Immunity. 2010;33:60. doi: 10.1016/j.immuni.2010.07.002. [DOI] [PMC free article] [PubMed] [Google Scholar]
- 383.Bause E. Biochem J. 1983;209:331. doi: 10.1042/bj2090331. [DOI] [PMC free article] [PubMed] [Google Scholar]
- 384.Gerken TA, Gupta R, Jentoft N. Biochemistry. 1992;31:639. doi: 10.1021/bi00118a002. [DOI] [PubMed] [Google Scholar]
- 385.Greis KD, Hayes BK, Comer FI, Kirk M, Barnes S, Lowary TL, Hart GW. Anal Biochem. 1996;234:38. doi: 10.1006/abio.1996.0047. [DOI] [PubMed] [Google Scholar]
- 386.Gonzalez-Begne M, Lu B, Liao L, Xu T, Bedi G, Melvin JE, Yates JR., 3rd J Proteome Res. 2011;10:5031. doi: 10.1021/pr200505t. [DOI] [PMC free article] [PubMed] [Google Scholar]
- 387.Mechref Y, Madera M, Novotny MV. Methods Mol Biol. 2008;424:373. doi: 10.1007/978-1-60327-064-9_29. [DOI] [PubMed] [Google Scholar]
- 388.Zhang H, Li XJ, Martin DB, Aebersold R. Nat Biotechnol. 2003;21:660. doi: 10.1038/nbt827. [DOI] [PubMed] [Google Scholar]
- 389.Hagglund P, Bunkenborg J, Elortza F, Jensen ON, Roepstorff P. J Proteome Res. 2004;3:556. doi: 10.1021/pr034112b. [DOI] [PubMed] [Google Scholar]
- 390.Yeh CH, Chen SH, Li DT, Lin HP, Huang HJ, Chang CI, Shih WL, Chern CL, Shi FK, Hsu JL. J Chromatogr A. 2012;1224:70. doi: 10.1016/j.chroma.2011.12.057. [DOI] [PubMed] [Google Scholar]
- 391.Monzo A, Bonn GK, Guttman A. Anal Bioanal Chem. 2007;389:2097. doi: 10.1007/s00216-007-1627-y. [DOI] [PubMed] [Google Scholar]
- 392.Krisp C, Kubutat C, Kyas A, Steinstrasser L, Jacobsen F, Wolters D. J Proteomics. 2011;74:502. doi: 10.1016/j.jprot.2011.01.005. [DOI] [PubMed] [Google Scholar]
- 393.Hakansson K, Cooper HJ, Emmett MR, Costello CE, Marshall AG, Nilsson CL. Anal Chem. 2001;73:4530. doi: 10.1021/ac0103470. [DOI] [PubMed] [Google Scholar]
- 394.Hakansson K, Chalmers MJ, Quinn JP, McFarland MA, Hendrickson CL, Marshall AG. Anal Chem. 2003;75:3256. doi: 10.1021/ac030015q. [DOI] [PubMed] [Google Scholar]
- 395.Catalina MI, Koeleman CA, Deelder AM, Wuhrer M. Rapid Commun Mass Spectrom. 2007;21:1053. doi: 10.1002/rcm.2929. [DOI] [PubMed] [Google Scholar]
- 396.Kuster B, Mann M. Anal Chem. 1999;71:1431. doi: 10.1021/ac981012u. [DOI] [PubMed] [Google Scholar]
- 397.Atwood JA, 3rd, Sahoo SS, Alvarez-Manilla G, Weatherly DB, Kolli K, Orlando R, York WS. Rapid Commun Mass Spectrom. 2005;19:3002. doi: 10.1002/rcm.2162. [DOI] [PubMed] [Google Scholar]
- 398.Hwang CS, Shemorry A, Varshavsky A. Science. 2010;327:973. doi: 10.1126/science.1183147. [DOI] [PMC free article] [PubMed] [Google Scholar]
- 399.Polevoda B, Sherman F. J Biol Chem. 2000;275:36479. doi: 10.1074/jbc.R000023200. [DOI] [PubMed] [Google Scholar]
- 400.Allfrey VG, Faulkner R, Mirsky AE. Proc Natl Acad Sci U S A. 1964;51:786. doi: 10.1073/pnas.51.5.786. [DOI] [PMC free article] [PubMed] [Google Scholar]
- 401.Fu M, Wang C, Zhang X, Pestell RG. Biochem Pharmacol. 2004;68:1199. doi: 10.1016/j.bcp.2004.05.037. [DOI] [PubMed] [Google Scholar]
- 402.Zhao S, Xu W, Jiang W, Yu W, Lin Y, Zhang T, Yao J, Zhou L, Zeng Y, Li H, Li Y, Shi J, An W, Hancock SM, He F, Qin L, Chin J, Yang P, Chen X, Lei Q, Xiong Y, Guan KL. Science. 2010;327:1000. doi: 10.1126/science.1179689. [DOI] [PMC free article] [PubMed] [Google Scholar]
- 403.Butler R, Bates GP. Nat Rev Neurosci. 2006;7:784. doi: 10.1038/nrn1989. [DOI] [PubMed] [Google Scholar]
- 404.Yang XJ, Seto E. Mol Cell. 2008;31:449. doi: 10.1016/j.molcel.2008.07.002. [DOI] [PMC free article] [PubMed] [Google Scholar]
- 405.Choudhary C, Kumar C, Gnad F, Nielsen ML, Rehman M, Walther TC, Olsen JV, Mann M. Science. 2009;325:834. doi: 10.1126/science.1175371. [DOI] [PubMed] [Google Scholar]
- 406.Eriksen JG, Beavis AW, Coffey MA, Leer JW, Magrini SM, Benstead K, Boelling T, Hjalm-Eriksson M, Kantor G, Maciejewski B, Mezeckis M, Oliveira A, Thirion P, Vitek P, Olsen DR, Eudaldo T, Enghardt W, Francois P, Garibaldi C, Heijmen B, Josipovic M, Major T, Nikoletopoulos S, Rijnders A, Waligorski M, Wasilewska-Radwanska M, Mullaney L, Boejen A, Vaandering A, Vandevelde G, Verfaillie C, Potter R. Radiother Oncol. 2012;103:103. doi: 10.1016/j.radonc.2012.02.007. [DOI] [PubMed] [Google Scholar]
- 407.Stallcup MR. Oncogene. 2001;20:3014. doi: 10.1038/sj.onc.1204325. [DOI] [PubMed] [Google Scholar]
- 408.Ong SE, Mittler G, Mann M. Nat Methods. 2004;1:119. doi: 10.1038/nmeth715. [DOI] [PubMed] [Google Scholar]
- 409.Pang CN, Gasteiger E, Wilkins MR. BMC Genomics. 2010;11:92. doi: 10.1186/1471-2164-11-92. [DOI] [PMC free article] [PubMed] [Google Scholar]
- 410.Vermeulen M, Eberl HC, Matarese F, Marks H, Denissov S, Butter F, Lee KK, Olsen JV, Hyman AA, Stunnenberg HG, Mann M. Cell. 2010;142:967. doi: 10.1016/j.cell.2010.08.020. [DOI] [PubMed] [Google Scholar]
- 411.Lee JC, Kang SU, Jeon Y, Park JW, You JS, Ha SW, Bae N, Lubec G, Kwon SH, Lee JS, Cho EJ, Han JW. Nat Commun. 2012;3:927. doi: 10.1038/ncomms1933. [DOI] [PMC free article] [PubMed] [Google Scholar]
- 412.Bachi A, Dalle-Donne I, Scaloni A. Chem Rev. 2012 [Google Scholar]
- 413.Lindahl M, Mata-Cabana A, Kieselbach T. Antioxid Redox Signal. 2011;14:2581. doi: 10.1089/ars.2010.3551. [DOI] [PubMed] [Google Scholar]
- 414.Nakamura T, Cho DH, Lipton SA. Exp Neurol. 2012;238:12. doi: 10.1016/j.expneurol.2012.06.032. [DOI] [PMC free article] [PubMed] [Google Scholar]
- 415.Wiseman DA, Thurmond DC. Curr Diabetes Rev. 2012;8:303. doi: 10.2174/157339912800840514. [DOI] [PMC free article] [PubMed] [Google Scholar]
- 416.Wang Z. Cancer Lett. 2012;320:123. doi: 10.1016/j.canlet.2012.03.009. [DOI] [PubMed] [Google Scholar]
- 417.Murphy E, Kohr M, Sun J, Nguyen T, Steenbergen C. J Mol Cell Cardiol. 2012;52:568. doi: 10.1016/j.yjmcc.2011.08.021. [DOI] [PMC free article] [PubMed] [Google Scholar]
- 418.Jaffrey SR, Snyder SH. Sci STKE. 2001;2001:pl1. doi: 10.1126/stke.2001.86.pl1. [DOI] [PubMed] [Google Scholar]
- 419.Forrester MT, Thompson JW, Foster MW, Nogueira L, Moseley MA, Stamler JS. Nat Biotechnol. 2009;27:557. doi: 10.1038/nbt.1545. [DOI] [PMC free article] [PubMed] [Google Scholar]
- 420.Baerenfaller K, Grossmann J, Grobei MA, Hull R, Hirsch-Hoffmann M, Yalovsky S, Zimmermann P, Grossniklaus U, Gruissem W, Baginsky S. Science. 2008;320:938. doi: 10.1126/science.1157956. [DOI] [PubMed] [Google Scholar]
- 421.Beck M, Schmidt A, Malmstroem J, Claassen M, Ori A, Szymborska A, Herzog F, Rinner O, Ellenberg J, Aebersold R. Mol Syst Biol. 2011;7:549. doi: 10.1038/msb.2011.82. [DOI] [PMC free article] [PubMed] [Google Scholar]
- 422.Nagaraj N, Wisniewski JR, Geiger T, Cox J, Kircher M, Kelso J, Paabo S, Mann M. Mol Syst Biol. 2011;7:548. doi: 10.1038/msb.2011.81. [DOI] [PMC free article] [PubMed] [Google Scholar]
- 423.Corthals GL, Wasinger VC, Hochstrasser DF, Sanchez JC. Electrophoresis. 2000;21:1104. doi: 10.1002/(SICI)1522-2683(20000401)21:6<1104::AID-ELPS1104>3.0.CO;2-C. [DOI] [PubMed] [Google Scholar]
- 424.Bondarenko PV, Chelius D, Shaler TA. Anal Chem. 2002;74:4741. doi: 10.1021/ac0256991. [DOI] [PubMed] [Google Scholar]
- 425.Chelius D, Bondarenko PV. J Proteome Res. 2002;1:317. doi: 10.1021/pr025517j. [DOI] [PubMed] [Google Scholar]
- 426.Wang W, Zhou H, Lin H, Roy S, Shaler TA, Hill LR, Norton S, Kumar P, Anderle M, Becker CH. Anal Chem. 2003;75:4818. doi: 10.1021/ac026468x. [DOI] [PubMed] [Google Scholar]
- 427.Wiener MC, Sachs JR, Deyanova EG, Yates NA. Anal Chem. 2004;76:6085. doi: 10.1021/ac0493875. [DOI] [PubMed] [Google Scholar]
- 428.Higgs RE, Knierman MD, Gelfanova V, Butler JP, Hale JE. Methods Mol Biol. 2008;428:209. doi: 10.1007/978-1-59745-117-8_12. [DOI] [PubMed] [Google Scholar]
- 429.Liu H, Sadygov RG, Yates JR., 3rd Anal Chem. 2004;76:4193. doi: 10.1021/ac0498563. [DOI] [PubMed] [Google Scholar]
- 430.Gilchrist A, Au CE, Hiding J, Bell AW, Fernandez-Rodriguez J, Lesimple S, Nagaya H, Roy L, Gosline SJ, Hallett M, Paiement J, Kearney RE, Nilsson T, Bergeron JJ. Cell. 2006;127:1265. doi: 10.1016/j.cell.2006.10.036. [DOI] [PubMed] [Google Scholar]
- 431.Gygi SP, Rist B, Gerber SA, Turecek F, Gelb MH, Aebersold R. Nat Biotechnol. 1999;17:994. doi: 10.1038/13690. [DOI] [PubMed] [Google Scholar]
- 432.Smolka MB, Zhou H, Purkayastha S, Aebersold R. Anal Biochem. 2001;297:25. doi: 10.1006/abio.2001.5318. [DOI] [PubMed] [Google Scholar]
- 433.Regnier FE, Riggs L, Zhang R, Xiong L, Liu P, Chakraborty A, Seeley E, Sioma C, Thompson RA. J Mass Spectrom. 2002;37:133. doi: 10.1002/jms.290. [DOI] [PubMed] [Google Scholar]
- 434.Oda Y, Owa T, Sato T, Boucher B, Daniels S, Yamanaka H, Shinohara Y, Yokoi A, Kuromitsu J, Nagasu T. Anal Chem. 2003;75:2159. doi: 10.1021/ac026196y. [DOI] [PubMed] [Google Scholar]
- 435.Li J, Steen H, Gygi SP. Mol Cell Proteomics. 2003;2:1198. doi: 10.1074/mcp.M300070-MCP200. [DOI] [PubMed] [Google Scholar]
- 436.Hansen KC, Schmitt-Ulms G, Chalkley RJ, Hirsch J, Baldwin MA, Burlingame AL. Mol Cell Proteomics. 2003;2:299. doi: 10.1074/mcp.M300021-MCP200. [DOI] [PubMed] [Google Scholar]
- 437.Schmidt A, Kellermann J, Lottspeich F. Proteomics. 2005;5:4. doi: 10.1002/pmic.200400873. [DOI] [PubMed] [Google Scholar]
- 438.Hsu JL, Huang SY, Chow NH, Chen SH. Anal Chem. 2003;75:6843. doi: 10.1021/ac0348625. [DOI] [PubMed] [Google Scholar]
- 439.Boersema PJ, Raijmakers R, Lemeer S, Mohammed S, Heck AJ. Nat Protoc. 2009;4:484. doi: 10.1038/nprot.2009.21. [DOI] [PubMed] [Google Scholar]
- 440.Reynolds KJ, Yao X, Fenselau C. J Proteome Res. 2002;1:27. doi: 10.1021/pr0100016. [DOI] [PubMed] [Google Scholar]
- 441.Reynolds KJ, Yao XD, Fenselau C. Journal of Proteome Research. 2002;1:27. doi: 10.1021/pr0100016. [DOI] [PubMed] [Google Scholar]
- 442.Yao X, Freas A, Ramirez J, Demirev PA, Fenselau C. Anal Chem. 2001;73:2836. doi: 10.1021/ac001404c. [DOI] [PubMed] [Google Scholar]
- 443.Julka S, Regnier F. J Proteome Res. 2004;3:350. doi: 10.1021/pr0340734. [DOI] [PubMed] [Google Scholar]
- 444.Johnson KL, Muddiman DC. J Am Soc Mass Spectrom. 2004;15:437. doi: 10.1016/j.jasms.2003.11.016. [DOI] [PubMed] [Google Scholar]
- 445.Ramos-Fernandez A, Lopez-Ferrer D, Vazquez J. Mol Cell Proteomics. 2007;6:1274. doi: 10.1074/mcp.T600029-MCP200. [DOI] [PubMed] [Google Scholar]
- 446.Yao X, Afonso C, Fenselau C. J Proteome Res. 2003;2:147. doi: 10.1021/pr025572s. [DOI] [PubMed] [Google Scholar]
- 447.Mason CJ, Therneau TM, Eckel-Passow JE, Johnson KL, Oberg AL, Olson JE, Nair KS, Muddiman DC, Bergen HR., 3rd Mol Cell Proteomics. 2007;6:305. doi: 10.1074/mcp.M600148-MCP200. [DOI] [PubMed] [Google Scholar]
- 448.Langen H, Fountoulakis M, Evers S, Wipf B, Berndt P. Wiley-VCH; Weinheim, Germany: 1998. [Google Scholar]
- 449.Oda Y, Huang K, Cross FR, Cowburn D, Chait BT. Proc Natl Acad Sci U S A. 1999;96:6591. doi: 10.1073/pnas.96.12.6591. [DOI] [PMC free article] [PubMed] [Google Scholar]
- 450.Conrads TP, Alving K, Veenstra TD, Belov ME, Anderson GA, Anderson DJ, Lipton MS, Pasa-Tolic L, Udseth HR, Chrisler WB, Thrall BD, Smith RD. Anal Chem. 2001;73:2132. doi: 10.1021/ac001487x. [DOI] [PubMed] [Google Scholar]
- 451.Ishihama Y, Sato T, Tabata T, Miyamoto N, Sagane K, Nagasu T, Oda Y. Nat Biotechnol. 2005;23:617. doi: 10.1038/nbt1086. [DOI] [PubMed] [Google Scholar]
- 452.Palmblad M, Bindschedler LV, Cramer R. Proteomics. 2007;7:3462. doi: 10.1002/pmic.200700180. [DOI] [PubMed] [Google Scholar]
- 453.Huttlin EL, Hegeman AD, Harms AC, Sussman MR. Mol Cell Proteomics. 2007;6:860. doi: 10.1074/mcp.M600347-MCP200. [DOI] [PubMed] [Google Scholar]
- 454.Schaff JE, Mbeunkui F, Blackburn K, Bird DM, Goshe MB. Plant J. 2008;56:840. doi: 10.1111/j.1365-313X.2008.03639.x. [DOI] [PubMed] [Google Scholar]
- 455.Nelson CJ, Huttlin EL, Hegeman AD, Harms AC, Sussman MR. Proteomics. 2007;7:1279. doi: 10.1002/pmic.200600832. [DOI] [PubMed] [Google Scholar]
- 456.Krijgsveld J, Ketting RF, Mahmoudi T, Johansen J, Artal-Sanz M, Verrijzer CP, Plasterk RH, Heck AJ. Nat Biotechnol. 2003;21:927. doi: 10.1038/nbt848. [DOI] [PubMed] [Google Scholar]
- 457.Dong MQ, Venable JD, Au N, Xu T, Park SK, Cociorva D, Johnson JR, Dillin A, Yates JR., 3rd Science. 2007;317:660. doi: 10.1126/science.1139952. [DOI] [PubMed] [Google Scholar]
- 458.McClatchy DB, Dong MQ, Wu CC, Venable JD, Yates JR. Journal of Proteome Research. 2007;6:2005. doi: 10.1021/pr060599n. [DOI] [PMC free article] [PubMed] [Google Scholar]
- 459.Wu CC, MacCoss MJ, Howell KE, Matthews DE, Yates JR., 3rd Anal Chem. 2004;76:4951. doi: 10.1021/ac049208j. [DOI] [PubMed] [Google Scholar]
- 460.Zhang Y, Filiou MD, Reckow S, Gormanns P, Maccarrone G, Kessler MS, Frank E, Hambsch B, Holsboer F, Landgraf R, Turck CW. Mol Cell Proteomics. 2011;10:M111 008110. doi: 10.1074/mcp.M111.008110. [DOI] [PMC free article] [PubMed] [Google Scholar]
- 461.Liao L, McClatchy DB, Park SK, Xu T, Lu B, Yates JR., 3rd J Proteome Res. 2008;7:4743. doi: 10.1021/pr8003198. [DOI] [PMC free article] [PubMed] [Google Scholar]
- 462.Ong SE, Blagoev B, Kratchmarova I, Kristensen DB, Steen H, Pandey A, Mann M. Mol Cell Proteomics. 2002;1:376. doi: 10.1074/mcp.m200025-mcp200. [DOI] [PubMed] [Google Scholar]
- 463.Kruger M, Moser M, Ussar S, Thievessen I, Luber CA, Forner F, Schmidt S, Zanivan S, Fassler R, Mann M. Cell. 2008;134:353. doi: 10.1016/j.cell.2008.05.033. [DOI] [PubMed] [Google Scholar]
- 464.Sury MD, Chen JX, Selbach M. Mol Cell Proteomics. 2010;9:2173. doi: 10.1074/mcp.M110.000323. [DOI] [PMC free article] [PubMed] [Google Scholar]
- 465.Hilger M, Mann M. J Proteome Res. 2012;11:982. doi: 10.1021/pr200740a. [DOI] [PMC free article] [PubMed] [Google Scholar]
- 466.Tomazela DM, Patterson BW, Hanson E, Spence KL, Kanion TB, Salinger DH, Vicini P, Barret H, Heins HB, Cole FS, Hamvas A, MacCoss MJ. Anal Chem. 2010;82:2561. doi: 10.1021/ac1001433. [DOI] [PMC free article] [PubMed] [Google Scholar]
- 467.Liao L, Sando RC, Farnum JB, Vanderklish PW, Maximov A, Yates JR. J Proteome Res. 2012;11:1341. doi: 10.1021/pr200987h. [DOI] [PMC free article] [PubMed] [Google Scholar]
- 468.Geiger T, Cox J, Ostasiewicz P, Wisniewski JR, Mann M. Nat Methods. 2010;7:383. doi: 10.1038/nmeth.1446. [DOI] [PubMed] [Google Scholar]
- 469.Ross PL, Huang YN, Marchese JN, Williamson B, Parker K, Hattan S, Khainovski N, Pillai S, Dey S, Daniels S, Purkayastha S, Juhasz P, Martin S, Bartlet-Jones M, He F, Jacobson A, Pappin DJ. Mol Cell Proteomics. 2004;3:1154. doi: 10.1074/mcp.M400129-MCP200. [DOI] [PubMed] [Google Scholar]
- 470.Thompson A, Schafer J, Kuhn K, Kienle S, Schwarz J, Schmidt G, Neumann T, Johnstone R, Mohammed AK, Hamon C. Anal Chem. 2003;75:1895. doi: 10.1021/ac0262560. [DOI] [PubMed] [Google Scholar]
- 471.Dayon L, Hainard A, Licker V, Turck N, Kuhn K, Hochstrasser DF, Burkhard PR, Sanchez JC. Anal Chem. 2008;80:2921. doi: 10.1021/ac702422x. [DOI] [PubMed] [Google Scholar]
- 472.Ow SY, Cardona T, Taton A, Magnuson A, Lindblad P, Stensjo K, Wright PC. J Proteome Res. 2008;7:1615. doi: 10.1021/pr700604v. [DOI] [PubMed] [Google Scholar]
- 473.Louris JN, Cooks RG, Syka JEP, Kelley PE, Stafford GC, Todd JFJ. Analytical Chemistry. 1987;59:1677. [Google Scholar]
- 474.Cunningham C, Glish GL, Burinsky DJ. Journal of the American Society for Mass Spectrometry. 2006;17:81. doi: 10.1016/j.jasms.2005.09.007. [DOI] [PubMed] [Google Scholar]
- 475.Kocher T, Pichler P, Schutzbier M, Stingl C, Kaul A, Teucher N, Hasenfuss G, Penninger JM, Mechtler K. J Proteome Res. 2009;8:4743. doi: 10.1021/pr900451u. [DOI] [PubMed] [Google Scholar]
- 476.Ow SY, Salim M, Noirel J, Evans C, Rehman I, Wright PC. J Proteome Res. 2009;8:5347. doi: 10.1021/pr900634c. [DOI] [PubMed] [Google Scholar]
- 477.Karp NA, Huber W, Sadowski PG, Charles PD, Hester SV, Lilley KS. Mol Cell Proteomics. 2010;9:1885. doi: 10.1074/mcp.M900628-MCP200. [DOI] [PMC free article] [PubMed] [Google Scholar]
- 478.Ting L, Rad R, Gygi SP, Haas W. Nat Methods. 2011;8:937. doi: 10.1038/nmeth.1714. [DOI] [PMC free article] [PubMed] [Google Scholar]
- 479.Wenger CD, Lee MV, Hebert AS, McAlister GC, Phanstiel DH, Westphall MS, Coon JJ. Nat Methods. 2011;8:933. doi: 10.1038/nmeth.1716. [DOI] [PMC free article] [PubMed] [Google Scholar]
- 480.Bantscheff M, Schirle M, Sweetman G, Rick J, Kuster B. Anal Bioanal Chem. 2007;389:1017. doi: 10.1007/s00216-007-1486-6. [DOI] [PubMed] [Google Scholar]
- 481.Asara JM, Christofk HR, Freimark LM, Cantley LC. Proteomics. 2008;8:994. doi: 10.1002/pmic.200700426. [DOI] [PubMed] [Google Scholar]
- 482.Nesvizhskii AI, Keller A, Kolker E, Aebersold R. Anal Chem. 2003;75:4646. doi: 10.1021/ac0341261. [DOI] [PubMed] [Google Scholar]
- 483.Cutillas PR, Vanhaesebroeck B. Mol Cell Proteomics. 2007;6:1560. doi: 10.1074/mcp.M700037-MCP200. [DOI] [PubMed] [Google Scholar]
- 484.Ishihama Y, Oda Y, Tabata T, Sato T, Nagasu T, Rappsilber J, Mann M. Mol Cell Proteomics. 2005;4:1265. doi: 10.1074/mcp.M500061-MCP200. [DOI] [PubMed] [Google Scholar]
- 485.Braisted JC, Kuntumalla S, Vogel C, Marcotte EM, Rodrigues AR, Wang R, Huang ST, Ferlanti ES, Saeed AI, Fleischmann RD, Peterson SN, Pieper R. BMC Bioinformatics. 2008;9:529. doi: 10.1186/1471-2105-9-529. [DOI] [PMC free article] [PubMed] [Google Scholar]
- 486.Malmstrom J, Beck M, Schmidt A, Lange V, Deutsch EW, Aebersold R. Nature. 2009;460:762. doi: 10.1038/nature08184. [DOI] [PMC free article] [PubMed] [Google Scholar]
- 487.Podwojski K, Eisenacher M, Kohl M, Turewicz M, Meyer HE, Rahnenfuhrer J, Stephan C. Expert Rev Proteomics. 2010;7:249. doi: 10.1586/epr.09.107. [DOI] [PubMed] [Google Scholar]
- 488.Listgarten J, Emili A. Mol Cell Proteomics. 2005;4:419. doi: 10.1074/mcp.R500005-MCP200. [DOI] [PubMed] [Google Scholar]
- 489.Silva JC, Denny R, Dorschel CA, Gorenstein M, Kass IJ, Li GZ, McKenna T, Nold MJ, Richardson K, Young P, Geromanos S. Anal Chem. 2005;77:2187. doi: 10.1021/ac048455k. [DOI] [PubMed] [Google Scholar]
- 490.Griffin NM, Yu J, Long F, Oh P, Shore S, Li Y, Koziol JA, Schnitzer JE. Nat Biotechnol. doi: 10.1038/nbt.1592. [DOI] [PMC free article] [PubMed] [Google Scholar]
- 491.Carvalho PC, Han X, Xu T, Cociorva D, da Carvalho MG, Barbosa VC, Yates JR., 3rd Bioinformatics. 2010;26:847. doi: 10.1093/bioinformatics/btq031. [DOI] [PMC free article] [PubMed] [Google Scholar]
- 492.Mueller LN, Brusniak MY, Mani DR, Aebersold R. J Proteome Res. 2008;7:51. doi: 10.1021/pr700758r. [DOI] [PubMed] [Google Scholar]
- 493.Mann B, Madera M, Sheng Q, Tang H, Mechref Y, Novotny MV. Rapid Commun Mass Spectrom. 2008;22:3823. doi: 10.1002/rcm.3781. [DOI] [PubMed] [Google Scholar]
- 494.Tsou CC, Tsai CF, Tsui YH, Sudhir PR, Wang YT, Chen YJ, Chen JY, Sung TY, Hsu WL. Mol Cell Proteomics. 2010;9:131. doi: 10.1074/mcp.M900177-MCP200. [DOI] [PMC free article] [PubMed] [Google Scholar]
- 495.Eng JK, McCormack AL, Yates JR., III J Am Soc Mass Spectrom. 1994;5:976. doi: 10.1016/1044-0305(94)80016-2. [DOI] [PubMed] [Google Scholar]
- 496.Perkins DN, Pappin DJ, Creasy DM, Cottrell JS. Electrophoresis. 1999;20:3551. doi: 10.1002/(SICI)1522-2683(19991201)20:18<3551::AID-ELPS3551>3.0.CO;2-2. [DOI] [PubMed] [Google Scholar]
- 497.Craig R, Beavis RC. Bioinformatics. 2004;20:1466. doi: 10.1093/bioinformatics/bth092. [DOI] [PubMed] [Google Scholar]
- 498.Mueller LN, Rinner O, Schmidt A, Letarte S, Bodenmiller B, Brusniak MY, Vitek O, Aebersold R, Muller M. Proteomics. 2007;7:3470. doi: 10.1002/pmic.200700057. [DOI] [PubMed] [Google Scholar]
- 499.Jaffe JD, Mani DR, Leptos KC, Church GM, Gillette MA, Carr SA. Mol Cell Proteomics. 2006;5:1927. doi: 10.1074/mcp.M600222-MCP200. [DOI] [PMC free article] [PubMed] [Google Scholar]
- 500.Park SK, Venable JD, Xu T, Yates JR., 3rd Nat Methods. 2008;5:319. doi: 10.1038/nmeth.1195. [DOI] [PMC free article] [PubMed] [Google Scholar]
- 501.Lai X, Wang L, Tang H, Witzmann FA. J Proteome Res. 2011;10:4799. doi: 10.1021/pr2005633. [DOI] [PMC free article] [PubMed] [Google Scholar]
- 502.MacLean B, Tomazela DM, Shulman N, Chambers M, Finney GL, Frewen B, Kern R, Tabb DL, Liebler DC, MacCoss MJ. Bioinformatics. 2010;26:966. doi: 10.1093/bioinformatics/btq054. [DOI] [PMC free article] [PubMed] [Google Scholar]
- 503.Schilling B, Rardin MJ, MacLean BX, Zawadzka AM, Frewen BE, Cusack MP, Sorensen DJ, Bereman MS, Jing E, Wu CC, Verdin E, Kahn CR, Maccoss MJ, Gibson BW. Mol Cell Proteomics. 2012;11:202. doi: 10.1074/mcp.M112.017707. [DOI] [PMC free article] [PubMed] [Google Scholar]
- 504.Bowers GN, Jr, Fassett JD, White Et. Anal Chem. 1993;65:475R. doi: 10.1021/ac00060a620. [DOI] [PubMed] [Google Scholar]
- 505.Gerber SA, Rush J, Stemman O, Kirschner MW, Gygi SP. Proc Natl Acad Sci U S A. 2003;100:6940. doi: 10.1073/pnas.0832254100. [DOI] [PMC free article] [PubMed] [Google Scholar]
- 506.Beynon RJ, Doherty MK, Pratt JM, Gaskell SJ. Nat Methods. 2005;2:587. doi: 10.1038/nmeth774. [DOI] [PubMed] [Google Scholar]
- 507.Brun V, Dupuis A, Adrait A, Marcellin M, Thomas D, Court M, Vandenesch F, Garin J. Mol Cell Proteomics. 2007;6:2139. doi: 10.1074/mcp.M700163-MCP200. [DOI] [PubMed] [Google Scholar]
- 508.Hanke S, Besir H, Oesterhelt D, Mann M. J Proteome Res. 2008;7:1118. doi: 10.1021/pr7007175. [DOI] [PubMed] [Google Scholar]
- 509.Coppinger JA, Hutt DM, Razvi A, Koulov AV, Pankow S, Yates JR, 3rd, Balch WE. PLoS One. 2012;7:e37682. doi: 10.1371/journal.pone.0037682. [DOI] [PMC free article] [PubMed] [Google Scholar]
- 510.Kirkpatrick DS, Gerber SA, Gygi SP. Methods. 2005;35:265. doi: 10.1016/j.ymeth.2004.08.018. [DOI] [PubMed] [Google Scholar]
- 511.Gerber SA, Kettenbach AN, Rush J, Gygi SP. Methods Mol Biol. 2007;359:71. doi: 10.1007/978-1-59745-255-7_5. [DOI] [PubMed] [Google Scholar]
- 512.Mayya V, Rezual K, Wu L, Fong MB, Han DK. Mol Cell Proteomics. 2006;5:1146. doi: 10.1074/mcp.T500029-MCP200. [DOI] [PubMed] [Google Scholar]
- 513.Havlis J, Shevchenko A. Anal Chem. 2004;76:3029. doi: 10.1021/ac035286f. [DOI] [PubMed] [Google Scholar]
- 514.Brownridge P, Holman SW, Gaskell SJ, Grant CM, Harman VM, Hubbard SJ, Lanthaler K, Lawless C, O’Cualain R, Sims P, Watkins R, Beynon RJ. Proteomics. 2011;11:2957. doi: 10.1002/pmic.201100039. [DOI] [PubMed] [Google Scholar]
- 515.Zhao Y, Jia W, Sun W, Jin W, Guo L, Wei J, Ying W, Zhang Y, Xie Y, Jiang Y, He F, Qian X. J Proteome Res. 2010;9:3319. doi: 10.1021/pr9011969. [DOI] [PubMed] [Google Scholar]
- 516.Dephoure N, Gygi SP. Sci Signal. 2012;5:rs2. doi: 10.1126/scisignal.2002548. [DOI] [PMC free article] [PubMed] [Google Scholar]
- 517.Noble WS. Nat Biotechnol. 2009;27:1135. doi: 10.1038/nbt1209-1135. [DOI] [PMC free article] [PubMed] [Google Scholar]
- 518.Pavelka N, Fournier ML, Swanson SK, Pelizzola M, Ricciardi-Castagnoli P, Florens L, Washburn MP. Mol Cell Proteomics. 2008;7:631. doi: 10.1074/mcp.M700240-MCP200. [DOI] [PubMed] [Google Scholar]
- 519.Hill EG, Schwacke JH, Comte-Walters S, Slate EH, Oberg AL, Eckel-Passow JE, Therneau TM, Schey KL. J Proteome Res. 2008;7:3091. doi: 10.1021/pr070520u. [DOI] [PMC free article] [PubMed] [Google Scholar]
- 520.Oberg AL, Mahoney DW, Eckel-Passow JE, Malone CJ, Wolfinger RD, Hill EG, Cooper LT, Onuma OK, Spiro C, Therneau TM, Bergen HR., 3rd J Proteome Res. 2008;7:225. doi: 10.1021/pr700734f. [DOI] [PMC free article] [PubMed] [Google Scholar]
- 521.Bonferroni CE. Pubblicazioni del R Istituto Superiore di Scienze Economiche e Commerciali di Firenze. 1936;8:3. [Google Scholar]
- 522.Benjamini Y, Hochberg Y. Journal of the Royal Statistical Society Series B-Methodological. 1995;57:289. [Google Scholar]
- 523.Storey JD, Tibshirani R. Proc Natl Acad Sci U S A. 2003;100:9440. doi: 10.1073/pnas.1530509100. [DOI] [PMC free article] [PubMed] [Google Scholar]
- 524.Margolin AA, Ong SE, Schenone M, Gould R, Schreiber SL, Carr SA, Golub TR. PLoS One. 2009;4:e7454. doi: 10.1371/journal.pone.0007454. [DOI] [PMC free article] [PubMed] [Google Scholar]
- 525.Zhang B, VerBerkmoes NC, Langston MA, Uberbacher E, Hettich RL, Samatova NF. J Proteome Res. 2006;5:2909. doi: 10.1021/pr0600273. [DOI] [PubMed] [Google Scholar]
- 526.Choi H, Fermin D, Nesvizhskii AI. Mol Cell Proteomics. 2008;7:2373. doi: 10.1074/mcp.M800203-MCP200. [DOI] [PMC free article] [PubMed] [Google Scholar]
- 527.Dai L, Li C, Shedden KA, Lee CJ, Quoc H, Simeone DM, Lubman DM. J Proteome Res. 2010;9:3394. doi: 10.1021/pr100231m. [DOI] [PMC free article] [PubMed] [Google Scholar]
- 528.Wang LH, Li DQ, Fu Y, Wang HP, Zhang JF, Yuan ZF, Sun RX, Zeng R, He SM, Gao W. Rapid Commun Mass Spectrom. 2007;21:2985. doi: 10.1002/rcm.3173. [DOI] [PubMed] [Google Scholar]
- 529.Cox J, Matic I, Hilger M, Nagaraj N, Selbach M, Olsen JV, Mann M. Nat Protoc. 2009;4:698. doi: 10.1038/nprot.2009.36. [DOI] [PubMed] [Google Scholar]
- 530.Deutsch EW, Mendoza L, Shteynberg D, Farrah T, Lam H, Tasman N, Sun Z, Nilsson E, Pratt B, Prazen B, Eng JK, Martin DB, Nesvizhskii AI, Aebersold R. Proteomics. 2010;10:1150. doi: 10.1002/pmic.200900375. [DOI] [PMC free article] [PubMed] [Google Scholar]
- 531.Bell AW, Deutsch EW, Au CE, Kearney RE, Beavis R, Sechi S, Nilsson T, Bergeron JJ. Nat Methods. 2009;6:423. [Google Scholar]
- 532.Kinsinger CR, Apffel J, Baker M, Bian X, Borchers CH, Bradshaw R, Brusniak MY, Chan DW, Deutsch EW, Domon B, Gorman J, Grimm R, Hancock W, Hermjakob H, Horn D, Hunter C, Kolar P, Kraus HJ, Langen H, Linding R, Moritz RL, Omenn GS, Orlando R, Pandey A, Ping P, Rahbar A, Rivers R, Seymour SL, Simpson RJ, Slotta D, Smith RD, Stein SE, Tabb DL, Tagle D, Yates JR, Rodriguez H. J Proteome Res. 2012;11:1412. doi: 10.1021/pr201071t. [DOI] [PMC free article] [PubMed] [Google Scholar]
- 533.Han MJ, Lee SY. Microbiol Mol Biol Rev. 2006;70:362. doi: 10.1128/MMBR.00036-05. [DOI] [PMC free article] [PubMed] [Google Scholar]
- 534.Paulovich AG, Billheimer D, Ham AJ, Vega-Montoto L, Rudnick PA, Tabb DL, Wang P, Blackman RK, Bunk DM, Cardasis HL, Clauser KR, Kinsinger CR, Schilling B, Tegeler TJ, Variyath AM, Wang M, Whiteaker JR, Zimmerman LJ, Fenyo D, Carr SA, Fisher SJ, Gibson BW, Mesri M, Neubert TA, Regnier FE, Rodriguez H, Spiegelman C, Stein SE, Tempst P, Liebler DC. Mol Cell Proteomics. 2010;9:242. doi: 10.1074/mcp.M900222-MCP200. [DOI] [PMC free article] [PubMed] [Google Scholar]
- 535.Bohrer BC, Li YF, Reilly JP, Clemmer DE, DiMarchi RD, Radivojac P, Tang H, Arnold RJ. Anal Chem. 2010;82:6559. doi: 10.1021/ac100910a. [DOI] [PMC free article] [PubMed] [Google Scholar]
- 536.Vaudel M, Burkhart JM, Breiter D, Zahedi RP, Sickmann A, Martens L. J Proteome Res. 2012;11:5065. doi: 10.1021/pr300055q. [DOI] [PubMed] [Google Scholar]
- 537.Rudnick PA, Clauser KR, Kilpatrick LE, Tchekhovskoi DV, Neta P, Blonder N, Billheimer DD, Blackman RK, Bunk DM, Cardasis HL, Ham AJ, Jaffe JD, Kinsinger CR, Mesri M, Neubert TA, Schilling B, Tabb DL, Tegeler TJ, Vega-Montoto L, Variyath AM, Wang M, Wang P, Whiteaker JR, Zimmerman LJ, Carr SA, Fisher SJ, Gibson BW, Paulovich AG, Regnier FE, Rodriguez H, Spiegelman C, Tempst P, Liebler DC, Stein SE. Mol Cell Proteomics. 2010;9:225. doi: 10.1074/mcp.M900223-MCP200. [DOI] [PMC free article] [PubMed] [Google Scholar]
- 538.Sigmon I, Lee LW, Chang DK, Krusberski N, Cohen D, Eng JK, Martin DB. Anal Chem. 2010;82:5060. doi: 10.1021/ac100043x. [DOI] [PubMed] [Google Scholar]
- 539.Scheltema RA, Mann M. J Proteome Res. 2012 doi: 10.1021/pr201219e. [DOI] [PubMed] [Google Scholar]
- 540.Barboza R, Cociorva D, Xu T, Barbosa VC, Perales J, Valente RH, Franca FM, Yates JR, 3rd, Carvalho PC. Proteomics. 2011;11:4105. doi: 10.1002/pmic.201100297. [DOI] [PMC free article] [PubMed] [Google Scholar]
- 541.Yates JR, 3rd, Park SK, Delahunty CM, Xu T, Savas JN, Cociorva D, Carvalho PC. Nat Methods. 2012;9:455. doi: 10.1038/nmeth.1983. [DOI] [PMC free article] [PubMed] [Google Scholar]
- 542.Hunt DF, Yates JR, 3rd, Shabanowitz J, Winston S, Hauer CR. Proc Natl Acad Sci U S A. 1986;83:6233. doi: 10.1073/pnas.83.17.6233. [DOI] [PMC free article] [PubMed] [Google Scholar]
- 543.Sadygov RG, Cociorva D, Yates JR., 3rd Nat Methods. 2004;1:195. doi: 10.1038/nmeth725. [DOI] [PubMed] [Google Scholar]
- 544.Choi H, Ghosh D, Nesvizhskii AI. J Proteome Res. 2008;7:286. doi: 10.1021/pr7006818. [DOI] [PubMed] [Google Scholar]
- 545.Choi H, Nesvizhskii AI. J Proteome Res. 2008;7:254. doi: 10.1021/pr070542g. [DOI] [PubMed] [Google Scholar]
- 546.Fenyo D, Beavis RC. Anal Chem. 2003;75:768. doi: 10.1021/ac0258709. [DOI] [PubMed] [Google Scholar]
- 547.Craig R, Beavis RC. Rapid Commun Mass Spectrom. 2003;17:2310. doi: 10.1002/rcm.1198. [DOI] [PubMed] [Google Scholar]
- 548.Alves G, Wu WW, Wang G, Shen RF, Yu YK. J Proteome Res. 2008;7:3102. doi: 10.1021/pr700798h. [DOI] [PMC free article] [PubMed] [Google Scholar]
- 549.Searle BC, Turner M, Nesvizhskii AI. J Proteome Res. 2008;7:245. doi: 10.1021/pr070540w. [DOI] [PubMed] [Google Scholar]
- 550.Narasimhan C, Tabb DL, Verberkmoes NC, Thompson MR, Hettich RL, Uberbacher EC. Anal Chem. 2005;77:7581. doi: 10.1021/ac0501745. [DOI] [PubMed] [Google Scholar]
- 551.Tabb DL, Fernando CG, Chambers MC. J Proteome Res. 2007;6:654. doi: 10.1021/pr0604054. [DOI] [PMC free article] [PubMed] [Google Scholar]
- 552.Li W, Ji L, Goya J, Tan G, Wysocki VH. J Proteome Res. 2011;10:1593. doi: 10.1021/pr100959y. [DOI] [PMC free article] [PubMed] [Google Scholar]
- 553.Sadygov RG, Eng J, Durr E, Saraf A, McDonald H, MacCoss MJ, Yates JR., 3rd J Proteome Res. 2002;1:211. doi: 10.1021/pr015514r. [DOI] [PubMed] [Google Scholar]
- 554.Tabb DL, Narasimhan C, Strader MB, Hettich RL. Anal Chem. 2005;77:2464. doi: 10.1021/ac0487000. [DOI] [PubMed] [Google Scholar]
- 555.Eng JK, Fischer B, Grossmann J, Maccoss MJ. J Proteome Res. 2008;7:4598. doi: 10.1021/pr800420s. [DOI] [PubMed] [Google Scholar]
- 556.Diament BJ, Noble WS. J Proteome Res. 2011;10:3871. doi: 10.1021/pr101196n. [DOI] [PMC free article] [PubMed] [Google Scholar]
- 557.Xu T, Venable JD, Park SK, Cociorva D, Lu B, Liao L, Wohlschlegel J, Hewel J, Yates JR., 3rd Mol Cell Proteomics. 2006;5:S174. [Google Scholar]
- 558.Lu B, Motoyama A, Ruse C, Venable J, Yates JR., 3rd Anal Chem. 2008;80:2018. doi: 10.1021/ac701697w. [DOI] [PMC free article] [PubMed] [Google Scholar]
- 559.Savitski MM, Mathieson T, Becher I, Bantscheff M. J Proteome Res. 2010;9:5511. doi: 10.1021/pr1006813. [DOI] [PubMed] [Google Scholar]
- 560.Cox J, Neuhauser N, Michalski A, Scheltema RA, Olsen JV, Mann M. J Proteome Res. 2011;10:1794. doi: 10.1021/pr101065j. [DOI] [PubMed] [Google Scholar]
- 561.Brosch M, Swamy S, Hubbard T, Choudhary J. Mol Cell Proteomics. 2008;7:962. doi: 10.1074/mcp.M700293-MCP200. [DOI] [PMC free article] [PubMed] [Google Scholar]
- 562.Arifuzzaman M, Maeda M, Itoh A, Nishikata K, Takita C, Saito R, Ara T, Nakahigashi K, Huang HC, Hirai A, Tsuzuki K, Nakamura S, Altaf-Ul-Amin M, Oshima T, Baba T, Yamamoto N, Kawamura T, Ioka-Nakamichi T, Kitagawa M, Tomita M, Kanaya S, Wada C, Mori H. Genome Res. 2006;16:686. doi: 10.1101/gr.4527806. [DOI] [PMC free article] [PubMed] [Google Scholar]
- 563.Graumann J, Scheltema RA, Zhang Y, Cox J, Mann M. Mol Cell Proteomics. 2012;11:M111 013185. doi: 10.1074/mcp.M111.013185. [DOI] [PMC free article] [PubMed] [Google Scholar]
- 564.Bailey DJ, Rose CM, McAlister GC, Brumbaugh J, Yu P, Wenger CD, Westphall MS, Thomson JA, Coon JJ. Proc Natl Acad Sci U S A. 2012;109:8411. doi: 10.1073/pnas.1205292109. [DOI] [PMC free article] [PubMed] [Google Scholar]
- 565.Xu M, Li L. J Proteome Res. 2011;10:3632. doi: 10.1021/pr200273r. [DOI] [PubMed] [Google Scholar]
- 566.Tabb DL, Saraf A, Yates JR., 3rd Anal Chem. 2003;75:6415. doi: 10.1021/ac0347462. [DOI] [PMC free article] [PubMed] [Google Scholar]
- 567.Frank A, Tanner S, Bafna V, Pevzner P. J Proteome Res. 2005;4:1287. doi: 10.1021/pr050011x. [DOI] [PubMed] [Google Scholar]
- 568.Cao X, Nesvizhskii AI. J Proteome Res. 2008;7:4422. doi: 10.1021/pr800400q. [DOI] [PMC free article] [PubMed] [Google Scholar]
- 569.Tabb DL, Ma ZQ, Martin DB, Ham AJ, Chambers MC. J Proteome Res. 2008;7:3838. doi: 10.1021/pr800154p. [DOI] [PMC free article] [PubMed] [Google Scholar]
- 570.Tanner S, Shu H, Frank A, Wang LC, Zandi E, Mumby M, Pevzner PA, Bafna V. Anal Chem. 2005;77:4626. doi: 10.1021/ac050102d. [DOI] [PubMed] [Google Scholar]
- 571.Dasari S, Chambers MC, Slebos RJ, Zimmerman LJ, Ham AJ, Tabb DL. J Proteome Res. 2010;9:1716. doi: 10.1021/pr900850m. [DOI] [PMC free article] [PubMed] [Google Scholar]
- 572.Dasari S, Chambers MC, Codreanu SG, Liebler DC, Collins BC, Pennington SR, Gallagher WM, Tabb DL. Chem Res Toxicol. 2011;24:204. doi: 10.1021/tx100275t. [DOI] [PMC free article] [PubMed] [Google Scholar]
- 573.Sweet SM, Jones AW, Cunningham DL, Heath JK, Creese AJ, Cooper HJ. J Proteome Res. 2009;8:5475. doi: 10.1021/pr9008282. [DOI] [PMC free article] [PubMed] [Google Scholar]
- 574.Bailey CM, Sweet SM, Cunningham DL, Zeller M, Heath JK, Cooper HJ. J Proteome Res. 2009;8:1965. doi: 10.1021/pr800917p. [DOI] [PubMed] [Google Scholar]
- 575.Sun RX, Dong MQ, Song CQ, Chi H, Yang B, Xiu LY, Tao L, Jing ZY, Liu C, Wang LH, Fu Y, He SM. J Proteome Res. 2010;9:6354. doi: 10.1021/pr100648r. [DOI] [PubMed] [Google Scholar]
- 576.Sadygov RG, Good DM, Swaney DL, Coon JJ. J Proteome Res. 2009;8:3198. doi: 10.1021/pr900153b. [DOI] [PMC free article] [PubMed] [Google Scholar]
- 577.Good DM, Wenger CD, McAlister GC, Bai DL, Hunt DF, Coon JJ. J Am Soc Mass Spectrom. 2009;20:1435. doi: 10.1016/j.jasms.2009.03.006. [DOI] [PMC free article] [PubMed] [Google Scholar]
- 578.Liu WT, Ng J, Meluzzi D, Bandeira N, Gutierrez M, Simmons TL, Schultz AW, Linington RG, Moore BS, Gerwick WH, Pevzner PA, Dorrestein PC. Anal Chem. 2009;81:4200. doi: 10.1021/ac900114t. [DOI] [PMC free article] [PubMed] [Google Scholar]
- 579.Ng J, Bandeira N, Liu WT, Ghassemian M, Simmons TL, Gerwick WH, Linington R, Dorrestein PC, Pevzner PA. Nat Methods. 2009;6:596. doi: 10.1038/nmeth.1350. [DOI] [PMC free article] [PubMed] [Google Scholar]
- 580.Hoopmann MR, Finney GL, MacCoss MJ. Anal Chem. 2007;79:5620. doi: 10.1021/ac0700833. [DOI] [PMC free article] [PubMed] [Google Scholar]
- 581.Luethy R, Kessner DE, Katz JE, Maclean B, Grothe R, Kani K, Faca V, Pitteri S, Hanash S, Agus DB, Mallick P. J Proteome Res. 2008;7:4031. doi: 10.1021/pr800307m. [DOI] [PMC free article] [PubMed] [Google Scholar]
- 582.Cox J, Mann M. J Am Soc Mass Spectrom. 2009;20:1477. doi: 10.1016/j.jasms.2009.05.007. [DOI] [PubMed] [Google Scholar]
- 583.Clauser KR, Baker P, Burlingame AL. Anal Chem. 1999;71:2871. doi: 10.1021/ac9810516. [DOI] [PubMed] [Google Scholar]
- 584.Wenger CD, Coon JJ. J Proteome Res. 2013 doi: 10.1021/pr301024c. [DOI] [PMC free article] [PubMed] [Google Scholar]
- 585.Carvalho PC, Cociorva D, Wong CC, da Carvalho MG, Barbosa VC, Yates JR., 3rd Anal Chem. 2009;81:1996. doi: 10.1021/ac8025288. [DOI] [PMC free article] [PubMed] [Google Scholar]
- 586.Sharma V, Eng JK, Feldman S, von Haller PD, MacCoss MJ, Noble WS. J Proteome Res. 2010;9:5438. doi: 10.1021/pr1006685. [DOI] [PMC free article] [PubMed] [Google Scholar]
- 587.Keller A, Nesvizhskii AI, Kolker E, Aebersold R. Anal Chem. 2002;74:5383. doi: 10.1021/ac025747h. [DOI] [PubMed] [Google Scholar]
- 588.Hansen TA, Kryuchkov F, Kjeldsen F. Anal Chem. 2012;84:6638. doi: 10.1021/ac3010007. [DOI] [PubMed] [Google Scholar]
- 589.Tabb DL, Smith LL, Breci LA, Wysocki VH, Lin D, Yates JR., 3rd Anal Chem. 2003;75:1155. doi: 10.1021/ac026122m. [DOI] [PMC free article] [PubMed] [Google Scholar]
- 590.Tabb DL, Huang Y, Wysocki VH, Yates JR., 3rd Anal Chem. 2004;76:1243. doi: 10.1021/ac0351163. [DOI] [PMC free article] [PubMed] [Google Scholar]
- 591.Chalkley RJ, Medzihradszky KF, Lynn AJ, Baker PR, Burlingame AL. Anal Chem. 2010;82:579. doi: 10.1021/ac9018582. [DOI] [PMC free article] [PubMed] [Google Scholar]
- 592.Li W, Song C, Bailey DJ, Tseng GC, Coon JJ, Wysocki VH. Anal Chem. 2011;83:9540. doi: 10.1021/ac202327r. [DOI] [PMC free article] [PubMed] [Google Scholar]
- 593.Michalski A, Neuhauser N, Cox J, Mann M. J Proteome Res. 2012;11:5479. doi: 10.1021/pr3007045. [DOI] [PubMed] [Google Scholar]
- 594.Taylor JA, Johnson RS. Anal Chem. 2001;73:2594. doi: 10.1021/ac001196o. [DOI] [PubMed] [Google Scholar]
- 595.Frank A, Pevzner P. Anal Chem. 2005;77:964. doi: 10.1021/ac048788h. [DOI] [PubMed] [Google Scholar]
- 596.Waridel P, Frank A, Thomas H, Surendranath V, Sunyaev S, Pevzner P, Shevchenko A. Proteomics. 2007;7:2318. doi: 10.1002/pmic.200700003. [DOI] [PubMed] [Google Scholar]
- 597.Taylor JA, Johnson RS. Rapid Commun Mass Spectrom. 1997;11:1067. doi: 10.1002/(SICI)1097-0231(19970615)11:9<1067::AID-RCM953>3.0.CO;2-L. [DOI] [PubMed] [Google Scholar]
- 598.Kim S, Gupta N, Bandeira N, Pevzner PA. Mol Cell Proteomics. 2009;8:53. doi: 10.1074/mcp.M800103-MCP200. [DOI] [PMC free article] [PubMed] [Google Scholar]
- 599.Bern M, Cai Y, Goldberg D. Anal Chem. 2007;79:1393. doi: 10.1021/ac0617013. [DOI] [PubMed] [Google Scholar]
- 600.Zhang J, Xin L, Shan B, Chen W, Xie M, Yuen D, Zhang W, Zhang Z, Lajoie GA, Ma B. Mol Cell Proteomics. 2012;11:M111 010587. doi: 10.1074/mcp.M111.010587. [DOI] [PMC free article] [PubMed] [Google Scholar]
- 601.Chi H, Sun RX, Yang B, Song CQ, Wang LH, Liu C, Fu Y, Yuan ZF, Wang HP, He SM, Dong MQ. J Proteome Res. 2010;9:2713. doi: 10.1021/pr100182k. [DOI] [PubMed] [Google Scholar]
- 602.van Breukelen B, Georgiou A, Drugan MM, Taouatas N, Mohammed S, Heck AJ. Proteomics. 2010;10:1196. doi: 10.1002/pmic.200900405. [DOI] [PubMed] [Google Scholar]
- 603.Elias JE, Gygi SP. Nat Methods. 2007;4:207. doi: 10.1038/nmeth1019. [DOI] [PubMed] [Google Scholar]
- 604.Gupta N, Bandeira N, Keich U, Pevzner PA. J Am Soc Mass Spectrom. 2011;22:1111. doi: 10.1007/s13361-011-0139-3. [DOI] [PMC free article] [PubMed] [Google Scholar]
- 605.Gupta N, Pevzner PA. J Proteome Res. 2009;8:4173. doi: 10.1021/pr9004794. [DOI] [PMC free article] [PubMed] [Google Scholar]
- 606.Kall L, Canterbury JD, Weston J, Noble WS, MacCoss MJ. Nat Methods. 2007;4:923. doi: 10.1038/nmeth1113. [DOI] [PubMed] [Google Scholar]
- 607.Spivak M, Weston J, Bottou L, Kall L, Noble WS. J Proteome Res. 2009;8:3737. doi: 10.1021/pr801109k. [DOI] [PMC free article] [PubMed] [Google Scholar]
- 608.Kall L, Storey JD, MacCoss MJ, Noble WS. J Proteome Res. 2008;7:29. doi: 10.1021/pr700600n. [DOI] [PubMed] [Google Scholar]
- 609.Spivak M, Weston J, Tomazela D, MacCoss MJ, Noble WS. Mol Cell Proteomics. 2012;11:M111 012161. doi: 10.1074/mcp.M111.012161. [DOI] [PMC free article] [PubMed] [Google Scholar]
- 610.Bern MW, Kil YJ. J Proteome Res. 2011;10:5296. doi: 10.1021/pr200780j. [DOI] [PMC free article] [PubMed] [Google Scholar]
- 611.Reiter L, Claassen M, Schrimpf SP, Jovanovic M, Schmidt A, Buhmann JM, Hengartner MO, Aebersold R. Mol Cell Proteomics. 2009;8:2405. doi: 10.1074/mcp.M900317-MCP200. [DOI] [PMC free article] [PubMed] [Google Scholar]
- 612.Wang X, Slebos RJ, Wang D, Halvey PJ, Tabb DL, Liebler DC, Zhang B. J Proteome Res. 2012;11:1009. doi: 10.1021/pr200766z. [DOI] [PMC free article] [PubMed] [Google Scholar]
- 613.Volkening JD, Bailey DJ, Rose CM, Grimsrud PA, Howes-Podoll M, Venkateshwaran M, Westphall MS, Ane JM, Coon JJ, Sussman MR. Mol Cell Proteomics. 2012;11:933. doi: 10.1074/mcp.M112.019471. [DOI] [PMC free article] [PubMed] [Google Scholar]
- 614.McCormack AL, Schieltz DM, Goode B, Yang S, Barnes G, Drubin D, Yates JR., 3rd Anal Chem. 1997;69:767. doi: 10.1021/ac960799q. [DOI] [PubMed] [Google Scholar]
- 615.Borchert N, Dieterich C, Krug K, Schutz W, Jung S, Nordheim A, Sommer RJ, Macek B. Genome Res. 2010;20:837. doi: 10.1101/gr.103119.109. [DOI] [PMC free article] [PubMed] [Google Scholar]
- 616.Link AJ, Hays LG, Carmack EB, Yates JR., 3rd Electrophoresis. 1997;18:1314. doi: 10.1002/elps.1150180808. [DOI] [PubMed] [Google Scholar]
- 617.Pawar H, Sahasrabuddhe NA, Renuse S, Keerthikumar S, Sharma J, Kumar GS, Venugopal A, Sekhar NR, Kelkar DS, Nemade H, Khobragade SN, Muthusamy B, Kandasamy K, Harsha HC, Chaerkady R, Patole MS, Pandey A. Proteomics. 2012;12:832. doi: 10.1002/pmic.201100505. [DOI] [PubMed] [Google Scholar]
- 618.Cappellini E, Jensen LJ, Szklarczyk D, Ginolhac A, da Fonseca RA, Stafford TW, Holen SR, Collins MJ, Orlando L, Willerslev E, Gilbert MT, Olsen JV. J Proteome Res. 2012;11:917. doi: 10.1021/pr200721u. [DOI] [PubMed] [Google Scholar]
- 619.Asara JM, Garavelli JS, Slatter DA, Schweitzer MH, Freimark LM, Phillips M, Cantley LC. Science. 2007;317:1324. doi: 10.1126/science.317.5843.1324. [DOI] [PubMed] [Google Scholar]
- 620.Asara JM, Schweitzer MH, Freimark LM, Phillips M, Cantley LC. Science. 2007;316:280. doi: 10.1126/science.1137614. [DOI] [PubMed] [Google Scholar]
- 621.Liska AJ, Popov AV, Sunyaev S, Coughlin P, Habermann B, Shevchenko A, Bork P, Karsenti E. Proteomics. 2004;4:2707. doi: 10.1002/pmic.200300813. [DOI] [PubMed] [Google Scholar]
- 622.Grossmann J, Fischer B, Baerenfaller K, Owiti J, Buhmann JM, Gruissem W, Baginsky S. Proteomics. 2007;7:4245. doi: 10.1002/pmic.200700474. [DOI] [PubMed] [Google Scholar]
- 623.Oshiro G, Wodicka LM, Washburn MP, Yates JR, 3rd , Lockhart DJ, Winzeler EA. Genome Res. 2002;12:1210. doi: 10.1101/gr.226802. [DOI] [PMC free article] [PubMed] [Google Scholar]
- 624.Merrihew GE, Davis C, Ewing B, Williams G, Kall L, Frewen BE, Noble WS, Green P, Thomas JH, MacCoss MJ. Genome Res. 2008;18:1660. doi: 10.1101/gr.077644.108. [DOI] [PMC free article] [PubMed] [Google Scholar]
- 625.Brosch M, Saunders GI, Frankish A, Collins MO, Yu L, Wright J, Verstraten R, Adams DJ, Harrow J, Choudhary JS, Hubbard T. Genome Res. 2011;21:756. doi: 10.1101/gr.114272.110. [DOI] [PMC free article] [PubMed] [Google Scholar]
- 626.Castellana NE, Payne SH, Shen Z, Stanke M, Bafna V, Briggs SP. Proc Natl Acad Sci U S A. 2008;105:21034. doi: 10.1073/pnas.0811066106. [DOI] [PMC free article] [PubMed] [Google Scholar]
- 627.Li J, Zimmerman LJ, Park BH, Tabb DL, Liebler DC, Zhang B. Mol Syst Biol. 2009;5:303. doi: 10.1038/msb.2009.54. [DOI] [PMC free article] [PubMed] [Google Scholar]
- 628.Carr S, Aebersold R, Baldwin M, Burlingame A, Clauser K, Nesvizhskii A. Mol Cell Proteomics. 2004;3:531. doi: 10.1074/mcp.T400006-MCP200. [DOI] [PubMed] [Google Scholar]
- 629.Latterich M. Proteome Sci. 2006;4:8. doi: 10.1186/1477-5956-4-8. [DOI] [PMC free article] [PubMed] [Google Scholar]
- 630.Wilkins MR, Appel RD, Van Eyk JE, Chung MC, Gorg A, Hecker M, Huber LA, Langen H, Link AJ, Paik YK, Patterson SD, Pennington SR, Rabilloud T, Simpson RJ, Weiss W, Dunn MJ. Proteomics. 2006;6:4. doi: 10.1002/pmic.200500856. [DOI] [PubMed] [Google Scholar]
- 631.Tabb DL. J Proteome Res. 2008;7:45. doi: 10.1021/pr700728t. [DOI] [PMC free article] [PubMed] [Google Scholar]
- 632.Binz PA, Barkovich R, Beavis RC, Creasy D, Horn DM, Julian RK, Jr, Seymour SL, Taylor CF, Vandenbrouck Y. Nat Biotechnol. 2008;26:862. doi: 10.1038/nbt0808-862. [DOI] [PubMed] [Google Scholar]
- 633.Tabb DL, McDonald WH, Yates JR., 3rd J Proteome Res. 2002;1:21. doi: 10.1021/pr015504q. [DOI] [PMC free article] [PubMed] [Google Scholar]
- 634.Resing KA, Meyer-Arendt K, Mendoza AM, Aveline-Wolf LD, Jonscher KR, Pierce KG, Old WM, Cheung HT, Russell S, Wattawa JL, Goehle GR, Knight RD, Ahn NG. Anal Chem. 2004;76:3556. doi: 10.1021/ac035229m. [DOI] [PubMed] [Google Scholar]
- 635.Zhang B, Chambers MC, Tabb DL. J Proteome Res. 2007;6:3549. doi: 10.1021/pr070230d. [DOI] [PMC free article] [PubMed] [Google Scholar]
- 636.Ma ZQ, Dasari S, Chambers MC, Litton MD, Sobecki SM, Zimmerman LJ, Halvey PJ, Schilling B, Drake PM, Gibson BW, Tabb DL. J Proteome Res. 2009;8:3872. doi: 10.1021/pr900360j. [DOI] [PMC free article] [PubMed] [Google Scholar]
- 637.Qeli E, Ahrens CH. Nat Biotechnol. 2010;28:647. doi: 10.1038/nbt0710-647. [DOI] [PubMed] [Google Scholar]
- 638.Feng J, Naiman DQ, Cooper B. Anal Chem. 2007;79:3901. doi: 10.1021/ac070202e. [DOI] [PubMed] [Google Scholar]
- 639.Bandeira N, Tang H, Bafna V, Pevzner P. Anal Chem. 2004;76:7221. doi: 10.1021/ac0489162. [DOI] [PubMed] [Google Scholar]
- 640.Bandeira N, Clauser KR, Pevzner PA. Mol Cell Proteomics. 2007;6:1123. doi: 10.1074/mcp.M700001-MCP200. [DOI] [PubMed] [Google Scholar]
- 641.Bandeira N, Tsur D, Frank A, Pevzner PA. Proc Natl Acad Sci U S A. 2007;104:6140. doi: 10.1073/pnas.0701130104. [DOI] [PMC free article] [PubMed] [Google Scholar]
- 642.Frank AM, Bandeira N, Shen Z, Tanner S, Briggs SP, Smith RD, Pevzner PA. J Proteome Res. 2008;7:113. doi: 10.1021/pr070361e. [DOI] [PMC free article] [PubMed] [Google Scholar]
- 643.Nesvizhskii AI, Aebersold R. Mol Cell Proteomics. 2005;4:1419. doi: 10.1074/mcp.R500012-MCP200. [DOI] [PubMed] [Google Scholar]
- 644.Fermin D, Basrur V, Yocum AK, Nesvizhskii AI. Proteomics. 2011;11:1340. doi: 10.1002/pmic.201000650. [DOI] [PMC free article] [PubMed] [Google Scholar]
- 645.Zhang Y, Wen Z, Washburn MP, Florens L. Anal Chem. 2010;82:2272. doi: 10.1021/ac9023999. [DOI] [PubMed] [Google Scholar]
- 646.Lange V, Picotti P, Domon B, Aebersold R. Mol Syst Biol. 2008;4:222. doi: 10.1038/msb.2008.61. [DOI] [PMC free article] [PubMed] [Google Scholar]
- 647.Picotti P, Rinner O, Stallmach R, Dautel F, Farrah T, Domon B, Wenschuh H, Aebersold R. Nat Methods. 2010;7:43. doi: 10.1038/nmeth.1408. [DOI] [PubMed] [Google Scholar]
- 648.Domon B, Aebersold R. Nat Biotechnol. 2010;28:710. doi: 10.1038/nbt.1661. [DOI] [PubMed] [Google Scholar]
- 649.Jin S, Daly DS, Springer DL, Miller JH. J Proteome Res. 2008;7:164. doi: 10.1021/pr0704175. [DOI] [PubMed] [Google Scholar]
- 650.Dost B, Bandeira N, Li X, Shen Z, Briggs SP, Bafna V. J Comput Biol. 2012;19:337. doi: 10.1089/cmb.2009.0267. [DOI] [PMC free article] [PubMed] [Google Scholar]
- 651.Noble WS, MacCoss MJ. PLoS Comput Biol. 2012;8:e1002296. doi: 10.1371/journal.pcbi.1002296. [DOI] [PMC free article] [PubMed] [Google Scholar]
- 652.Wu SL, Kim J, Hancock WS, Karger B. J Proteome Res. 2005;4:1155. doi: 10.1021/pr050113n. [DOI] [PubMed] [Google Scholar]
- 653.Boyne MT, Garcia BA, Li M, Zamdborg L, Wenger CD, Babai S, Kelleher NL. J Proteome Res. 2009;8:374. doi: 10.1021/pr800635m. [DOI] [PMC free article] [PubMed] [Google Scholar]
- 654.Cannon J, Lohnes K, Wynne C, Wang Y, Edwards N, Fenselau C. J Proteome Res. 2010;9:3886. doi: 10.1021/pr1000994. [DOI] [PMC free article] [PubMed] [Google Scholar]
- 655.Fields S, Song O. Nature. 1989;340:245. doi: 10.1038/340245a0. [DOI] [PubMed] [Google Scholar]
- 656.Ito T, Tashiro K, Muta S, Ozawa R, Chiba T, Nishizawa M, Yamamoto K, Kuhara S, Sakaki Y. Proc Natl Acad Sci U S A. 2000;97:1143. doi: 10.1073/pnas.97.3.1143. [DOI] [PMC free article] [PubMed] [Google Scholar]
- 657.Ito T, Chiba T, Ozawa R, Yoshida M, Hattori M, Sakaki Y. Proc Natl Acad Sci U S A. 2001;98:4569. doi: 10.1073/pnas.061034498. [DOI] [PMC free article] [PubMed] [Google Scholar]
- 658.Uetz P, Giot L, Cagney G, Mansfield TA, Judson RS, Knight JR, Lockshon D, Narayan V, Srinivasan M, Pochart P, Qureshi-Emili A, Li Y, Godwin B, Conover D, Kalbfleisch T, Vijayadamodar G, Yang M, Johnston M, Fields S, Rothberg JM. Nature. 2000;403:623. doi: 10.1038/35001009. [DOI] [PubMed] [Google Scholar]
- 659.Walhout AJ, Sordella R, Lu X, Hartley JL, Temple GF, Brasch MA, Thierry-Mieg N, Vidal M. Science. 2000;287:116. doi: 10.1126/science.287.5450.116. [DOI] [PubMed] [Google Scholar]
- 660.Giot L, Bader JS, Brouwer C, Chaudhuri A, Kuang B, Li Y, Hao YL, Ooi CE, Godwin B, Vitols E, Vijayadamodar G, Pochart P, Machineni H, Welsh M, Kong Y, Zerhusen B, Malcolm R, Varrone Z, Collis A, Minto M, Burgess S, McDaniel L, Stimpson E, Spriggs F, Williams J, Neurath K, Ioime N, Agee M, Voss E, Furtak K, Renzulli R, Aanensen N, Carrolla S, Bickelhaupt E, Lazovatsky Y, DaSilva A, Zhong J, Stanyon CA, Finley RL, Jr, White KP, Braverman M, Jarvie T, Gold S, Leach M, Knight J, Shimkets RA, McKenna MP, Chant J, Rothberg JM. Science. 2003;302:1727. doi: 10.1126/science.1090289. [DOI] [PubMed] [Google Scholar]
- 661.Li S, Armstrong CM, Bertin N, Ge H, Milstein S, Boxem M, Vidalain PO, Han JD, Chesneau A, Hao T, Goldberg DS, Li N, Martinez M, Rual JF, Lamesch P, Xu L, Tewari M, Wong SL, Zhang LV, Berriz GF, Jacotot L, Vaglio P, Reboul J, Hirozane-Kishikawa T, Li Q, Gabel HW, Elewa A, Baumgartner B, Rose DJ, Yu H, Bosak S, Sequerra R, Fraser A, Mango SE, Saxton WM, Strome S, Van Den Heuvel S, Piano F, Vandenhaute J, Sardet C, Gerstein M, Doucette-Stamm L, Gunsalus KC, Harper JW, Cusick ME, Roth FP, Hill DE, Vidal M. Science. 2004;303:540. [Google Scholar]
- 662.Colland F, Jacq X, Trouplin V, Mougin C, Groizeleau C, Hamburger A, Meil A, Wojcik J, Legrain P, Gauthier JM. Genome Res. 2004;14:1324. doi: 10.1101/gr.2334104. [DOI] [PMC free article] [PubMed] [Google Scholar]
- 663.Rual JF, Venkatesan K, Hao T, Hirozane-Kishikawa T, Dricot A, Li N, Berriz GF, Gibbons FD, Dreze M, Ayivi-Guedehoussou N, Klitgord N, Simon C, Boxem M, Milstein S, Rosenberg J, Goldberg DS, Zhang LV, Wong SL, Franklin G, Li S, Albala JS, Lim J, Fraughton C, Llamosas E, Cevik S, Bex C, Lamesch P, Sikorski RS, Vandenhaute J, Zoghbi HY, Smolyar A, Bosak S, Sequerra R, Doucette-Stamm L, Cusick ME, Hill DE, Roth FP, Vidal M. Nature. 2005;437:1173. doi: 10.1038/nature04209. [DOI] [PubMed] [Google Scholar]
- 664.Stelzl U, Worm U, Lalowski M, Haenig C, Brembeck FH, Goehler H, Stroedicke M, Zenkner M, Schoenherr A, Koeppen S, Timm J, Mintzlaff S, Abraham C, Bock N, Kietzmann S, Goedde A, Toksoz E, Droege A, Krobitsch S, Korn B, Birchmeier W, Lehrach H, Wanker EE. Cell. 2005;122:957. doi: 10.1016/j.cell.2005.08.029. [DOI] [PubMed] [Google Scholar]
- 665.Venkatesan K, Rual JF, Vazquez A, Stelzl U, Lemmens I, Hirozane-Kishikawa T, Hao T, Zenkner M, Xin X, Goh KI, Yildirim MA, Simonis N, Heinzmann K, Gebreab F, Sahalie JM, Cevik S, Simon C, de Smet AS, Dann E, Smolyar A, Vinayagam A, Yu H, Szeto D, Borick H, Dricot A, Klitgord N, Murray RR, Lin C, Lalowski M, Timm J, Rau K, Boone C, Braun P, Cusick ME, Roth FP, Hill DE, Tavernier J, Wanker EE, Barabasi AL, Vidal M. Nat Methods. 2009;6:83. doi: 10.1038/nmeth.1280. [DOI] [PMC free article] [PubMed] [Google Scholar]
- 666.Yang B, Wu YJ, Zhu M, Fan SB, Lin J, Zhang K, Li S, Chi H, Li YX, Chen HF, Luo SK, Ding YH, Wang LH, Hao Z, Xiu LY, Chen S, Ye K, He SM, Dong MQ. Nat Methods. 2012;9:904. doi: 10.1038/nmeth.2099. [DOI] [PubMed] [Google Scholar]
- 667.Heck AJ. Nat Methods. 2008;5:927. doi: 10.1038/nmeth.1265. [DOI] [PubMed] [Google Scholar]
- 668.Fonslow BR, Kang SA, Gestaut DR, Graczyk B, Davis TN, Sabatini DM, Yates JR., 3rd Anal Chem. 2010;82:6643. doi: 10.1021/ac101235k. [DOI] [PMC free article] [PubMed] [Google Scholar]
- 669.Rigaut G, Shevchenko A, Rutz B, Wilm M, Mann M, Seraphin B. Nat Biotechnol. 1999;17:1030. doi: 10.1038/13732. [DOI] [PubMed] [Google Scholar]
- 670.Gavin AC, Maeda K, Kuhner S. Curr Opin Biotechnol. 2011;22:42. doi: 10.1016/j.copbio.2010.09.007. [DOI] [PubMed] [Google Scholar]
- 671.Ho Y, Gruhler A, Heilbut A, Bader GD, Moore L, Adams SL, Millar A, Taylor P, Bennett K, Boutilier K, Yang L, Wolting C, Donaldson I, Schandorff S, Shewnarane J, Vo M, Taggart J, Goudreault M, Muskat B, Alfarano C, Dewar D, Lin Z, Michalickova K, Willems AR, Sassi H, Nielsen PA, Rasmussen KJ, Andersen JR, Johansen LE, Hansen LH, Jespersen H, Podtelejnikov A, Nielsen E, Crawford J, Poulsen V, Sorensen BD, Matthiesen J, Hendrickson RC, Gleeson F, Pawson T, Moran MF, Durocher D, Mann M, Hogue CW, Figeys D, Tyers M. Nature. 2002;415:180. doi: 10.1038/415180a. [DOI] [PubMed] [Google Scholar]
- 672.Gavin AC, Bosche M, Krause R, Grandi P, Marzioch M, Bauer A, Schultz J, Rick JM, Michon AM, Cruciat CM, Remor M, Hofert C, Schelder M, Brajenovic M, Ruffner H, Merino A, Klein K, Hudak M, Dickson D, Rudi T, Gnau V, Bauch A, Bastuck S, Huhse B, Leutwein C, Heurtier MA, Copley RR, Edelmann A, Querfurth E, Rybin V, Drewes G, Raida M, Bouwmeester T, Bork P, Seraphin B, Kuster B, Neubauer G, Superti-Furga G. Nature. 2002;415:141. doi: 10.1038/415141a. [DOI] [PubMed] [Google Scholar]
- 673.Gavin AC, Aloy P, Grandi P, Krause R, Boesche M, Marzioch M, Rau C, Jensen LJ, Bastuck S, Dumpelfeld B, Edelmann A, Heurtier MA, Hoffman V, Hoefert C, Klein K, Hudak M, Michon AM, Schelder M, Schirle M, Remor M, Rudi T, Hooper S, Bauer A, Bouwmeester T, Casari G, Drewes G, Neubauer G, Rick JM, Kuster B, Bork P, Russell RB, Superti-Furga G. Nature. 2006;440:631. doi: 10.1038/nature04532. [DOI] [PubMed] [Google Scholar]
- 674.Krogan NJ, Cagney G, Yu H, Zhong G, Guo X, Ignatchenko A, Li J, Pu S, Datta N, Tikuisis AP, Punna T, Peregrin-Alvarez JM, Shales M, Zhang X, Davey M, Robinson MD, Paccanaro A, Bray JE, Sheung A, Beattie B, Richards DP, Canadien V, Lalev A, Mena F, Wong P, Starostine A, Canete MM, Vlasblom J, Wu S, Orsi C, Collins SR, Chandran S, Haw R, Rilstone JJ, Gandi K, Thompson NJ, Musso G, St Onge P, Ghanny S, Lam MH, Butland G, Altaf-Ul AM, Kanaya S, Shilatifard A, O’Shea E, Weissman JS, Ingles CJ, Hughes TR, Parkinson J, Gerstein M, Wodak SJ, Emili A, Greenblatt JF. Nature. 2006;440:637. doi: 10.1038/nature04670. [DOI] [PubMed] [Google Scholar]
- 675.Butland G, Peregrin-Alvarez JM, Li J, Yang W, Yang X, Canadien V, Starostine A, Richards D, Beattie B, Krogan N, Davey M, Parkinson J, Greenblatt J, Emili A. Nature. 2005;433:531. doi: 10.1038/nature03239. [DOI] [PubMed] [Google Scholar]
- 676.Hu P, Janga SC, Babu M, Diaz-Mejia JJ, Butland G, Yang W, Pogoutse O, Guo X, Phanse S, Wong P, Chandran S, Christopoulos C, Nazarians-Armavil A, Nasseri NK, Musso G, Ali M, Nazemof N, Eroukova V, Golshani A, Paccanaro A, Greenblatt JF, Moreno-Hagelsieb G, Emili A. PLoS Biol. 2009;7:e96. doi: 10.1371/journal.pbio.1000096. [DOI] [PMC free article] [PubMed] [Google Scholar]
- 677.Ewing RM, Chu P, Elisma F, Li H, Taylor P, Climie S, McBroom-Cerajewski L, Robinson MD, O’Connor L, Li M, Taylor R, Dharsee M, Ho Y, Heilbut A, Moore L, Zhang S, Ornatsky O, Bukhman YV, Ethier M, Sheng Y, Vasilescu J, Abu-Farha M, Lambert JP, Duewel HS, Stewart II, Kuehl B, Hogue K, Colwill K, Gladwish K, Muskat B, Kinach R, Adams SL, Moran MF, Morin GB, Topaloglou T, Figeys D. Mol Syst Biol. 2007;3:89. doi: 10.1038/msb4100134. [DOI] [PMC free article] [PubMed] [Google Scholar]
- 678.Ideker T, Thorsson V, Ranish JA, Christmas R, Buhler J, Eng JK, Bumgarner R, Goodlett DR, Aebersold R, Hood L. Science. 2001;292:929. doi: 10.1126/science.292.5518.929. [DOI] [PubMed] [Google Scholar]
- 679.Kolkman A, Daran-Lapujade P, Fullaondo A, Olsthoorn MM, Pronk JT, Slijper M, Heck AJ. Mol Syst Biol. 2006;2:0026. doi: 10.1038/msb4100069. [DOI] [PMC free article] [PubMed] [Google Scholar]
- 680.Lu P, Vogel C, Wang R, Yao X, Marcotte EM. Nat Biotechnol. 2007;25:117. doi: 10.1038/nbt1270. [DOI] [PubMed] [Google Scholar]
- 681.Schirmer EC, Florens L, Guan T, Yates JR, 3rd , Gerace L. Science. 2003;301:1380. doi: 10.1126/science.1088176. [DOI] [PubMed] [Google Scholar]
- 682.Arnesen T, Van Damme P, Polevoda B, Helsens K, Evjenth R, Colaert N, Varhaug JE, Vandekerckhove J, Lillehaug JR, Sherman F, Gevaert K. Proc Natl Acad Sci U S A. 2009;106:8157. doi: 10.1073/pnas.0901931106. [DOI] [PMC free article] [PubMed] [Google Scholar]
- 683.Kung LA, Tao SC, Qian J, Smith MG, Snyder M, Zhu H. Mol Syst Biol. 2009;5:308. doi: 10.1038/msb.2009.64. [DOI] [PMC free article] [PubMed] [Google Scholar]
- 684.Lundberg E, Fagerberg L, Klevebring D, Matic I, Geiger T, Cox J, Algenas C, Lundeberg J, Mann M, Uhlen M. Mol Syst Biol. 2010;6:450. doi: 10.1038/msb.2010.106. [DOI] [PMC free article] [PubMed] [Google Scholar]
- 685.Lee MV, Topper SE, Hubler SL, Hose J, Wenger CD, Coon JJ, Gasch AP. Mol Syst Biol. 2011;7:514. doi: 10.1038/msb.2011.48. [DOI] [PMC free article] [PubMed] [Google Scholar]
- 686.Munoz J, Low TY, Kok YJ, Chin A, Frese CK, Ding V, Choo A, Heck AJ. Mol Syst Biol. 2011;7:550. doi: 10.1038/msb.2011.84. [DOI] [PMC free article] [PubMed] [Google Scholar]
- 687.van Noort V, Seebacher J, Bader S, Mohammed S, Vonkova I, Betts MJ, Kuhner S, Kumar R, Maier T, O’Flaherty M, Rybin V, Schmeisky A, Yus E, Stulke J, Serrano L, Russell RB, Heck AJ, Bork P, Gavin AC. Mol Syst Biol. 2012;8:571. doi: 10.1038/msb.2012.4. [DOI] [PMC free article] [PubMed] [Google Scholar]
- 688.Jensen ON. Nat Rev Mol Cell Biol. 2006;7:391. doi: 10.1038/nrm1939. [DOI] [PubMed] [Google Scholar]
- 689.Witze ES, Old WM, Resing KA, Ahn NG. Nat Methods. 2007;4:798. doi: 10.1038/nmeth1100. [DOI] [PubMed] [Google Scholar]
- 690.Blagoev B, Ong SE, Kratchmarova I, Mann M. Nat Biotechnol. 2004;22:1139. doi: 10.1038/nbt1005. [DOI] [PubMed] [Google Scholar]
- 691.Schmelzle K, Kane S, Gridley S, Lienhard GE, White FM. Diabetes. 2006;55:2171. doi: 10.2337/db06-0148. [DOI] [PubMed] [Google Scholar]
- 692.Kratchmarova I, Blagoev B, Haack-Sorensen M, Kassem M, Mann M. Science. 2005;308:1472. doi: 10.1126/science.1107627. [DOI] [PubMed] [Google Scholar]
- 693.Van Hoof D, Munoz J, Braam SR, Pinkse MW, Linding R, Heck AJ, Mummery CL, Krijgsveld J. Cell Stem Cell. 2009;5:214. doi: 10.1016/j.stem.2009.05.021. [DOI] [PubMed] [Google Scholar]
- 694.Brill LM, Xiong W, Lee KB, Ficarro SB, Crain A, Xu Y, Terskikh A, Snyder EY, Ding S. Cell Stem Cell. 2009;5:204. doi: 10.1016/j.stem.2009.06.002. [DOI] [PMC free article] [PubMed] [Google Scholar]
- 695.Weintz G, Olsen JV, Fruhauf K, Niedzielska M, Amit I, Jantsch J, Mages J, Frech C, Dolken L, Mann M, Lang R. Mol Syst Biol. 2010;6:371. doi: 10.1038/msb.2010.29. [DOI] [PMC free article] [PubMed] [Google Scholar]
- 696.Swaney DL, Wenger CD, Thomson JA, Coon JJ. Proc Natl Acad Sci U S A. 2009;106:995. doi: 10.1073/pnas.0811964106. [DOI] [PMC free article] [PubMed] [Google Scholar]
- 697.Gruhler A, Olsen JV, Mohammed S, Mortensen P, Faergeman NJ, Mann M, Jensen ON. Mol Cell Proteomics. 2005;4:310. doi: 10.1074/mcp.M400219-MCP200. [DOI] [PubMed] [Google Scholar]
- 698.Bao MZ, Schwartz MA, Cantin GT, Yates JR, 3rd , Madhani HD. Cell. 2004;119:991. doi: 10.1016/j.cell.2004.11.052. [DOI] [PubMed] [Google Scholar]
- 699.Jones MH, Keck JM, Wong CC, Xu T, Yates JR, 3rd , Winey M. Cell Cycle. 2011;10:3435. doi: 10.4161/cc.10.20.17790. [DOI] [PMC free article] [PubMed] [Google Scholar]
- 700.Villen J, Beausoleil SA, Gerber SA, Gygi SP. Proc Natl Acad Sci U S A. 2007;104:1488. doi: 10.1073/pnas.0609836104. [DOI] [PMC free article] [PubMed] [Google Scholar]
- 701.Godl K, Wissing J, Kurtenbach A, Habenberger P, Blencke S, Gutbrod H, Salassidis K, Stein-Gerlach M, Missio A, Cotten M, Daub H. Proc Natl Acad Sci U S A. 2003;100:15434. doi: 10.1073/pnas.2535024100. [DOI] [PMC free article] [PubMed] [Google Scholar]
- 702.Bantscheff M, Eberhard D, Abraham Y, Bastuck S, Boesche M, Hobson S, Mathieson T, Perrin J, Raida M, Rau C, Reader V, Sweetman G, Bauer A, Bouwmeester T, Hopf C, Kruse U, Neubauer G, Ramsden N, Rick J, Kuster B, Drewes G. Nat Biotechnol. 2007;25:1035. doi: 10.1038/nbt1328. [DOI] [PubMed] [Google Scholar]
- 703.Daub H, Olsen JV, Bairlein M, Gnad F, Oppermann FS, Korner R, Greff Z, Keri G, Stemmann O, Mann M. Mol Cell. 2008;31:438. doi: 10.1016/j.molcel.2008.07.007. [DOI] [PubMed] [Google Scholar]
- 704.Yu Y, Anjum R, Kubota K, Rush J, Villen J, Gygi SP. Proc Natl Acad Sci U S A. 2009;106:11606. doi: 10.1073/pnas.0905165106. [DOI] [PMC free article] [PubMed] [Google Scholar]
- 705.Kubota K, Anjum R, Yu Y, Kunz RC, Andersen JN, Kraus M, Keilhack H, Nagashima K, Krauss S, Paweletz C, Hendrickson RC, Feldman AS, Wu CL, Rush J, Villen J, Gygi SP. Nat Biotechnol. 2009;27:933. doi: 10.1038/nbt.1566. [DOI] [PMC free article] [PubMed] [Google Scholar]
- 706.Hart GW, Housley MP, Slawson C. Nature. 2007;446:1017. doi: 10.1038/nature05815. [DOI] [PubMed] [Google Scholar]
- 707.Arnold CS, Johnson GV, Cole RN, Dong DL, Lee M, Hart GW. J Biol Chem. 1996;271:28741. doi: 10.1074/jbc.271.46.28741. [DOI] [PubMed] [Google Scholar]
- 708.Kim HS, Kim EM, Lee J, Yang WH, Park TY, Kim YM, Cho JW. FEBS Lett. 2006;580:2311. doi: 10.1016/j.febslet.2006.03.043. [DOI] [PubMed] [Google Scholar]
- 709.Wells L, Vosseller K, Cole RN, Cronshaw JM, Matunis MJ, Hart GW. Mol Cell Proteomics. 2002;1:791. doi: 10.1074/mcp.m200048-mcp200. [DOI] [PubMed] [Google Scholar]
- 710.Wang Z, Park K, Comer F, Hsieh-Wilson LC, Saudek CD, Hart GW. Diabetes. 2009;58:309. doi: 10.2337/db08-0994. [DOI] [PMC free article] [PubMed] [Google Scholar]
- 711.Wang Z, Udeshi ND, O’Malley M, Shabanowitz J, Hunt DF, Hart GW. Mol Cell Proteomics. 2010;9:153. doi: 10.1074/mcp.M900268-MCP200. [DOI] [PMC free article] [PubMed] [Google Scholar]
- 712.Vosseller K, Trinidad JC, Chalkley RJ, Specht CG, Thalhammer A, Lynn AJ, Snedecor JO, Guan S, Medzihradszky KF, Maltby DA, Schoepfer R, Burlingame AL. Mol Cell Proteomics. 2006;5:923. doi: 10.1074/mcp.T500040-MCP200. [DOI] [PubMed] [Google Scholar]
- 713.Wang Z, Gucek M, Hart GW. Proc Natl Acad Sci U S A. 2008;105:13793. doi: 10.1073/pnas.0806216105. [DOI] [PMC free article] [PubMed] [Google Scholar]
- 714.Dias WB, Cheung WD, Wang Z, Hart GW. J Biol Chem. 2009;284:21327. doi: 10.1074/jbc.M109.007310. [DOI] [PMC free article] [PubMed] [Google Scholar]
- 715.Kawauchi K, Araki K, Tobiume K, Tanaka N. Proc Natl Acad Sci U S A. 2009;106:3431. doi: 10.1073/pnas.0813210106. [DOI] [PMC free article] [PubMed] [Google Scholar]
- 716.Slawson C, Zachara NE, Vosseller K, Cheung WD, Lane MD, Hart GW. J Biol Chem. 2005;280:32944. doi: 10.1074/jbc.M503396200. [DOI] [PubMed] [Google Scholar]
- 717.Wang Z, Udeshi ND, Slawson C, Compton PD, Sakabe K, Cheung WD, Shabanowitz J, Hunt DF, Hart GW. Sci Signal. 2010;3:ra2. doi: 10.1126/scisignal.2000526. [DOI] [PMC free article] [PubMed] [Google Scholar]
- 718.Huang F, Kirkpatrick D, Jiang X, Gygi S, Sorkin A. Mol Cell. 2006;21:737. doi: 10.1016/j.molcel.2006.02.018. [DOI] [PubMed] [Google Scholar]
- 719.Kirkpatrick DS, Hathaway NA, Hanna J, Elsasser S, Rush J, Finley D, King RW, Gygi SP. Nat Cell Biol. 2006;8:700. doi: 10.1038/ncb1436. [DOI] [PubMed] [Google Scholar]
- 720.Strahl BD, Allis CD. Nature. 2000;403:41. doi: 10.1038/47412. [DOI] [PubMed] [Google Scholar]
- 721.Chi P, Allis CD, Wang GG. Nat Rev Cancer. 2010;10:457. doi: 10.1038/nrc2876. [DOI] [PMC free article] [PubMed] [Google Scholar]
- 722.Zhou Q, Chaerkady R, Shaw PG, Kensler TW, Pandey A, Davidson NE. Proteomics. 2010;10:1029. doi: 10.1002/pmic.200900602. [DOI] [PMC free article] [PubMed] [Google Scholar]
- 723.Deribe YL, Wild P, Chandrashaker A, Curak J, Schmidt MH, Kalaidzidis Y, Milutinovic N, Kratchmarova I, Buerkle L, Fetchko MJ, Schmidt P, Kittanakom S, Brown KR, Jurisica I, Blagoev B, Zerial M, Stagljar I, Dikic I. Sci Signal. 2009;2:ra84. doi: 10.1126/scisignal.2000576. [DOI] [PubMed] [Google Scholar]
- 724.Spickett CM, Pitt AR, Morrice N, Kolch W. Biochim Biophys Acta. 2006;1764:1823. doi: 10.1016/j.bbapap.2006.09.013. [DOI] [PubMed] [Google Scholar]
- 725.Jaffrey SR, Erdjument-Bromage H, Ferris CD, Tempst P, Snyder SH. Nat Cell Biol. 2001;3:193. doi: 10.1038/35055104. [DOI] [PubMed] [Google Scholar]
- 726.Mannick JB, Schonhoff CM. Methods Enzymol. 2008;440:231. doi: 10.1016/S0076-6879(07)00814-2. [DOI] [PubMed] [Google Scholar]
- 727.Lindermayr C, Saalbach G, Durner J. Plant Physiol. 2005;137:921. doi: 10.1104/pp.104.058719. [DOI] [PMC free article] [PubMed] [Google Scholar]
- 728.Chen G, Gharib TG, Huang CC, Taylor JM, Misek DE, Kardia SL, Giordano TJ, Iannettoni MD, Orringer MB, Hanash SM, Beer DG. Mol Cell Proteomics. 2002;1:304. doi: 10.1074/mcp.m200008-mcp200. [DOI] [PubMed] [Google Scholar]
- 729.Griffin TJ, Gygi SP, Ideker T, Rist B, Eng J, Hood L, Aebersold R. Mol Cell Proteomics. 2002;1:323. doi: 10.1074/mcp.m200001-mcp200. [DOI] [PubMed] [Google Scholar]
- 730.Rao PK, Rodriguez GM, Smith I, Li Q. Anal Chem. 2008;80:6860. doi: 10.1021/ac800288t. [DOI] [PMC free article] [PubMed] [Google Scholar]
- 731.Pupim LB, Flakoll PJ, Ikizler TA. J Am Soc Nephrol. 2004;15:1920. doi: 10.1097/01.asn.0000128969.86268.c0. [DOI] [PubMed] [Google Scholar]
- 732.Hinkson IV, Elias JE. Trends Cell Biol. 2011;21:293. doi: 10.1016/j.tcb.2011.02.002. [DOI] [PubMed] [Google Scholar]
- 733.Belle A, Tanay A, Bitincka L, Shamir R, O’Shea EK. Proc Natl Acad Sci U S A. 2006;103:13004. doi: 10.1073/pnas.0605420103. [DOI] [PMC free article] [PubMed] [Google Scholar]
- 734.Eden E, Geva-Zatorsky N, Issaeva I, Cohen A, Dekel E, Danon T, Cohen L, Mayo A, Alon U. Science. 2011;331:764. doi: 10.1126/science.1199784. [DOI] [PubMed] [Google Scholar]
- 735.Yen HC, Xu Q, Chou DM, Zhao Z, Elledge SJ. Science. 2008;322:918. doi: 10.1126/science.1160489. [DOI] [PubMed] [Google Scholar]
- 736.Pratt JM, Petty J, Riba-Garcia I, Robertson DH, Gaskell SJ, Oliver SG, Beynon RJ. Mol Cell Proteomics. 2002;1:579. doi: 10.1074/mcp.m200046-mcp200. [DOI] [PubMed] [Google Scholar]
- 737.Selbach M, Schwanhausser B, Thierfelder N, Fang Z, Khanin R, Rajewsky N. Nature. 2008;455:58. doi: 10.1038/nature07228. [DOI] [PubMed] [Google Scholar]
- 738.Boisvert FM, Ahmad Y, Gierlinski M, Charriere F, Lamont D, Scott M, Barton G, Lamond AI. Mol Cell Proteomics. 2012;11:M111 011429. doi: 10.1074/mcp.M111.011429. [DOI] [PMC free article] [PubMed] [Google Scholar]
- 739.Walrand S, Guillet C, Gachon P, Rousset P, Giraudet C, Vasson MP, Boirie Y. Am J Physiol Cell Physiol. 2004;286:C1474. doi: 10.1152/ajpcell.00563.2002. [DOI] [PubMed] [Google Scholar]
- 740.Caso G, Ford GC, Nair KS, Vosswinkel JA, Garlick PJ, McNurlan MA. Am J Physiol Endocrinol Metab. 2001;280:E937. doi: 10.1152/ajpendo.2001.280.6.E937. [DOI] [PubMed] [Google Scholar]
- 741.Bregendahl K, Liu L, Cant JP, Bayley HS, McBride BW, Milligan LP, Yen JT, Fan MZ. J Nutr. 2004;134:2722. doi: 10.1093/jn/134.10.2722. [DOI] [PubMed] [Google Scholar]
- 742.Rachdaoui N, Austin L, Kramer E, Previs MJ, Anderson VE, Kasumov T, Previs SF. Mol Cell Proteomics. 2009;8:2653. doi: 10.1074/mcp.M900026-MCP200. [DOI] [PMC free article] [PubMed] [Google Scholar]
- 743.Price JC, Holmes WE, Li KW, Floreani NA, Neese RA, Turner SM, Hellerstein MK. Anal Biochem. 2012;420:73. doi: 10.1016/j.ab.2011.09.007. [DOI] [PubMed] [Google Scholar]
- 744.Kim TY, Wang D, Kim AK, Lau E, Lin AJ, Liem DA, Zhang J, Zong NC, Lam MP, Ping P. Mol Cell Proteomics. 2012;11:1586. doi: 10.1074/mcp.M112.021162. [DOI] [PMC free article] [PubMed] [Google Scholar]
- 745.Smith K, Reynolds N, Downie S, Patel A, Rennie MJ. Am J Physiol. 1998;275:E73. doi: 10.1152/ajpendo.1998.275.1.E73. [DOI] [PubMed] [Google Scholar]
- 746.Kipping M, Schierhorn A. J Mass Spectrom. 2003;38:271. doi: 10.1002/jms.437. [DOI] [PubMed] [Google Scholar]
- 747.Mandell JG, Falick AM, Komives EA. Anal Chem. 1998;70:3987. doi: 10.1021/ac980553g. [DOI] [PubMed] [Google Scholar]
- 748.Doherty MK, Whitehead C, McCormack H, Gaskell SJ, Beynon RJ. Proteomics. 2005;5:522. doi: 10.1002/pmic.200400959. [DOI] [PubMed] [Google Scholar]
- 749.Zhang Y, Reckow S, Webhofer C, Boehme M, Gormanns P, Egge-Jacobsen WM, Turck CW. Anal Chem. 2011;83:1665. doi: 10.1021/ac102755n. [DOI] [PubMed] [Google Scholar]
- 750.Price JC, Guan S, Burlingame A, Prusiner SB, Ghaemmaghami S. Proc Natl Acad Sci U S A. 2010;107:14508. doi: 10.1073/pnas.1006551107. [DOI] [PMC free article] [PubMed] [Google Scholar]
- 751.Savas JN, Toyama BH, Xu T, Yates JR, 3rd , Hetzer MW. Science. 2012;335:942. doi: 10.1126/science.1217421. [DOI] [PMC free article] [PubMed] [Google Scholar]
- 752.Zhang DS, Piazza V, Perrin BJ, Rzadzinska AK, Poczatek JC, Wang M, Prosser HM, Ervasti JM, Corey DP, Lechene CP. Nature. 2012;481:520. doi: 10.1038/nature10745. [DOI] [PMC free article] [PubMed] [Google Scholar]
- 753.Atkinson AJ, Colburn WA, Degruttola VG. Clin Pharmacol Ther. 2001;69:89. [Google Scholar]
- 754.Zhang X, Li L, Wei D, Yap Y, Chen F. Trends Biotechnol. 2007;25:166. doi: 10.1016/j.tibtech.2007.02.006. [DOI] [PubMed] [Google Scholar]
- 755.Zhang H, Liu AY, Loriaux P, Wollscheid B, Zhou Y, Watts JD, Aebersold R. Mol Cell Proteomics. 2007;6:64. doi: 10.1074/mcp.M600160-MCP200. [DOI] [PubMed] [Google Scholar]
- 756.Decramer S, Gonzalez de Peredo A, Breuil B, Mischak H, Monsarrat B, Bascands JL, Schanstra JP. Mol Cell Proteomics. 2008;7:1850. doi: 10.1074/mcp.R800001-MCP200. [DOI] [PubMed] [Google Scholar]
- 757.Moon PG, You S, Lee JE, Hwang D, Baek MC. Mass Spectrom Rev. 2011;30:1185. doi: 10.1002/mas.20319. [DOI] [PubMed] [Google Scholar]
- 758.Moon PG, Lee JE, You S, Kim TK, Cho JH, Kim IS, Kwon TH, Kim CD, Park SH, Hwang D, Kim YL, Baek MC. Proteomics. 2011;11:2459. doi: 10.1002/pmic.201000443. [DOI] [PubMed] [Google Scholar]
- 759.Tumani H, Pfeifle M, Lehmensiek V, Rau D, Mogel H, Ludolph AC, Brettschneider J. J Neuroimmunol. 2009;214:109. doi: 10.1016/j.jneuroim.2009.06.012. [DOI] [PubMed] [Google Scholar]
- 760.Wrensch MR, Petrakis NL, Gruenke LD, Ernster VL, Miike R, King EB, Hauck WW. Breast Cancer Res Treat. 1990;15:39. doi: 10.1007/BF01811888. [DOI] [PubMed] [Google Scholar]
- 761.Alexander H, Stegner AL, Wagner-Mann C, Du Bois GC, Alexander S, Sauter ER. Clin Cancer Res. 2004;10:7500. doi: 10.1158/1078-0432.CCR-04-1002. [DOI] [PubMed] [Google Scholar]
- 762.Farina A, Dumonceau JM, Lescuyer P. Expert Rev Proteomics. 2009;6:285. doi: 10.1586/epr.09.12. [DOI] [PubMed] [Google Scholar]
- 763.VanMeter AJ, Rodriguez AS, Bowman ED, Jen J, Harris CC, Deng J, Calvert VS, Silvestri A, Fredolini C, Chandhoke V, Petricoin EF, 3rd , Liotta LA, Espina V. Mol Cell Proteomics. 2008;7:1902. doi: 10.1074/mcp.M800204-MCP200. [DOI] [PMC free article] [PubMed] [Google Scholar]
- 764.Hood BL, Darfler MM, Guiel TG, Furusato B, Lucas DA, Ringeisen BR, Sesterhenn IA, Conrads TP, Veenstra TD, Krizman DB. Mol Cell Proteomics. 2005;4:1741. doi: 10.1074/mcp.M500102-MCP200. [DOI] [PubMed] [Google Scholar]
- 765.Simpson KL, Whetton AD, Dive C. J Chromatogr B Analyt Technol Biomed Life Sci. 2009;877:1240. doi: 10.1016/j.jchromb.2008.11.023. [DOI] [PMC free article] [PubMed] [Google Scholar]
- 766.Veenstra TD. J Chromatogr B Analyt Technol Biomed Life Sci. 2007;847:3. doi: 10.1016/j.jchromb.2006.09.004. [DOI] [PubMed] [Google Scholar]
- 767.Liu T, Qian WJ, Mottaz HM, Gritsenko MA, Norbeck AD, Moore RJ, Purvine SO, Camp DG, 2nd, Smith RD. Mol Cell Proteomics. 2006;5:2167. doi: 10.1074/mcp.T600039-MCP200. [DOI] [PMC free article] [PubMed] [Google Scholar]
- 768.Comegys MM, Lin SH, Rand D, Britt D, Flanagan D, Callanan H, Brilliant K, Hixson DC. J Biol Chem. 2004;279:35063. doi: 10.1074/jbc.M404431200. [DOI] [PubMed] [Google Scholar]
- 769.Kui Wong N, Easton RL, Panico M, Sutton-Smith M, Morrison JC, Lattanzio FA, Morris HR, Clark GF, Dell A, Patankar MS. J Biol Chem. 2003;278:28619. doi: 10.1074/jbc.M302741200. [DOI] [PubMed] [Google Scholar]
- 770.Ludwig JA, Weinstein JN. Nat Rev Cancer. 2005;5:845. doi: 10.1038/nrc1739. [DOI] [PubMed] [Google Scholar]
- 771.Tajiri M, Ohyama C, Wada Y. Glycobiology. 2008;18:2. doi: 10.1093/glycob/cwm117. [DOI] [PubMed] [Google Scholar]
- 772.Brooks SA, Carter TM, Royle L, Harvey DJ, Fry SA, Kinch C, Dwek RA, Rudd PM. Anticancer Agents Med Chem. 2008;8:2. doi: 10.2174/187152008783330860. [DOI] [PubMed] [Google Scholar]
- 773.Tian Y, Zhou Y, Elliott S, Aebersold R, Zhang H. Nat Protoc. 2007;2:334. doi: 10.1038/nprot.2007.42. [DOI] [PMC free article] [PubMed] [Google Scholar]
- 774.Palmisano G, Lendal SE, Engholm-Keller K, Leth-Larsen R, Parker BL, Larsen MR. Nat Protoc. 2010;5:1974. doi: 10.1038/nprot.2010.167. [DOI] [PubMed] [Google Scholar]
- 775.Nwosu CC, Seipert RR, Strum JS, Hua SS, An HJ, Zivkovic AM, German BJ, Lebrilla CB. J Proteome Res. 2011;10:2612. doi: 10.1021/pr2001429. [DOI] [PMC free article] [PubMed] [Google Scholar]
- 776.Leiserowitz GS, Lebrilla C, Miyamoto S, An HJ, Duong H, Kirmiz C, Li B, Liu H, Lam KS. Int J Gynecol Cancer. 2008;18:470. doi: 10.1111/j.1525-1438.2007.01028.x. [DOI] [PMC free article] [PubMed] [Google Scholar]
- 777.de Leoz ML, An HJ, Kronewitter S, Kim J, Beecroft S, Vinall R, Miyamoto S, de Vere White R, Lam KS, Lebrilla C. Dis Markers. 2008;25:243. doi: 10.1155/2008/515318. [DOI] [PMC free article] [PubMed] [Google Scholar]
- 778.de Leoz ML, Young LJ, An HJ, Kronewitter SR, Kim J, Miyamoto S, Borowsky AD, Chew HK, Lebrilla CB. Mol Cell Proteomics. 2011;10:M110 002717. doi: 10.1074/mcp.M110.002717. [DOI] [PMC free article] [PubMed] [Google Scholar]
- 779.Aldredge D, An HJ, Tang N, Waddell K, Lebrilla CB. J Proteome Res. 2012;11:1958. doi: 10.1021/pr2011439. [DOI] [PMC free article] [PubMed] [Google Scholar]
- 780.Hua S, Lebrilla C, An HJ. Bioanalysis. 2011;3:2573. doi: 10.4155/bio.11.263. [DOI] [PubMed] [Google Scholar]
- 781.Hua S, An HJ, Ozcan S, Ro GS, Soares S, DeVere-White R, Lebrilla CB. Analyst. 2011;136:3663. doi: 10.1039/c1an15093f. [DOI] [PMC free article] [PubMed] [Google Scholar]
- 782.Backstrom M, Thomsson KA, Karlsson H, Hansson GC. J Proteome Res. 2009;8:538. doi: 10.1021/pr800713h. [DOI] [PubMed] [Google Scholar]
- 783.Joshi HJ, Harrison MJ, Schulz BL, Cooper CA, Packer NH, Karlsson NG. Proteomics. 2004;4:1650. doi: 10.1002/pmic.200300784. [DOI] [PubMed] [Google Scholar]
- 784.Lohmann KK, von der Lieth CW. Nucleic Acids Res. 2004;32:W261. doi: 10.1093/nar/gkh392. [DOI] [PMC free article] [PubMed] [Google Scholar]
- 785.Ceroni A, Maass K, Geyer H, Geyer R, Dell A, Haslam SM. J Proteome Res. 2008;7:1650. doi: 10.1021/pr7008252. [DOI] [PubMed] [Google Scholar]
- 786.Goldberg D, Bern M, Li B, Lebrilla CB. J Proteome Res. 2006;5:1429. doi: 10.1021/pr060035j. [DOI] [PMC free article] [PubMed] [Google Scholar]
- 787.Zhang H, Yi EC, Li XJ, Mallick P, Kelly-Spratt KS, Masselon CD, Camp DG, 2nd, Smith RD, Kemp CJ, Aebersold R. Mol Cell Proteomics. 2005;4:144. doi: 10.1074/mcp.M400090-MCP200. [DOI] [PubMed] [Google Scholar]
- 788.Zolotarjova N, Mrozinski P, Chen H, Martosella J. J Chromatogr A. 2008;1189:332. doi: 10.1016/j.chroma.2007.11.082. [DOI] [PubMed] [Google Scholar]
- 789.Pang J, Liu WP, Liu XP, Li LY, Fang YQ, Sun QP, Liu SJ, Li MT, Su ZL, Gao X. J Proteome Res. 2010;9:216. doi: 10.1021/pr900953s. [DOI] [PubMed] [Google Scholar]
- 790.Kim HJ, Kang HJ, Lee H, Lee ST, Yu MH, Kim H, Lee C. J Proteome Res. 2009;8:1368. doi: 10.1021/pr8007573. [DOI] [PubMed] [Google Scholar]
- 791.Ralhan R, Desouza LV, Matta A, Chandra Tripathi S, Ghanny S, Datta Gupta S, Bahadur S, Siu KW. Mol Cell Proteomics. 2008;7:1162. doi: 10.1074/mcp.M700500-MCP200. [DOI] [PMC free article] [PubMed] [Google Scholar]
- 792.Xue H, Lu B, Zhang J, Wu M, Huang Q, Wu Q, Sheng H, Wu D, Hu J, Lai M. J Proteome Res. 2010;9:545. doi: 10.1021/pr9008817. [DOI] [PubMed] [Google Scholar]
- 793.Bauer JW, Baechler EC, Petri M, Batliwalla FM, Crawford D, Ortmann WA, Espe KJ, Li W, Patel DD, Gregersen PK, Behrens TW. PLoS Med. 2006;3:e491. doi: 10.1371/journal.pmed.0030491. [DOI] [PMC free article] [PubMed] [Google Scholar]
- 794.Liao H, Wu J, Kuhn E, Chin W, Chang B, Jones MD, O’Neil S, Clauser KR, Karl J, Hasler F, Roubenoff R, Zolg W, Guild BC. Arthritis Rheum. 2004;50:3792. doi: 10.1002/art.20720. [DOI] [PubMed] [Google Scholar]
- 795.Rithidech KN, Honikel L, Milazzo M, Madigan D, Troxell R, Krupp LB. Mult Scler. 2009;15:455. doi: 10.1177/1352458508100047. [DOI] [PubMed] [Google Scholar]
- 796.Nanni P, Levander F, Roda G, Caponi A, James P, Roda A. J Chromatogr B Analyt Technol Biomed Life Sci. 2009;877:3127. doi: 10.1016/j.jchromb.2009.08.003. [DOI] [PubMed] [Google Scholar]
- 797.Zimmermann-Ivol CG, Burkhard PR, Le Floch-Rohr J, Allard L, Hochstrasser DF, Sanchez JC. Mol Cell Proteomics. 2004;3:66. doi: 10.1074/mcp.M300066-MCP200. [DOI] [PubMed] [Google Scholar]
- 798.Bell LN, Theodorakis JL, Vuppalanchi R, Saxena R, Bemis KG, Wang M, Chalasani N. Hepatology. 2010;51:111. doi: 10.1002/hep.23271. [DOI] [PMC free article] [PubMed] [Google Scholar]
- 799.Kim HJ, Cho EH, Yoo JH, Kim PK, Shin JS, Kim MR, Kim CW. J Proteome Res. 2007;6:735. doi: 10.1021/pr060489g. [DOI] [PubMed] [Google Scholar]
- 800.Kolla V, Jeno P, Moes S, Tercanli S, Lapaire O, Choolani M, Hahn S. J Biomed Biotechnol. 2010;2010:952047. doi: 10.1155/2010/952047. [DOI] [PMC free article] [PubMed] [Google Scholar]
- 801.Bons JA, Drent M, Bouwman FG, Mariman EC, van Dieijen-Visser MP, Wodzig WK. Respir Med. 2007;101:1687. doi: 10.1016/j.rmed.2007.03.002. [DOI] [PubMed] [Google Scholar]
- 802.Weissinger EM, Schiffer E, Hertenstein B, Ferrara JL, Holler E, Stadler M, Kolb HJ, Zander A, Zurbig P, Kellmann M, Ganser A. Blood. 2007;109:5511. doi: 10.1182/blood-2007-01-069757. [DOI] [PubMed] [Google Scholar]
- 803.Stanley BA, Gundry RL, Cotter RJ, Van Eyk JE. Dis Markers. 2004;20:167. doi: 10.1155/2004/965261. [DOI] [PMC free article] [PubMed] [Google Scholar]
- 804.McDonough JL, Van Eyk JE. Prog Cardiovasc Dis. 2004;47:207. doi: 10.1016/j.pcad.2004.07.001. [DOI] [PubMed] [Google Scholar]
- 805.Agranoff D, Fernandez-Reyes D, Papadopoulos MC, Rojas SA, Herbster M, Loosemore A, Tarelli E, Sheldon J, Schwenk A, Pollok R, Rayner CF, Krishna S. Lancet. 2006;368:1012. doi: 10.1016/S0140-6736(06)69342-2. [DOI] [PMC free article] [PubMed] [Google Scholar]
- 806.Chen JH, Chang YW, Yao CW, Chiueh TS, Huang SC, Chien KY, Chen A, Chang FY, Wong CH, Chen YJ. Proc Natl Acad Sci U S A. 2004;101:17039. doi: 10.1073/pnas.0407992101. [DOI] [PMC free article] [PubMed] [Google Scholar]
- 807.He QY, Lau GK, Zhou Y, Yuen ST, Lin MC, Kung HF, Chiu JF. Proteomics. 2003;3:666. doi: 10.1002/pmic.200300394. [DOI] [PubMed] [Google Scholar]
- 808.Rifai N, Gillette MA, Carr SA. Nat Biotechnol. 2006;24:971. doi: 10.1038/nbt1235. [DOI] [PubMed] [Google Scholar]
- 809.Paulovich AG, Whiteaker JR, Hoofnagle AN, Wang P. Proteomics Clin Appl. 2008;2:1386. doi: 10.1002/prca.200780174. [DOI] [PMC free article] [PubMed] [Google Scholar]
- 810.Anderson NL. Clin Chem. 2010;56:177. doi: 10.1373/clinchem.2009.126706. [DOI] [PubMed] [Google Scholar]
- 811.Selevsek N, Matondo M, Sanchez Carbayo M, Aebersold R, Domon B. Proteomics. 2011;11:1135. doi: 10.1002/pmic.201000599. [DOI] [PubMed] [Google Scholar]
- 812.Kitteringham NR, Jenkins RE, Lane CS, Elliott VL, Park BK. J Chromatogr B Analyt Technol Biomed Life Sci. 2009;877:1229. doi: 10.1016/j.jchromb.2008.11.013. [DOI] [PubMed] [Google Scholar]
- 813.Latterich M, Abramovitz M, Leyland-Jones B. Eur J Cancer. 2008;44:2737. doi: 10.1016/j.ejca.2008.09.007. [DOI] [PubMed] [Google Scholar]
- 814.Kim K, Kim SJ, Yu HG, Yu J, Park KS, Jang IJ, Kim Y. J Proteome Res. 2010;9:689. doi: 10.1021/pr901013d. [DOI] [PubMed] [Google Scholar]
- 815.Kuzyk MA, Smith D, Yang J, Cross TJ, Jackson AM, Hardie DB, Anderson NL, Borchers CH. Mol Cell Proteomics. 2009;8:1860. doi: 10.1074/mcp.M800540-MCP200. [DOI] [PMC free article] [PubMed] [Google Scholar]
- 816.Fortin T, Salvador A, Charrier JP, Lenz C, Bettsworth F, Lacoux X, Choquet-Kastylevsky G, Lemoine J. Anal Chem. 2009;81:9343. doi: 10.1021/ac901447h. [DOI] [PubMed] [Google Scholar]
- 817.Hossain M, Kaleta DT, Robinson EW, Liu T, Zhao R, Page JS, Kelly RT, Moore RJ, Tang K, Camp DG, 2nd, Qian WJ, Smith RD. Mol Cell Proteomics. 2011;10:M000062. doi: 10.1074/mcp.M000062-MCP201. [DOI] [PMC free article] [PubMed] [Google Scholar]
- 818.Martin DB, Holzman T, May D, Peterson A, Eastham A, Eng J, McIntosh M. Mol Cell Proteomics. 2008;7:2270. doi: 10.1074/mcp.M700504-MCP200. [DOI] [PMC free article] [PubMed] [Google Scholar]
- 819.Anderson NL, Anderson NG, Haines LR, Hardie DB, Olafson RW, Pearson TW. J Proteome Res. 2004;3:235. doi: 10.1021/pr034086h. [DOI] [PubMed] [Google Scholar]
- 820.Anderson NL, Jackson A, Smith D, Hardie D, Borchers C, Pearson TW. Mol Cell Proteomics. 2009;8:995. doi: 10.1074/mcp.M800446-MCP200. [DOI] [PMC free article] [PubMed] [Google Scholar]
- 821.Liu R, Li Z, Bai S, Zhang H, Tang M, Lei Y, Chen L, Liang S, Zhao YL, Wei Y, Huang C. Mol Cell Proteomics. 2009;8:70. doi: 10.1074/mcp.M800195-MCP200. [DOI] [PubMed] [Google Scholar]
- 822.Shi T, Fillmore TL, Sun X, Zhao R, Schepmoes AA, Hossain M, Xie F, Wu S, Kim JS, Jones N, Moore RJ, Pasa-Tolic L, Kagan J, Rodland KD, Liu T, Tang K, Camp DG, 2nd, Smith RD, Qian WJ. Proc Natl Acad Sci U S A. 2012;109:15395. doi: 10.1073/pnas.1204366109. [DOI] [PMC free article] [PubMed] [Google Scholar]
- 823.Zhang Z, Chan DW. Cancer Epidemiol Biomarkers Prev. 2010;19:2995. doi: 10.1158/1055-9965.EPI-10-0580. [DOI] [PMC free article] [PubMed] [Google Scholar]
- 824.Savas JN, Stein BD, Wu CC, Yates JR., 3rd Trends Biochem Sci. 2011;36:388. doi: 10.1016/j.tibs.2011.04.005. [DOI] [PMC free article] [PubMed] [Google Scholar]
- 825.Blackler AR, Speers AE, Ladinsky MS, Wu CC. J Proteome Res. 2008;7:3028. doi: 10.1021/pr700795f. [DOI] [PMC free article] [PubMed] [Google Scholar]
- 826.Hu Q, Noll RJ, Li H, Makarov A, Hardman M, Graham Cooks R. J Mass Spectrom. 2005;40:430. doi: 10.1002/jms.856. [DOI] [PubMed] [Google Scholar]
- 827.Bohrer BC, Merenbloom SI, Koeniger SL, Hilderbrand AE, Clemmer DE. Annu Rev Anal Chem (Palo Alto Calif) 2008;1:293. doi: 10.1146/annurev.anchem.1.031207.113001. [DOI] [PMC free article] [PubMed] [Google Scholar]
- 828.Cooper B. J Proteome Res. 2011;10:1432. doi: 10.1021/pr101003r. [DOI] [PubMed] [Google Scholar]
- 829.Geromanos SJ, Vissers JP, Silva JC, Dorschel CA, Li GZ, Gorenstein MV, Bateman RH, Langridge JI. Proteomics. 2009;9:1683. doi: 10.1002/pmic.200800562. [DOI] [PubMed] [Google Scholar]