

Abstract
Objectives
The study’s objectives were to evaluate speech recognition in multiple listening conditions using several noise types with HiRes 120 and ClearVoice (Low, Medium, High) and to determine which ClearVoice program was most beneficial for everyday use.
Methods
Fifteen postlingual adults attended four sessions; speech recognition was assessed at sessions one and three with HiRes 120 and at sessions two and four with all ClearVoice programs. Test measures included sentences presented in restaurant noise (R-SPACE™), in speech-spectrum noise, in four- and eight-talker babble, and connected discourse presented in 12-talker babble. Participants completed a questionnaire comparing ClearVoice programs.
Results
Significant group differences in performance between HiRes 120 and ClearVoice were present only in the R-SPACE™; performance was better with ClearVoice High than HiRes 120. Among ClearVoice programs, no significant group differences were present for any measure. Individual results revealed most participants performed better in the R-SPACE™ with ClearVoice than HiRes 120. For other measures, significant individual differences between HiRes 120 and ClearVoice were not prevalent. Individual results among ClearVoice programs differed and overall preferences varied. Questionnaire data indicated increased understanding with High and Medium in certain environments.
Discussion
R-SPACE™ and questionnaire results indicated an advantage for ClearVoice High and Medium. Individual test and preference data showed mixed results between ClearVoice programs making global recommendations difficult; however, results suggest providing ClearVoice High and Medium and HiRes 120 as processor options for adults willing to change settings. For adults unwilling or unable to change settings, ClearVoice Medium is a practical choice for daily listening.
Keywords: Cochlear Implant, Postlingual Adults, ClearVoice, Speech Recognition
INTRODUCTION
ClearVoice is a signal processing algorithm developed by Advanced Bionics (Valencia, CA, USA) to improve cochlear implant (CI) users’ speech recognition and listening comfort in noise. In general, the ClearVoice algorithm differentiates speech energy from noise by monitoring amplitude changes over time. Energy with frequent changes in amplitude is assumed to be speech, whereas constant, less modulated energy is assumed to be background noise. Gain is decreased in frequency bands identified as having primarily noise energy, resulting in an enhanced speech signal (Advanced Bionics, 2012a; Buechner et al., 2010). The algorithm has an activation time of 1.3 seconds (Buechner et al., 2010) during which the ongoing level of background noise is characterized before active noise suppression is initiated. ClearVoice functions best at attenuating stationary or steady-state noise (e.g., road noise, air conditioner, vacuum) as it is more easily differentiated from speech than more modulated or dynamic noise, such as multi-talker babble. ClearVoice can be employed for CI recipients who use the HiRes 120 speech processing strategy (Firszt et al., 2009; Brendel et al., 2008) with the Harmony or Neptune speech processors. Three ClearVoice options are available: Low, Medium and High. Noise is attenuated by −6 dB, −12 dB, and −18 dB for Low, Medium and High, respectively (Advanced Bionics, 2012a).
Buechner and colleagues (2010) administered the HSM sentence test in speech-shaped noise with individually set signal-to-noise ratios (SNR) to 13 adult, postlingually deaf CI recipients using HiRes 120, ClearVoice Medium, and ClearVoice High. Participants had extensive experience with HiRes 120 but no experience with ClearVoice. Group mean sentence scores were significantly higher (p < 0.01) in noise with both ClearVoice Medium and High compared to HiRes 120. Figure 1B in Buechner et al. (2010) indicates an improvement for sentence scores in noise of approximately 20 and 24 percentage points with ClearVoice Medium and ClearVoice High, respectively, compared to HiRes 120. Participants then compared the three programs (HiRes 120, ClearVoice Medium and ClearVoice High) in daily life for two weeks; five participants preferred HiRes 120, and seven preferred ClearVoice (three preferred Medium and four preferred High). One participant did not have a preference. In a separate study by this group, five postlingual adult CI recipients were administered Freiburger monosyllabic words and HSM sentences in quiet at 65 dB SPL using HiRes 120 and ClearVoice High. Again, participants had experience with HiRes 120 prior to testing and no experience with ClearVoice High. No significant differences between HiRes 120 and ClearVoice High were seen for any of the participants with either monosyllabic words or sentences presented in quiet (Buechner et al., 2010).
Kam et al. (2012) compared the sentence recognition ability of 12 experienced HiRes 120 recipients in quiet and in speech-spectrum noise using HiRes 120, ClearVoice Medium and ClearVoice High. Participants used all three programs on their Harmony processors for one week prior to testing. The Cantonese Hearing in Noise Test (CHINT) sentences were presented in both quiet and at SNRs individually chosen for each participant. Group mean results did not differ significantly between HiRes 120 and ClearVoice Medium or High in quiet or between HiRes 120 and ClearVoice High in noise; however, ClearVoice Medium produced significantly higher scores (p < 0.05) in speech-spectrum noise than HiRes 120. The group mean sentence score in noise for ClearVoice Medium was 5.5 percentage points higher than the score for HiRes 120. All 12 participants reported a preference for ClearVoice compared to HiRes 120 (six preferred ClearVoice Medium and six preferred ClearVoice High).
Advanced Bionics conducted a multi-center clinical trial in 2010 with 46 adult participants who were experienced users of the HiRes 120 strategy and who had considerable open-set speech recognition with their CI (≥ 50% on monosyllabic words). Participants had two weeks experience with ClearVoice Medium and two weeks with ClearVoice High prior to speech recognition testing with HiRes 120 and ClearVoice. AzBio sentences (Spahr et al., 2005) were presented in quiet, in speech-spectrum noise, and in multi-talker babble (IEEE Revised Canteen Noise). In quiet, group mean sentence scores did not differ significantly between HiRes 120, ClearVoice Medium and ClearVoice High, thus ClearVoice did not have an effect, positive or negative, on performance in quiet. Group mean scores were significantly higher (p < 0.0001) with ClearVoice Medium and ClearVoice High than HiRes 120 for sentences in speech-spectrum noise. For ClearVoice Medium, the group mean sentence score improved by 8.7 percentage points compared to HiRes 120, and for ClearVoice High, the mean sentence score improved by 10.6 percentage points. In addition, results revealed a significantly higher (p < 0.02) group mean sentence score with ClearVoice Medium than HiRes 120 in multi-talker babble (mean improvement 3.2 percentage points). Based on questionnaire results, the majority of participants (93%) preferred ClearVoice to HiRes 120 for daily listening (Advanced Bionics, 2012b).
Eight participants from Washington University School of Medicine (WUSM) participated in the Advanced Bionics’ multi-center clinical trial. All eight reported that they would use ClearVoice either all the time or in noisy situations in daily life. Of particular interest were individual comments from participants, such as ClearVoice provided better understanding than HiRes 120 when watching TV with the family, when playing golf with a small group, at small social gatherings, and at restaurants. These comments were similar to questionnaire results reported by Kam et al., (2012) where at least half of participants preferred listening with ClearVoice compared to HiRes 120 when conversing in a group of people, at a restaurant, and watching TV.
Results from the abovementioned studies clearly showed that speech recognition in steady-state noise was improved with ClearVoice. Participant comments as well as the significantly improved mean score for sentences presented in multi-talker babble (Advanced Bionics, 2012b) indicated ClearVoice may be beneficial in noise conditions other than stationary or steady-state noise. Therefore, the objective of the current study was to evaluate speech recognition in a number of listening conditions, including both conversational and soft presentation levels, using several noise types to determine if significant differences exist between HiRes 120 and ClearVoice (Low, Medium, and High) for more modulated, less steady-state noise. A second objective was to determine which of the three ClearVoice programs was most beneficial for everyday use. Since many CI recipients do not switch programs throughout the day and rely on only one program for all listening situations, this information may be clinically useful when selecting a primary program for these recipients.
METHODS
This study was approved by the Human Research Protection Office at Washington University in St. Louis, MO, USA (#201203101). An informed consent document was signed by each participant prior to the start of the study.
Participants
Fifteen postlingually deafened adults participated. All were implanted by surgeons affiliated with WUSM and attended speech processor programming and aural rehabilitation sessions with CI audiologists at WUSM. Demographic and device information is provided in Table 1. Eleven participants were unilaterally implanted and four used bilateral implants. Fourteen participants used amplification prior to cochlear implantation; however, participants P5, P10 and P12 used a hearing aid in the nonimplanted ear only, never in the implanted ear. One participant (P14) never used amplification in either ear due to sudden moderate-to-severe hearing loss in one ear followed by sudden deafness in the other ear 25 years later. Participants ranged in age from 45–75 years (group mean = 63 years; SD = 9 years). All had used an implant for at least 3 years, except one participant who had used his implant for 6 months (group mean = 6 years, SD = 4 years). In addition, all had open-set speech recognition with monosyllabic word scores ranging from 40% – 96% (group mean = 64%, SD = 16%). Four of the 15 participants had previously participated in the Advanced Bionics multi-center clinical trial referenced above.
Table 1.
Participant demographic and device information
| Participant | Etiology | Age at Study (yrs) | Duration of Deafness (yrs) | Duration HA Use CI Ear(s) (yrs) | CI Device | Length CI Use (yrs) | Active Els | IDR | T-Level Settings | CNC Score (%) |
|---|---|---|---|---|---|---|---|---|---|---|
| 1 | Charcot-Marie Tooth | 59 | 11 | 21 | 90K | 3 | 13 | 70 | BA | 50 |
| 2 | Unknown | 61 | 38 | 33 | 90K | 7 | 14 | 80 | BA | 56 |
| 3 | Genetic | 71 | 5 | 10 | Helix | 7 | 14 | 65 | BA | 73 |
| 4 | Genetic | 52 | 10 | 17 | 90K | 0.5 | 16 | 60 | BA | 60 |
| 5 | Genetic/Noise | 75 | 25 | 0 | 90K | 4 | 15 | 60 | BA | 68 |
| 6 | Genetic/Noise | 73 | 10 | 15 | C-II | 9 | 11 | 65 | 0 | 40 |
| 7 | Unknown | 55 | 5 | 5 | 90K | 4 | 14 | 60 | 10% of Ms | 80 |
| 8 | Noise | 60 | 7 | 12 | 90K | 3 | 14 | 65 | BA | 68 |
| 9 | Auto Immune | 57 | 6 | 11 | C-II | 9 | 15 | 60 | BA | 85 |
| 10 | Unknown | 70 | 40 | 0 | 90K | 4 | 15 | 45 | BA | 48 |
| 11 | Unknown | 71 | 20 | 38 | C-I*/90K | 17* | 12 | 70 | BA | 42 |
| 12 | Unknown | 71 | 2 | 0 | 90K | 4 | 15 | 60 | 10% of Ms | 62 |
| 13 | Ototoxicity | 67 | 30 | 30 | C-II | 9 | 13 | 80 | BA | 62 |
| 14 | Unknown | 45 | 25 | 0 | 90K | 4 | 12 | 65 | 0 | 76 |
| 15 | Genetic | 62 | 10 | 25 | C-II | 9 | 16 | 65 | BA | 96 |
BA, barely audible; CI, cochlear implant; CNC, consonant-vowel nucleus-consonant; Els, electrodes; HA, hearing aid; IDR, input dynamic range; Ms, M-levels; yrs, years;
P11 was reimplanted with a 90K device following the failure of the C-I after 16 years of use.
All participants used the Harmony speech processor programmed with the HiRes 120 speech processing strategy and 11 to 16 active electrodes. Participants 1 and 11 did not have a full insertion of the electrode array into the cochlea; one and three extra-cochlear electrodes were deactivated for P1 and P11, respectively, and additional basal electrodes were disabled to improve sound quality. Participant 6 had a short on two electrodes and three other electrodes were disabled for quality issues. Other participants not using all 16 electrodes had basal and/or apical electrodes disabled to improve sound quality.
During clinical programming at WUSM, maximum electrical stimulation levels or M-levels were set for each electrode via an ascending loudness judgment procedure. Generally, M-levels were set at a comfortable loudness level and balanced for loudness. M-levels were then globally adjusted to make speech and environmental sounds comfortably loud. Two participants in this study had their minimum electrical stimulation levels or T-levels set at 0 and two had T-levels set at the manufacturer’s recommended setting of 10% of M-levels. The remaining eleven had T-levels set above 10% of M-levels at a “barely audible” level as measured on individual electrodes. Most participants used an input dynamic range (IDR) of 60–70 dB; however, two participants preferred an IDR of 80 dB and one preferred an IDR of 45 dB for everyday use.
Test Procedures
Participants attended four test sessions spaced one week apart. As previously noted, all participants were using HiRes 120 prior to the study; therefore, baseline testing was completed with HiRes 120 at sessions one and retest data obtained at session three. All three ClearVoice programs were tested at session two and retested at session four. Test time was approximately 40 minutes for sessions one and three and two hours for sessions two and four. Frequency-modulated (FM) tone, sound-field threshold levels were obtained at each test session to ensure audibility of speech recognition measures and consistent sound-field levels between sessions. At the first session, participants were familiarized with the speech recognition measures. Participants were then tested with their preferred HiRes 120 program. If participants were seen for an annual CI evaluation or for speech processor programming within six months of the first session and if they reported no issues with their current HiRes 120 speech processor program, the program was not checked prior to testing. Three participants had not had an evaluation within the last six months; consequently, their speech processor programs were checked and monosyllabic word testing completed to determine if scores had changed since their last evaluation. Speech processor programs and speech recognition were stable; therefore, all participants were assessed at the first session with the HiRes 120 program and volume control setting that they used most often in everyday life. If a participant used a hearing aid in the opposite ear, it was turned off for testing. The four bilateral recipients were tested unilaterally, using their first implanted CI (the better hearing ear for each). Each participant’s T-Mic™ was replaced with a new T-Mic™ before each test session. Prior to and during the study, all participants’ speech processor programs had the audio mixing setting of “Aux Only” for T-Mic™ use.
At the end of the first HiRes 120 test session, three programs, ClearVoice Low, Medium and High, were created from each participant’s preferred HiRes 120 program. Other than adding ClearVoice, no changes were made to the programs. The ClearVoice Low, Medium and High programs were placed in locations 1–3, respectively, on each participant’s processor(s). Next, restaurant noise (Environmental Sounds CD, Advanced Bionics) was played through loudspeakers placed in front of the participant, and a conversation was held while using each ClearVoice program. All participants could hear the differences in noise attenuation between the three ClearVoice programs and reported that the audiologist’s voice was comfortably loud with each program. Participants were asked to use all three ClearVoice programs in a variety of listening situations over the next week in order to determine their preferred ClearVoice program. Additionally, participants were to adjust the volume control if necessary to make speech and sound comfortably loud. All but one participant had volume control minimum/maximum range settings of at least 50%. The volume control was disabled for P11 due to the use of a wig which made it difficult to adjust the volume and keep it stable.
After one week’s use, participants were evaluated with the three ClearVoice programs during the second test session. Four participants reported using a higher volume setting with ClearVoice (Low, Medium and High) than with HiRes 120; therefore, these higher volume settings were used for testing. Specifically, P3 and P13 used a volume setting of 10:00 with HiRes 120 and 11:00 with ClearVoice; P14 used 12:00 with HiRes 120 and 1:00 with ClearVoice, and P9 used a setting between 12:00 and 1:00 with HiRes 120 and 2:00 with ClearVoice. All other participants used the same volume settings when testing with HiRes 120 and ClearVoice. The order of testing with each ClearVoice program was counter balanced across participants. Participants were not told which ClearVoice program was being tested. The audiologist set the correct program and verified the volume setting prior to testing with each ClearVoice program.
At the end of the second test session, the HiRes 120 programs were placed back on each participant’s speech processor(s) to be used for one week. Testing was then completed at the third test session with the same HiRes 120 program used during the first test session. At the end of the third session, the three ClearVoice programs were once again placed on each participant’s processor(s). Participants were instructed to use all three ClearVoice programs over the next week and asked to complete a comparison questionnaire for which they were to rate their speech understanding with each of the ClearVoice programs in a variety of specific listening situations. At the fourth test session, participants were tested for a second time with the three ClearVoice programs. The same test order and volume control settings were used during both ClearVoice test sessions.
Test Materials
The test materials were selected to include several noise types (i.e., restaurant noise, 12-talker babble, eight-talker babble, four-talker babble, and speech-spectrum noise) and multiple listening conditions (i.e., varying presentation levels of speech and noise and multiple loudspeaker locations) to try and approximate listening environments that may be encountered by CI users in daily life. All speech recognition testing was administered in a sound-attenuated booth that meets ANSI standards (ANSI S3.1-1999 [2008]) for ambient noise levels. Test measures included: HINT (Nilsson et al., 1994) sentences in the R-SPACE™ test environment (Revit et al., 2007; 2002), City University of New York (CUNY) sentences (Boothroyd et al., 1988) in speech-spectrum noise, the Acceptable Noise Level Test ( Nabeleck et al., 2006), the Bamford-Kowal-Bench Speech-in-Noise (BKB-SIN) Test (Killion et al., 2004) and AzBio sentences presented in eight-talker babble. The presentation of the noise was constant for all tests except the BKB-SIN Test which was administered as designed; the four-talker babble began three seconds prior to the start of each sentence and stopped two seconds after the end of each sentence. As noted in the introduction, ClearVoice has an activation time of 1.3 seconds (Buechner et al., 2010); therefore, ClearVoice characterized the noise and was active for each test given (See Advanced Bionics, 2012a).
Eight loudspeakers surrounded the participant during testing in the R-SPACE™.Restaurant noise was played through each of the loudspeakers at 60 dB SPL and HINT sentences were presented from the loudspeaker directly in front of the participant. The presentation level of the sentences varied and was dependent on the participant’s response. If the participant repeated the sentence correctly, the presentation level was decreased and if the sentence was repeated incorrectly, the presentation level was increased. This adaptive procedure produced an SNR for 50% correct sentence recognition.
The CUNY sentences were presented at a soft level of 50 dB SPL in speech-spectrum noise. The participant was seated at 0° azimuth, 1.5 meters from the loudspeaker. Sentences and noise were presented from the same loudspeaker. The SNR used for each participant ranged from +2 dB to +8 dB and was chosen during practice testing at the first test session to obtain a score between 20% and 80%, thereby avoiding floor and ceiling effects. Participants 10 and 11 used an SNR of +8 dB, P7 and P14 used +3 dB, P9 and P15 used +2 dB, and the remaining nine participants used an SNR of +5 dB.
The Acceptable Noise Level Test was used to determine the SNR at which each participant could tolerate listening to an Arizona travelogue spoken by a male talker in 12-talker babble. The participants were verbally instructed as well as given written instructions. The loudspeaker was positioned at 0° azimuth, 1.5 meters from the participant. The travelogue presentation level was adjusted until the participant reported that a most comfortable listening level (MCL) was reached. Twelve-talker babble was then added and the presentation level adjusted until the participant reported the background noise level (BNL) was at the maximum level at which he/she could listen and still follow the travelogue. The BNL was subtracted from MCL to obtain the acceptable noise level, an SNR for each participant. For example, an MCL of 48 dB HL and a BNL of 41 dB HL resulted in an SNR of +7 dB. The lower the SNR the more background noise the participant was willing to tolerate.
Participants 1–7 were administered the BKB-SIN test presented at 65 dB SPL in four-talker babble. Sentences were presented from the front loudspeaker (0° azimuth) and babble was presented toward the CI ear through a loudspeaker positioned at 90°. The SNR for the first sentence was +21 dB and decreased by 3 dB (to a SNR of 0 dB) for each sentence thereafter. The score obtained was the SNR at which the participant could repeat key words correctly 50% of the time. Results from these seven participants led to a protocol change for the remaining eight participants.
Participants 8–15 were administered AzBio sentences with the same loudspeaker configuration as the BKB-SIN; sentences were presented from the front loudspeaker at 65 dB SPL and eight-talker babble toward the participants’ implanted ear. Individual SNRs were selected prior to testing to minimize floor and ceiling effects. The SNRs selected for P8–P15 were +5, +3, + 8, +12, +5, +5, +3, +3, respectively.
Across the four test sessions, a total of two paired HINT sentence lists (20 sentences per list) were administered in the R-SPACE™ with each of the four programs (HiRes 120, ClearVoice Low, ClearVoice Medium, ClearVoice High). In addition, a total of four CUNY sentence lists and four BKB-SIN or AzBio sentence lists were administered to participants using each of the four programs. Test lists were pseudo randomized for each participant and no list was repeated during test sessions for any one participant. The Acceptable Noise Level Test was administered twice at each session, and four SNRs were obtained for each program.
Recall that after the third test session, participants were given a questionnaire to take home and complete. The questionnaire consisted of 21 listening situations; participants were asked to rate on a scale from 1 (poor understanding) to 5 (excellent understanding) how well they understood speech with each of the three ClearVoice programs for each listening situation.
RESULTS
FM tone, sound-field threshold levels were obtained at .25, .5, 1.0, 2.0, 3.0, 4.0 and 6.0 kHz. The average levels and standard deviations across participants and test sessions for HiRes 120 were 18.3 (7.3), 20.2 (5.9), 19.5 (3.4), 19.0 (3.9), 21.5 (4.7), 22.1 (4.7), and 24.5 (6.8) dB HL and for ClearVoice High were 18.4 (5.4), 20.5 (5.2), 19.3 (4.3), 17.0 (3.6), 21.1 (3.6), 22.7 (2.7), and 25.0 (4.8) dB HL. All participants had stable sound-field levels and good audibility across test sessions.
Performance Outcomes with HiRes 120 versus ClearVoice Programs
One-way ANOVAs analyzed test order effects for each test measure. The analysis was conducted across all test lists and with the four programs (HiRes 120, ClearVoice Low, ClearVoice Medium, ClearVoice High) to determine if there was an overall order effect; the analysis was repeated with all test lists and the three ClearVoice programs (i.e., without HiRes 120) to determine whether there was an order effect within the ClearVoice testing. There was not a significant test order effect for any measure (all ps > 0.05). In addition, within each of the programs (HiRes 120, ClearVoice Low, ClearVoice Medium, ClearVoice High), paired t-tests revealed no significant difference between test results obtained at the two test sessions (all ps > 0.05); therefore, scores with each program were averaged across participants and across test sessions (sessions one and three for HiRes 120 and sessions two and four for ClearVoice) to obtain group mean scores.
Group data were analyzed using a one-way repeated measures ANOVA and significant effects analyzed posthoc with Bonferroni corrected paired t-tests to determine statistically significant differences between specific programs (HiRes 120, ClearVoice Low, ClearVoice Medium and ClearVoice High). Figure 1 shows group mean scores across test sessions for the R-SPACE™ (n=15), BKB-SIN (n=7) and Acceptable Noise Level Test (n=15) for each of the four programs. These three adaptive noise tests were scored as SNRs; lower numbers represent better performance in noise than higher numbers. Error bars represent ± 1 standard error of the mean. Significant differences between programs are noted with an asterisk. In the R-SPACE™ test environment, group performance was significantly different across conditions (F[1,14]=9.35, p < 0.01). Participants performed significantly better with ClearVoice High (mean SNR = +7.98 dB) than HiRes 120 (mean SNR = +10.49 dB), t(14) = 3.2, p < 0.05, a decrease in SNR of 2.51 dB. A decrease in SNR was also seen between HiRes 120 and ClearVoice Medium (1.46 dB) and between HiRes 120 and ClearVoice Low (1.22 dB); however, analysis of group data did not indicate significant differences between either HiRes 120 and ClearVoice Medium or Low on this measure. Moreover, there were no significant group differences between the four programs for the BKB-SIN or Acceptable Noise Level Test (ps > 0.05).
Figure 1.

Group mean signal-to-noise ratios (SNRs) for sentences in the R-SPACE™, the BKB-SIN Test (n = 7) and the Acceptable Noise Level (ANL) Test with each of the four programs (HR 120 = HiRes 120; CVL = ClearVoice Low; CVM = ClearVoice Medium; CVH = ClearVoice High). Error bars represent ± 1 standard error of the mean. An asterisk denotes significant differences between programs (p < 0.05).
Figure 2 shows group mean scores in percent correct for the CUNY sentences presented at a soft level (50 dB SPL; n=15) in speech-spectrum noise and AzBio sentences (65 dB SPL; n=8) in eight-talker babble. Again, no significant differences in group data were seen between the four programs for these two measures (ps > 0.05).
Figure 2.
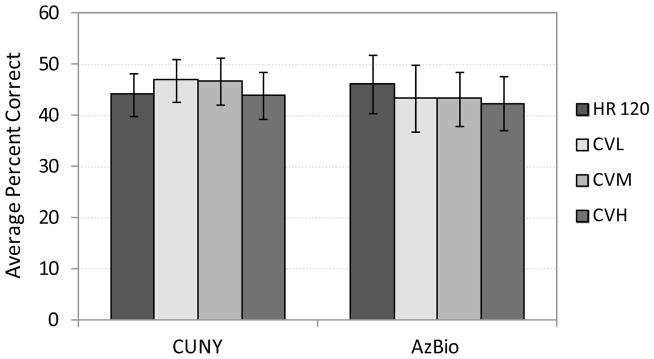
Group mean scores for CUNY sentences (50 dB SPL) in speech-spectrum noise and AzBio sentences (65 dB SPL; n =8) in eight-talker babble with each of the four programs. Error bars represent ± 1 standard error of the mean.
As is typically the case with CI performance outcomes, a good deal of individual variability was seen in speech recognition test results. Figures 3 and 4 show individual data with each of the ClearVoice programs (y-axis) plotted in relation to individual data with HiRes 120 (x-axis) for each test measure. The three panels in Figure 3 represent the three adaptive noise tests for which an SNR was obtained and the two panels in Figure 4 represent the two sentence tests in noise for which a score in percent correct was obtained. In Figure 3 (SNR scores), symbols below the diagonal line indicate better performance with ClearVoice than HiRes 120 and in Figure 4 (scores in percent correct), symbols above the diagonal line indicate better performance with ClearVoice than HiRes 120. If symbols fall on or near the diagonal line, there is little difference between ClearVoice and HiRes 120.
Figure 3.

Individual mean SNRs with each of the three ClearVoice programs plotted in relation to individual mean SNRs with HiRes 120 for the three adaptive tests in noise, R-SPACE™ (Panel A), BKB-SIN (Panel B), Acceptable Noise Level Test (Panel C).
Figure 4.

Individual mean scores with each of the three ClearVoice programs plotted in relation to individual mean scores with HiRes 120 for CUNY sentences (Panel A) and AzBio sentences (Panel B).
Figure 3, Panel A represents individual data for HINT sentences in the R-SPACE™. Most participants had lower SNRs with ClearVoice than with HiRes 120 indicated by the majority of symbols falling below the diagonal line. Significant differences between individual SNRs were determined using a critical difference of > 1.4 dB (95% confidence interval; Compton-Conley et al., 2004). Table 2 shows each participant’s mean SNR in the R-SPACE™ with HiRes 120, ClearVoice Low, ClearVoice Medium, and ClearVoice High. Bold type represents a significantly lower (better) SNR with a ClearVoice program compared to HiRes 120; italicized and underlined type represents a significantly higher (poorer) SNR with ClearVoice compared to HiRes 120. The majority of participants, 12 of 15, had a significantly lower (>1.4 dB) SNR with at least one ClearVoice program than with HiRes 120. No significant differences between ClearVoice and HiRes 120 were seen for two participants (P13, P15), and one participant (P5) had significantly better performance with HiRes 120 than with ClearVoice Medium and High. Because corrections for multiple comparisons were not made, it is possible that one or more of these potentially significant differences were actually false positives. However, when examining the overall pattern of R-SPACE™ results, rather than individual participant scores, a clear advantage was found for ClearVoice over HiRes 120.
Table 2.
Each participant’s mean SNR in the R-SPACE™ with HiRes 120, ClearVoice Low, Medium and High.
| Participant | HiRes 120 AVG SNR | CV Low AVG SNR | CV Medium AVG SNR | CV High AVG SNR |
|---|---|---|---|---|
| 1 | 18.85 | 12.33 | 10.50 | 12.15 |
| 2 | 10.17 | 9.38 | 4.95 | 5.65 |
| 3 | 12.06 | 12.90 | 11.30 | 10.65 |
| 4 | 11.82 | 8.70 | 9.15 | 10.60 |
| 5 | 7.83 | 8.93 | 9.43 | 9.35 |
| 6 | 16.88 | 17.10 | 17.80 | 13.65 |
| 7 | 5.75 | 6.48 | 2.83 | 5.53 |
| 8 | 10.70 | 8.53 | 5.29 | 4.82 |
| 9 | 7.94 | 8.10 | 6.33 | 6.20 |
| 10 | 17.28 | 15.06 | 19.62 | 17.49 |
| 11 | 20.75 | 15.20 | 18.10 | 11.18 |
| 12 | 9.15 | 9.19 | 12.03 | 7.40 |
| 13 | 3.30 | 2.53 | 4.35 | 3.06 |
| 14 | 2.54 | 1.30 | 0.47 | −0.35 |
| 15 | 2.29 | 3.29 | 3.29 | 2.35 |
| Mean SNR | 10.49 | 9.27 | 9.03 | 7.98 |
AVG, average; CV, ClearVoice; SNR, signal-to-noise ratio; bold = significantly lower SNR with ClearVoice compared to HiRes 120; italic = significantly higher SNR with ClearVoice compared to HiRes 120.
Panel B in Figure 3 shows little difference in individual SNRs between ClearVoice and HiRes 120 for the BKB-SIN as most symbols fall on or near the diagonal line. Only two participants had significant differences between ClearVoice and HiRes 120 on this measure (>2.2 dB for 95% confidence interval; Etymotic Research); P5 performed better with ClearVoice Low than HiRes 120 and P7 performed better with HiRes 120 than ClearVoice Medium. Since little difference was seen between ClearVoice and HiRes 120 for the BKB-SIN (four-talker babble) with the first seven participants, the remaining eight participants were administered AzBio sentences in eight-talker babble.
The Acceptable Noise Level Test does not have established critical difference levels; therefore, no individual analysis was completed. Panel C of Figure 3 shows comparable noise tolerance between ClearVoice and HiRes 120.
A table of 95% critical differences in speech recognition scores developed with the binomial model (Carney et al., 2007; Thornton et al., 1978) was used to analyze individual data for CUNY and AzBio sentences. (Note that use of a table for identifying critical differences, as used here and in a later analysis, does not allow correction for multiple comparisons; consequently, there is a 5% probability that any given individual comparison may represent a false positive.) Figure 4 (panel A) shows comparisons between ClearVoice and HiRes 120 for CUNY sentence scores. Although there are more instances of higher scores with ClearVoice than HiRes 120 (i.e., more data points fall above the diagonal line), only four participants had significant differences between the two processing modes. Two participants had significantly higher scores with ClearVoice Medium than HiRes 120 and two other participants’ scores were significantly higher with HiRes 120 than ClearVoice High (ps < 0.05). In contrast, most symbols fall at or below the diagonal for AzBio sentences (Figure 4, panel B) indicating sentence scores were lower with ClearVoice than with HiRes 120 for many participants; four participants had significant differences between ClearVoice and HiRes 120 on this measure. Three had significantly higher scores with HiRes 120 than with ClearVoice High, and one participant had a significantly higher score with ClearVoice High than HiRes 120 (ps < 0.05).
Performance Outcomes among ClearVoice Programs
To determine which of the three ClearVoice programs was most beneficial (when compared to each other rather than to HiRes 120), individual differences between ClearVoice Low, Medium and High were examined, again using the 95% critical differences in speech recognition table. Significant individual differences between ClearVoice programs were most prevalent for the R-SPACE™, CUNY and AzBio sentences. In Figures 5–7, an asterisk denotes significantly better performance (p < 0.05) among ClearVoice programs. Figure 5 shows mean SNRs for each participant in the R-SPACE™ with each ClearVoice program. For the majority of participants, SNRs were significantly lower with ClearVoice Medium and/or High compared to Low; however, there were three participants whose SNRs were lowest with ClearVoice Low (P4, P10, P13). Individual mean scores for CUNY sentences are shown in Figure 6 for the three ClearVoice programs. Seven participants had significant differences in scores among ClearVoice programs with ClearVoice Low and Medium providing significantly higher scores (ps < 0.05). In contrast to the R-SPACE™, ClearVoice High never produced significantly better performance than ClearVoice Low or Medium for any of the 15 participants at this soft presentation level in speech-spectrum noise. Individual scores for AzBio sentences are presented in Figure 7. Three of the eight participants tested had significant differences (p < 0.05) between two ClearVoice programs, and interestingly each had their best performance with a different ClearVoice program.
Figure 5.

Mean SNRs for each participant in the R-SPACE™ with ClearVoice Low, Medium and High. An asterisk denotes significant differences between ClearVoice programs (p < 0.05).
Figure 7.

Mean AzBio sentence scores for each participant with ClearVoice Low, Medium and High. An asterisk denotes significant differences between ClearVoice programs (p < 0.05).
Figure 6.

Mean CUNY sentence scores for each participant with ClearVoice Low, Medium and High. An asterisk denotes significant differences between ClearVoice programs (p < 0.05).
Fourteen of fifteen participants completed and returned the questionnaire. Note that participants were using the three ClearVoice programs on their processors when completing the questionnaire. Figure 8 shows the group mean ratings, from 1 (poor speech understanding) to 5 (excellent speech understanding) for each of the listening situations listed to the right of the figure. The group mean ratings across listening situations and participants were similar at 3.02 (SD = .46), 3.38 (SD = .35) and 3.47 (SD=.35) for ClearVoice Low, Medium and High, respectively; however, Figure 8 shows that for several situations ClearVoice Medium and High were rated higher or more effective than ClearVoice Low, specifically for items 3, 4, 5, 11, 12, 13, 14, 18 and 19. These situations involved understanding TV, understanding in noisy environments such as the car, restaurants, social gatherings and understanding in other acoustically challenging environments, i.e., church or in a large meeting room.
Figure 8.

Group mean ratings of speech understanding for 21 listening situations with ClearVoice Low, Medium and High. The listening situations are listed on the right. A rating of 1 indicates poor understanding and 5 excellent understanding.
For general everyday use, three participants (P1, P8, P12) preferred ClearVoice High, seven (P2, P6, P7, P9, P11, P14, P15) preferred ClearVoice Medium, P4 chose both Medium and High as preferred programs, and four (P3, P5, P10, P13) preferred ClearVoice Low. The four participants who preferred ClearVoice Low for daily listening reported using Medium or High in particularly noisy situations (in the car and restaurants). Two participants who preferred ClearVoice Medium reported using High in the car as it provided greater listening comfort than Medium. Three others who preferred ClearVoice Medium stated that they did not care for High in any situation as it provided too much attenuation, and they felt they were missing speech and environmental sounds.
DISCUSSION
In the current study, HINT sentences presented in the R-SPACE™ were the only outcome measure to produce significant group mean differences between ClearVoice and HiRes 120. The noise used in the R-SPACE™ was recorded in a busy restaurant during a party with 42 people in attendance (Compton-Conley et al., 2004). This recording in a reverberant environment with multiple types of noise is likely more representative of steady-state noise than four-, eight- or 12-talker babble (George et al., 2008). Therefore, we speculate that the restaurant noise was identified, differentiated from speech, and attenuated by the ClearVoice algorithm, whereas the multi-talker babble (four, eight or 12-talkers) was not. Although all noisy environments are not the same as a busy restaurant, the R-SPACE™ does reflect a real-world listening situation. It is less common for speech and noise to be from a single source in front of the listener (as in the CUNY sentences and Acceptable Noise Level Test conditions) or for an individual to be listening to speech from the front with all noise located to the better hearing side (BKB-SIN and AzBio test conditions). It is encouraging that ClearVoice benefits were evident in perhaps the most realistic listening environment used in this study.
Results in the R-SPACE™ are calculated as an SNR which can be challenging to translate into benefit provided in daily life. Using performance intensity functions from hearing impaired individuals, a 1 dB decrease in SNR has been reported as equivalent to an 8.9 percentage point increase in speech recognition (Nilsson et al., 1994). Others have reported an increase in speech recognition of 8 to 15 percentage points for every 1 dB improvement in SNR (Gifford et al., 2010). Consequently, the mean 2.5 dB improvement in SNR with ClearVoice High compared to HiRes 120 may translate to a 20–37 percentage point increase in speech recognition in noise. Although the difference in SNR between ClearVoice Medium and HiRes 120 did not reach statistical significance, the mean SNR with ClearVoice Medium was 1.46 dB lower (better) than the mean SNR with HiRes 120 (Figure 1). Again, this improvement may equate to an 11–21 percentage point increase in speech recognition, an increase that would likely be relevant in everyday life.
Group mean results from this study were somewhat different than those found in the Advanced Bionics multi-center clinical trial. The current study found no significant differences between any of the ClearVoice programs and HiRes 120 for sentences in speech-spectrum noise or for sentences in multi-talker babble. The multi-center clinical trial results indicated significantly better performance with ClearVoice Medium and High than HiRes 120 in speech-spectrum noise and significantly better performance with ClearVoice Medium than HiRes 120 in multi-talker babble. However, test conditions differed between the studies. In the multi-center clinical trial, sentences in speech-spectrum noise were presented at a conversational level of 60 dB SPL and the noise varied between 50–58 dB SPL with individually selected SNRs of +10, +8, +5, or +2 dB. In the current study, speech and noise were presented at softer levels (sentences at 50 dB SPL and noise between 42–48 dB SPL) with the majority of participants using an SNR of +5 dB. This test condition was used to better understand the effects of ClearVoice in a listening environment where speech and steady-state background noise are soft, for example when listening to an individual located across the room with fan or air conditioning noise present. The audibility of the sentences should not have been an issue since each participant had mean FM tone, sound-field threshold levels ≤ 30 dB HL from 250–4000 Hz with HiRes 120 and ClearVoice High. Perhaps the soft sentence and noise presentation levels in this study precluded ClearVoice from differentiating speech from noise in order to attenuate the noise.
Test conditions also differed between the two studies for AzBio sentences presented in multi-talker babble. The current study presented sentences at 65 dB SPL in eight-talker babble with sentences administered from the front and babble at 90° to the CI ear. In the multi-center clinical trial, sentences were presented at 60 dB SPL in 20-talker babble, both administered from the front loudspeaker. In particular, the type of babble used may have contributed to the difference in study results. Similar to the R-SPACE™ restaurant noise, the 20-talker babble, recorded in a reverberant cafeteria setting, may be more representative of a steady-state noise than the eight-talker babble (George et al., 2008; Simpson et al., 2005). As discussed in the introduction, the ClearVoice algorithm functions best at attenuating steady-state noise. This may explain why ClearVoice was less effective for the multi-talker babble used in the present study.
It was hoped that the Acceptable Noise Level Test would provide a fairly quick method to determine which ClearVoice program may be most beneficial to individual CI recipients in noise (Donaldson et al., 2009). We expected that higher noise levels would be tolerated with ClearVoice than HiRes 120 when administering the test in 12-talker babble; however, this was not the case. Group mean data were not significantly different between HiRes 120 and ClearVoice Low, Medium or High or between the three ClearVoice programs. Perhaps if a more stationary or steady-state noise were used, larger differences would have emerged.
An obvious choice as to which ClearVoice program provides the most benefit to adult, postlingual HiRes 120 users in daily life is not apparent from this study. In the R-SPACE™, the majority of participants performed best with ClearVoice High and Medium (Figure 5). For sentences presented at a soft level in speech spectrum noise, seven of the 15 participants scored significantly higher (without corrections for multiple comparisons) with either ClearVoice Medium or Low compared to one or both of the other ClearVoice programs (Figure 6). No participant performed significantly better with ClearVoice High in that test condition. Furthermore, six of the 15 participants had significantly worse outcomes with ClearVoice High than with HiRes 120 on at least one of the test measures. Since results varied by participant, best clinical practice and ideal circumstances would include comparison of each ClearVoice program by each CI recipient to determine individual preferences. If that is not possible, these study results and preference data suggest ClearVoice Medium (preferred by 7 of 15 participants) may be the most appropriate ClearVoice setting for everyday use, particularly when a recipient does not change programs throughout the day. R-SPACE™ results and participant reports indicate that ClearVoice High may be most beneficial in restaurants and in the car; consequently, ClearVoice High can be provided as an option for recipients who can reliably change programs based on their listening situation.
In summary, ClearVoice can improve the communication abilities and listening comfort in some noisy environments for postlingually deaf adults who use the HiRes 120 speech processing strategy and the Harmony or Neptune speech processors. Ideally, all recipients should be given the opportunity to try all three ClearVoice programs in daily life to determine which program or programs are preferred. Often this is not feasible; consequently, for individuals willing and able to change programs as their listening environment changes, it is suggested that HiRes 120, ClearVoice High and ClearVoice Medium be placed on the processor with discussion regarding the use of each. For example, clinicians may suggest using High in the car and at restaurants, Medium for most situations, and HiRes 120 in those situations where ClearVoice may not be effective. For individuals who are unable to reliably change programs, ClearVoice Medium is a practical choice and likely will be beneficial for many listening environments encountered in everyday life. If an individual is unable to adjust the volume control, creating a ClearVoice program with raised M-levels may be necessary.
Acknowledgments
This research was partially supported by Grant R01DC009010 (Jill Firszt) from the National Institute of Health/National Institute on Deafness and Other Communication Disorders.
We are grateful to the participants for contributing their time, feedback and effort to complete this study and to Jamie Cadieux for helpful comments on earlier versions of this manuscript.
References
- Advanced Bionics. ClearVoice Technical Facts. Valencia, CA: Advanced Bionics; 2012a. [Google Scholar]
- Advanced Bionics. ClearVoice Clinical Results. Valencia, CA: Advanced Bionics; 2012b. [Google Scholar]
- American National Standards Institute. Maximum Permissible Ambient Noise Levels for Audiometric Test Rooms. New York: 2008. p. S3.1–1999. [Google Scholar]
- Boothroyd A, Hnath-Chisolm T, Hanin L, Kishon-Rabin L. Voice fundamental frequency as an auditory supplement to the speechreading of sentences. Ear and Hearing. 1988;9(6):306–312. doi: 10.1097/00003446-198812000-00006. [DOI] [PubMed] [Google Scholar]
- Brendel M, Buechner A, Krueger B, Frohne-Buechner C, Lenarz T. Evaluation of the Harmony sound processor in combination with the speech coding strategy HiRes 120. Otology and Neurotology. 2008;29(2):199–202. doi: 10.1097/mao.0b013e31816335c6. [DOI] [PubMed] [Google Scholar]
- Buechner A, Brendel M, Saalfeld H, Litvak L, Frohne-Buechner C, Lenarz T. Results of a pilot study with a signal enhancement algorithm for HiRes 120 cochlear implant users. Otology and Neurotology. 2010;31(9):1386–1390. doi: 10.1097/MAO.0b013e3181f1cdc6. [DOI] [PubMed] [Google Scholar]
- Carney E, Schlauch RS. Critical difference table for word recognition testing derived using computer simulation. Journal of Speech and Hearing Research. 2007;50(5):1203–1209. doi: 10.1044/1092-4388(2007/084). [DOI] [PubMed] [Google Scholar]
- Compton-Conley CL, Neuman AC, Killion MC, Levitt H. Performance of directional microphones for hearing aids: real-world versus simulation. Journal of the American Academy of Audiology. 2004;15(6):440–455. doi: 10.3766/jaaa.15.6.5. [DOI] [PubMed] [Google Scholar]
- Donaldson GS, Chisolm TH, Blasco GP, Shinnick LJ, Ketter KJ, Krause JC. BKB-SIN and ANL predict perceived communication abilities in cochlear implant users. Ear and Hearing. 2009;30(4):401–410. doi: 10.1097/AUD.0b013e3181a16379. [DOI] [PubMed] [Google Scholar]
- Etymotic Research. BKB-SIN Speech-in-Noise Test, Version 1.03. Elk Grove Village, IL: Etymotic Research; 2005. [Google Scholar]
- Firszt JB, Holden LK, Reeder RM, Skinner MW. Speech Recognition in cochlear implant recipients: Comparison of standard HiRes and HiRes 120 sound processing. Otology and Neurotology. 2009;30(2):146–152. doi: 10.1097/MAO.0b013e3181924ff8. [DOI] [PMC free article] [PubMed] [Google Scholar]
- George EL, Festen JM, Hourgast T. The combined effects of reverberation and nonstationary noise on sentence intelligibility. Journal of the Acoustical Society of America. 2008;124(2):1269–1277. doi: 10.1121/1.2945153. [DOI] [PubMed] [Google Scholar]
- Gifford RH, Revit LJ. Speech perception for adult cochlear implant recipients in a realistic background noise: Effectiveness of preprocessing strategies and external options for improving speech recognition in noise. Journal of the American Academy of Audiology. 2010;21(7):441–451. doi: 10.3766/jaaa.21.7.3. [DOI] [PMC free article] [PubMed] [Google Scholar]
- Kam ACS, Ng IHY, Cheng MMY, Wong TKC, Tong MCF. Evaluation of the ClearVoice strategy in adults using HiResolution Fidelity 120 sound processing. Clinical and Experimental Otorhinolaryngology. 2012;5(S1):S89–S92. doi: 10.3342/ceo.2012.5.S1.S89. [DOI] [PMC free article] [PubMed] [Google Scholar]
- Killion MC, Niquette PA, Gudmundsen GI, Revit LJ, Banerjee S. Development of a quick speech-in-noise test for measuring signal-to-noise ratio loss in normal-hearing and hearing-impaired listeners. Journal of the Acoustical Society of America. 2004;116(4):2395–2405. doi: 10.1121/1.1784440. [DOI] [PubMed] [Google Scholar]
- Nabelek AK, Freyaldenhoven MC, Tampas JW, Burchfield SB, Muenchen RA. Acceptable noise level as a predictor of hearing aid use. Journal of the American Academy of Audiology. 2006;17(9):626–639. doi: 10.3766/jaaa.17.9.2. [DOI] [PubMed] [Google Scholar]
- Nilsson M, Soli S, Sullivan JA. Development of the hearing in noise test for measurement of speech reception thresholds in quiet and noise. Journal of the Acoustical Society of America. 1994;95(2):1085–1099. doi: 10.1121/1.408469. [DOI] [PubMed] [Google Scholar]
- Revit LJ, Killion MC, Compton-Conley CL. Developing and testing a laboratory sound system that yields accurate real-world results. Hearing Review. 2007;14(11):54–62. [Google Scholar]
- Revit LJ, Schulien RB, Julstrom S. Toward accurate assessment of real-world hearing aid benefit. Hearing Review. 2002;9:34–38. 51. [Google Scholar]
- Simpson SA, Cooke M. Consonant identification in N-talker babble is a nonmonotonic function of N (L) Journal of the Acoustical Society of America. 2005;118(5):2775–2778. doi: 10.1121/1.2062650. [DOI] [PubMed] [Google Scholar]
- Spahr AJ, Dorman MF. Effects of minimum stimulation settings for the Med El Tempo+ speech processor on speech understanding. Ear and Hearing. 2005;26(4):2S–6S. doi: 10.1097/00003446-200508001-00002. [DOI] [PubMed] [Google Scholar]
- Thornton AR, Raffin MJ. Speech-discrimination scores modeled as a binomial variable’. Journal of Speech and Hearing Research. 1978;21(3):507–518. doi: 10.1044/jshr.2103.507. [DOI] [PubMed] [Google Scholar]