

Abstract
Purpose
To assess the intra- and inter-scan reproducibility of LV twist using FAST. Assessing the reproducibility of the measurement of new magnetic resonance imaging (MRI) biomarkers is an important part of validation. Fourier Analysis of STimulated Echoes (FAST) is a new MRI tissue tagging method that has recently been shown to compare favorably to conventional estimates of left ventricular (LV) twist from cardiac tagged images, but with significantly reduced user interaction time.
Materials and Methods
Healthy volunteers (N=10) were scanned twice using FAST over one week. On Day-1 two measurements of LV twist were collected for intra-scan comparisons. Measurements for LV twist were again collected on Day-8 for inter-scan assessment. LV short-axis tagged images were acquired on a 3T scanner in order to ensure detectability of tags during early and mid-diastole. Peak LV twist is reported as mean±SD. Reproducibility was assessed using the concordance correlation coefficient (CCC) and the repeatability coefficient (RC) (95%-CI range).
Results
Mean peak twist measurements were 13.4±4.3° (Day-1, Scan-1), 13.6±3.7° (Day-1, Scan-2), and 13.0±2.7° (Day-8). Bland-Altman analysis resulted in intra- and inter-scan bias and 95%-CI of −0.6° [−1.0°, 1.6°] and 1.4° [−1.0°, 3.0°], respectively. The Bland-Altman RC for peak LV twist was 2.6° and 4.0° for intra- and inter-scan respectively. The CCC was 0.9 and 0.6 for peak LV twist for intra- and inter-scan respectively.
Conclusion
FAST is a semi-automated method that provides a quick and quantitative assessment of LV systolic and diastolic twist that demonstrates high intra-scan and moderate inter-scan reproducibility in preliminary studies.
Keywords: Left Ventricle, Twist, Tagging, Shear, Magnetic Resonance
Introduction
Assessing the reproducibility of the measurement of new magnetic resonance imaging (MRI) biomarkers is an important part of validation. LV twist is the preferred nomenclature of the measurement defined as the difference in the rotation of the apex of relative to that of the base of the heart(1). Twist, according to this nomenclature, has been shown to increase in patients with aortic stenosis(2) and hypertrophic cardiomyopathy(3), and decrease in patients with transmural myocardial infarction(4) and dilated cardiomyopathy(5). As a result, LV twist has been proposed as a functional left ventricular imaging biomarker(6). When tracking changes in twist for longitudinal assessment of disease progression, the reproducibility of the measurement is an important consideration. High reproducibility (low variability) leads to greater confidence in the observed changes and to the requirement for smaller subject sample sizes in clinical trials. However, no intra- or inter-scan reproducibility studies of LV twist derived from tagged MRI have been performed.
Fourier Analysis of STimulated Echoes (FAST) is a new MRI tissue tagging method that has recently been shown to compare favorably to conventional estimates of left ventricular (LV) twist from cardiac tagged images, but with significantly reduced user interaction time(7). The purpose of this study was to assess the intra- and inter-scan reproducibility of LV twist as measured by FAST. Additionally, the reproducibility of Circumferential Longitudinal -shear angle (CL-shear angle) was investigated(8).
Materials and Methods
ORI-SPAMM Sequence
Off-resonance due to field inhomogeneity and chemical shift leads to unwanted signal characteristics, which can lead to inaccuracies in quantitative measures such as LV strain measured by DENSE(9) and rotation or the velocity of flowing blood measured by phase contrast(10). Off-Resonance Insensitive-SPAMM (ORI-SPAMM) was developed to negate the effects of off-resonance accrued during motion encoding. The original SPAMM(11) tagging preparation, Figure 1 A, is used to generate a sinusoidal tagging pattern that can be used to quantify rotation of the LV. The ORI-SPAMM prep, modifies the original SPAMM tagging prep to include a 180° refocusing pulse and a split motion encoding gradient, Figure 1B. The theory behind these pulse sequence alterations has been previously presented as part of ORI-CSPAMM sequence(12). However, the CSPAMM phase-cycling leads to long breath-hold times challenging the breath-hold capabilities of both pediatric and adult patients. ORI-SPAMM was developed as a short breath-hold sequence and when performed at 3.0T, rather than at 1.5T it offers better tag contrast through mid-diastole.
Figure 1.
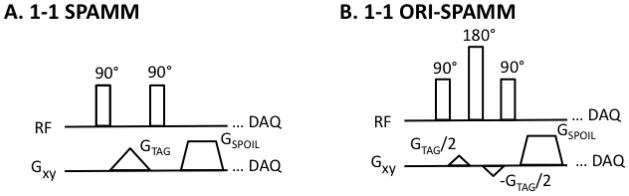
(A) A traditional binomially weighted 1-1 SPAMM tagging preparation is depicted for comparison with updated ORI-SPAMM tagging prep. (B) 1-1 ORI-SPAMM is depicted by the addition of a 180° refocusing RF pulse to the traditional 1-1 SPAMM tagging preparation, in order to correct for off-resonance effects that accrue during motion encoding. In addition, the tagging gradient has been split to minimize the duration of the tag preparation.
Healthy Subjects MRI Protocol
The local institutional review board approved this study and all subjects provided written informed consent. Eleven healthy human subjects with no history of cardiovascular or respiratory disease were included in the study. One subject was excluded due to sickness on the second day of scanning. The remaining 10 subjects were scanned twice (1 female, mean age of 27.9±4.1 years, weight 71.4±10.6 kg, height 1.8±0.1 m, heart rate 55.1±8.6 beats/min).
End expiration breath-held ECG triggered images were acquired for head-first supine subjects, scanned with a Siemens Trio 3.0T scanner (Siemens Healthcare, Erlangen, Germany) and a six element body matrix coil in combination with a six element spine matrix. Axial, coronal, and sagittal orientation scout images were used to plan the study. Balanced steady-state free precession (bSSFP) cine images were acquired using a 6 mm slice thickness and a 66% gap between slices, in parallel left ventricular (LV) short-axis planes and used to select basal and apical slices for acquisition of tagged images. The criteria for selecting short axis slices from which twist measurements were derived was defined as follows: most apical slice containing the presence of the blood pool throughout the entire cardiac cycle and the most basal slice in which the LV myocardium maintained a continuous annular shape during the entire cardiac cycle. These bSSFP slices were used to prescribe the two slices for tagging and subsequent image processing.
A cardiac gated spoiled gradient echo sequence was modified to support 1-1 binomially weighted ORI-SPAMM line tags (with a total tagging flip angle of 134°). This sequence was used to acquire short-axis images at the base and apex of the LV with the following parameters: 280–330×280–330mm field-of-view, 6mm slice thickness, 192×192 acquisition matrix, 395 Hz/pixel receiver bandwidth, TE/TR =2.33–2.39/4.71–4.83 ms, 8 views per segment, 12° imaging flip angle, 8 mm tag spacing, GRAPPA acceleration factor 2 with 24 central lines, and 14–27 cardiac phases. The breath hold duration was 15 heart beats (12.5 ± 1.9 seconds depending upon heart rate). Cine tagged images were acquired using both horizontal and vertical tagging in separate breath holds. Scans were performed at 3.0T to ensure tag contrast through mid-diastole.
Each subject was scanned twice with eight days between the scans. On Day-1 two measurements of LV twist were collected for intra-scan comparisons, using the same apical and basal slice positions for both scans. On Day-8 one measurement of LV twist was collected for inter-scan comparisons. The acquisition order of the apex and base horizontally and vertically tagged slices was randomized to minimize ordering bias arising from heart rate changes due to multiple breath-holds from influencing twist measurements. The distance between apical and basal slices was kept constant between both days of scanning.
Fourier Analysis of STimulated echoes (FAST)
FAST(7) is a semi-automated image processing method designed to quantify LV rotation from tagged MR images. The only user interaction necessary is contouring of the epicardium and endocardium in an end-systolic cardiac frame and in an early systolic cardiac frame, respectively. In this study one operator performed contouring. The main principle of the FAST method is that rotation in image space has a one to one correspondence with rotation in Fourier space, but in Fourier space the tagging information is focused into stimulated echoes, which are easy to track. The user-defined contours are used to isolate the region of interest in the images (LV myocardium), then the images are Fourier transformed. The central peak in Fourier space is nulled and the image is subsequently cropped. Two-dimensional cross-correlation is used to determine rotation between cardiac frames, from which a cumulative rotation of the ventricle with respect to time is determined. When horizontally and vertically tagged images are collected the cumulative rotational data for the two different tagging directions is averaged to combine the data. This process is applied to images collected at both the apex and base of the heart, and the difference between the two rotations is defined as twist. The FAST method has been described in more detail and previously validated using both SPAMM and CSPAMM images in healthy volunteers(7, 14). Peak twist was defined as the maximum difference in rotation between the apex and the base.
The circumferential-longitudinal shear-angle (CL-shear angle) was defined as (8):
where φ is rotation of the apex or base in degrees, ρ is the epicardial radius of the apex or base in mm, and D is the distance between the apex and base in mm. Peak CL-shear angle has been suggested to be a better measure of LV function compared to twist, due to its normalization for heart size and purported relative independence of the selection of imaging planes(1). Twist rate was defined as the discrete derivative of twist with respect to time with units of deg/s. Peak twist rate was defined as the maximum twist rate. Peak diastolic untwist rate was defined as the minimum twist rate.
Statistical Analysis
For each volunteer, the intra- and inter-scan reproducibilities of peak twist were assessed according to the following method. First, a paired t-test was used to test for the difference in peak twist between Day-1, Scan-1 and Day-1, Scan-2 (intra-scan) as well as between Day-1, Scan-1 and Day-8 (inter-scan). A p<0.05 was considered statistically significant.
Next, the concordance correlation coefficient (CCC), a measure which evaluates how close the data are to the line of identity, was used to determine agreement for the intra- and inter-scan peak twist. Lastly, Bland-Altman analysis(15) was used to compute the repeatability coefficient (RC), the range of the 95% confidence interval, for peak twist, which gives an indication of the variability of the measurement of peak twist. Bootstrapping, sampling with replacement (1000 times), was utilized to determine the RC and 95% confidence interval for the median of the difference of peak twist due to the limited sample size and non-Gaussian distribution. Bland-Altman bias is reported as the median of the difference in peak twist. Peak data values were reported as mean ± one standard deviation.
Results
Image Quality
All of the data from all subjects over multiple days of scanning were qualitatively acceptable and routinely analyzable by FAST without issue. Figure 2 depicts an example of basal tagged images from a single normal subject acquired on Day-1 and Day-8. There is a good match between the basal slice levels from Day-1 to Day-8. Additionally, there is a noticeable loss of tissue to tag contrast in the diastolic images. However, since this scan was performed at 3T the tags are visible through mid-diastole.
Figure 2.

This figure represents a typical basal tagged slice acquired on Day-1 Scan -1, Day-2 Scan-2, and Day-8. The tissue to tag contrast fades with time, however, the tags are detectable at end-systole (339ms) through mid-diastole.
Intra-scan Comparisons of LV Twist
Figure 3 illustrates the differences observed in mean twist as a function of frame number for the three separate scans. Mean twist from Day-8 deviates from the other scans starting at end-systole and maintains this deviation through diastole. Note that peak twist observed in these averaged curves is not the same as the average of the individual peaks (Table 1).
Figure 3.

This figure demonstrates the high intra-scan and inter-scan reproducibility of mean LV twist as a function of frame number for Day-1 Scan-1, Day-1 Scan-2, and Day 8. Error bars represent ± 1 standard deviation.
Table 1.
Intra- and Inter- Scan Statistics
| Mean Peak Twist [deg] | Mean Peak CL-Shear Angle [deg] | Mean Peak Twist Rate [deg/s] | Mean Peak Untwisting Rate [deg/s] | Bland-Altman Peak Twist Bias (95% CI) | RC Peak Twist | CCC Peak Twist | P-Value Peak Twist | |
|---|---|---|---|---|---|---|---|---|
| Intra-Scan | 13.4±4.3, 13.6±3.7 | 6.8±1.3, 6.8±1.3 | 80.3±11.8, 81.1±12.1 | −105.3±21.2, −102.2±27.4 | −0.6° [−1.0°, 1.6°] | 2.6° | 0.9 | P=0.9 |
| Inter-Scan | 13.4±4.3, 13.0±2.7 | 6.8±1.3, 6.4±1.2 | 80.3±11.8, 71.2±15.4 | −105.3±21.2, −106.7±23.6 | 1.4° [−1.0°, 3.0°] | 4.0° | 0.6 | P=0.11 |
Intra-scan differences (Day-1, Scan-1 versus Day-1, Scan-2) were not significantly different. Mean peak twist measurements were 13.4±4.3° (Day-1, Scan-1) and 13.6±3.7° (Day-1, Scan-2). Results are summarized in Table 1. Paired t-tests showed no significant differences in peak LV twist for intra-scan values (p=0.90). Bland-Altman analysis resulted in an intra-scan bias and 95%-CI of −0.6° [−1.0°, 1.6°] (Figure 4A). The intra-scan Bland-Altman RC for peak LV twist was 2.6°, showing excellent reproducibility between the two different scans. The intra-scan CCC was 0.9 indicating excellent peak twist agreement.
Figure 4.


(A) Intra-scan Bland-Altman analysis of LV twist estimates indicates excellent agreement. The intra-scan comparison of LV twist measures has a bias of −0.6° and a 95% confidence interval of (−1.0°, 1.6°). (B) Inter-scan Bland-Altman analysis of LV twist estimates indicate good agreement. The inter-scan comparison of LV twist measures has a bias of −1.4° and a 95% confidence interval of (−1.0°, 3.0°).
Mean peak systolic twist rates were 80.3±11.8°/s (Day-1, Scan-1) and 81.1±12.1°/s (Day-1, Scan-2) and the mean peak diastolic untwisting rates were −105.3±21.2°/s (Day-1, Scan-1) and −102.2±27.4°/s (Day-1, Scan-2), respectively. Bland-Altman analysis resulted in an intra-scan bias and 95%-CI of −1.3°/s [−5.3°/s, 3.9°/s] for systolic twist rate and 3.3°/s [−17.3°/s, 10.5°/s] for diastolic untwisting rate.
Inter-scan Comparisons of LV Twist
There was a trend indicating no inter-scan statistical differences (Day-1, Scan-1 versus Day-8). Mean peak twist measurements were 13.4±4.3° (Day-1, Scan-1) and 13.0±2.7° (Day-8). Paired t-tests showed no significant differences in peak LV twist for inter-scan values (p=0.11). Inter-scan Bland-Altman analysis resulted in a bias and 95% CI of 1.4° [−1.0°, 3.0°] (Figure 4B). The Bland-Altman RC derived from the inter-scan peak LV twist was 4.0°, indicating good reproducibility between the scans performed on different days. The inter-scan CCC was 0.6 for peak LV twist, which indicates moderate agreement.
Mean peak systolic twist rate and diastolic untwisting rate were 80.3±11.8°/s and 71.2±15.4°/s (Day-1, Scan-1 and Day 8) and −105.3±21.2°/s and −106.7±23.6°/s, respectively. Bland-Altman analysis resulted in an inter-scan bias and 95%-CI of 4.8°/s [−4.5°/s, 20.1°/s] and 2.0°/s [−25.2°/s, 18.1°/s] for systolic twist rate and diastolic untwisting rate, respectively.
CL-shear angle Comparison
Mean peak CL-shear angles were 6.8±1.3° (Day-1, Scan-1), 6.8±1.3° (Day-1, Scan-2), and 6.4±1.2° (Day-8). Bland-Altman analysis resulted in intra-and inter-scan bias and 95%-CI of 0.0° [−0.7°, 0.9°] and 0.0° [−0.5°, 1.1°], respectively. Paired t-tests showed no significant differences in peak CL-shear angle for intra- and inter-scan values (p=0.91 and p=0.36 respectively). The Bland-Altman RCs for peak CL-shear angle were 1.6° and 1.6° for intra- and inter-scan respectively, demonstrating good repeatability. The CCCs were 0.8 and 0.6 for peak CL-shear angle for intra- and inter-scan respectively, indicating good and moderate agreement respectively.
Discussion
This study demonstrates that peak LV twist is a reproducible quantitative measure of left ventricular function. The intra- and inter-scan RC values were under 4° suggesting the changes in an individuals twist greater than 4° would indicate significant change. If a 4° limit in the absolute difference of the measurements is used to calculate the specificity of LV twist, the specificity would be 80%. Since all volunteers were healthy subjects it is not possible to determine sensitivity.
However, several LV twist studies have reported changes in twist ranging from 3.5° to 7.6° with respect to different cardiovascular diseases. Cheung et al reported a mean peak twist decrease of 3.5° for subjects who underwent Teratology Of Fallot (TOF) repair relative to normal control subjects(16). Lindqvist et al demonstrated a mean peak twist decrease of 4.4° in patients with severe aortic stenosis post aortic valve repair(17). Kanzaki et al demonstrated a decrease in mean peak twist of 7.5° in patients with dilated cardiomyopathy relative to normal control subjects(5). Young et al showed an increase of 5.3° in mean peak twist in patients with hypertrophic cardiomyopathy compared with normal control subjects(3). Shudo et al reported a mean peak twist increase of 7.6° in patients with mitral regurgitation post mitral annuloplasty(18). In all, but one of these studies (TOF repair) FAST would be sensitive enough to detect the change in LV twist.
Peak CL-shear angle also proved to be a highly reproducible measure. The intra- and inter-scan RC values were equal suggesting scanning over multiple visits may be equivalently reproducible. Peak CL-shear angle may prove to be more reproducible over multiple visits than peak twist as the RC represents a smaller percentage of the mean peak CL-shear angle (24%) compared with the RC of peak twist (30%).
This study had three primary limitations: small cohort size, variability of apical and basal slice selection on different days, and physiological differences arising from multiple breath-holds. This study was performed under ideal scanning conditions using a small cohort (n=10) of healthy subjects, thus the results may represent the lowest limits of reproducibility for a well controlled clinical research study. Twist measurements are highly dependent on the choice of apical and basal slices(19). Measures such as torsion and CL-shear angle are often suggested to alleviate the dependence of twist on slice selection. In this study we sought to minimize the slice selection problem by having one MRI operator perform all the scans and by selecting slices with the same separation between scans. Additionally, the heart rates for the normal subjects enrolled in this study was lower than would be expected for clinical patients. The higher heart rates in a clinical setting may necessitate acquisitions with improved temporal resolution so as to maintain the limits of reproducibility reported herein.
Based on the anatomical landmarks that were systematically used for this study, it is possible that the apical and basal slices selected on Day-8 may have both been more apical or basal by up to ~5 mm (half the slice thickness and gap between slices) compared to Day-1. This influence may have contributed to differences seen in inter-scan peak twist, but twist is not expected to vary strongly as a function of apical-basal location hence this error is likely quite small. The decision to keep the distance between slices the same may contribute to less variability in peak CL-shear angle in this study.
In conclusion, FAST is a semi-automated method that provides quick and quantitative assessment of LV systolic and diastolic twist that demonstrates both high intra- and inter-observer reproducibility(7) and now high intra-scan and moderate inter-scan reproducibility. The study has also demonstrated the CL-shear angle is similarly reproducible. FAST estimates of LV twist and CL-shear may serve as a useful quantitative imaging biomarker of LV dysfunction in longitudinal studies.
Acknowledgments
This work was supported by NIH/NHLIB HL087614 to DBE and AHA to MLR
References
- 1.Young AA, Cowan BR. Evaluation of left ventricular torsion by cardiovascular magnetic resonance. J Cardiovasc Magn Reson. 2012;14:49. doi: 10.1186/1532-429X-14-49. [DOI] [PMC free article] [PubMed] [Google Scholar]
- 2.Nagel E, Stuber M, Burkhard B, et al. Cardiac rotation and relaxation in patients with aortic valve stenosis. Eur Heart J. 2000;21:582–589. doi: 10.1053/euhj.1999.1736. [DOI] [PubMed] [Google Scholar]
- 3.Young AA, Kramer CM, Ferrari VA, Axel L, Reichek N. Three-dimensional left ventricular deformation in hypertrophic cardiomyopathy. Circulation. 1994;90:854–867. doi: 10.1161/01.cir.90.2.854. [DOI] [PubMed] [Google Scholar]
- 4.Takeuchi M, Nishikage T, Nakai H, Kokumai M, Otani S, Lang RM. The assessment of left ventricular twist in anterior wall myocardial infarction using two-dimensional speckle tracking imaging. J Am Soc Echocardiogr. 2007;20:36–44. doi: 10.1016/j.echo.2006.06.019. [DOI] [PubMed] [Google Scholar]
- 5.Kanzaki H, Nakatani S, Yamada N, Urayama S, Miyatake K, Kitakaze M. Impaired systolic torsion in dilated cardiomyopathy: reversal of apical rotation at mid-systole characterized with magnetic resonance tagging method. Basic Res Cardiol. 2006;101:465–470. doi: 10.1007/s00395-006-0603-6. [DOI] [PubMed] [Google Scholar]
- 6.Sengupta PP, Tajik AJ, Chandrasekaran K, Khandheria BK. Twist mechanics of the left ventricle: principles and application. JACC Cardiovasc Imaging. 2008;1:366–376. doi: 10.1016/j.jcmg.2008.02.006. [DOI] [PubMed] [Google Scholar]
- 7.Reyhan M, Natsuaki Y, Ennis DB. Fourier analysis of STimulated echoes (FAST) for the quantitative analysis of left ventricular twist. J Magn Reson Imaging. 2012;35:587–593. doi: 10.1002/jmri.22863. [DOI] [PMC free article] [PubMed] [Google Scholar]
- 8.Russel IK, Tecelao SR, Kuijer JP, Heethaar RM, Marcus JT. Comparison of 2D and 3D calculation of left ventricular torsion as circumferential-longitudinal shear angle using cardiovascular magnetic resonance tagging. J Cardiovasc Magn Reson. 2009;11:8. doi: 10.1186/1532-429X-11-8. [DOI] [PMC free article] [PubMed] [Google Scholar]
- 9.Aletras AH, Ding S, Balaban RS, Wen H. DENSE: displacement encoding with stimulated echoes in cardiac functional MRI. J Magn Reson. 1999;137:247–252. doi: 10.1006/jmre.1998.1676. [DOI] [PMC free article] [PubMed] [Google Scholar]
- 10.Middione MJ, Ennis DB. Chemical shift-induced phase errors in phase-contrast MRI. Magn Reson Med. 2012 doi: 10.1002/mrm.24262. [Epub ahead of print] [DOI] [PMC free article] [PubMed] [Google Scholar]
- 11.Axel L, Dougherty L. Mr Imaging of Motion with Spatial Modulation of Magnetization. Radiology. 1989;171:841–845. doi: 10.1148/radiology.171.3.2717762. [DOI] [PubMed] [Google Scholar]
- 12.Reyhan M, Ennis DB. Quantification of Left Ventricular Torsion by Off-Resonance Insensitive CSPAMM (ORI-CSPAMM) Proceedings of the International Society of Magnetic Resonance in Medicine. 2011;19:3373. [Google Scholar]
- 13.Fischer SE, McKinnon GC, Maier SE, Boesiger P. Improved myocardial tagging contrast. Magn Reson Med. 1993;30:191–200. doi: 10.1002/mrm.1910300207. [DOI] [PubMed] [Google Scholar]
- 14.Reyhan M, Ennis DB. Quantitative assessment of systolic and diastolic left ventricular twist using Fourier Analysis of STimulated echoes (FAST) and CSPAMM. J Cardiovasc Magn Reson. 2012;4(Suppl 1):P240. doi: 10.1002/jmri.23849. [DOI] [PMC free article] [PubMed] [Google Scholar]
- 15.Bland JM, Altman DG. Statistical methods for assessing agreement between two methods of clinical measurement. Lancet. 1986;1:307–310. [PubMed] [Google Scholar]
- 16.Cheung YF, Wong SJ, Liang XC, Cheung EW. Torsional mechanics of the left ventricle in patients after surgical repair of tetralogy of Fallot. Circ J. 2011;75:1735–1741. doi: 10.1253/circj.cj-10-1253. [DOI] [PubMed] [Google Scholar]
- 17.Lindqvist P, Zhao Y, Bajraktari G, Holmgren A, Henein MY. Aortic valve replacement normalizes left ventricular twist function. Interact Cardiovasc Thorac Surg. 2011;12:701–706. doi: 10.1510/icvts.2010.262303. [DOI] [PubMed] [Google Scholar]
- 18.Shudo Y, Nakatani S, Sakaguchi T, et al. Left ventricular mechanics following restrictive mitral annuloplasty for functional mitral regurgitation: two-dimensional speckle tracking echocardiographic study. Echocardiography. 2012;29:445–450. doi: 10.1111/j.1540-8175.2011.01607.x. [DOI] [PubMed] [Google Scholar]
- 19.Thompson RB, Paterson I, Chow K, et al. Characterization of the relationship between systolic shear strain and early diastolic shear strain rates: insights into torsional recoil. Am J Physiol Heart Circ Physiol. 2010;299:H898–907. doi: 10.1152/ajpheart.00353.2010. [DOI] [PMC free article] [PubMed] [Google Scholar]
- 20.Dong SJ, Hees PS, Huang WM, Buffer SA, Jr, Weiss JL, Shapiro EP. Independent effects of preload, afterload, and contractility on left ventricular torsion. Am J Physiol. 1999;277:H1053–1060. doi: 10.1152/ajpheart.1999.277.3.H1053. [DOI] [PubMed] [Google Scholar]