

Abstract
Objective
To describe levels of physical activity, sedentary time and adherence to Chief Medical Officers (CMO) physical activity guidelines among primary school-aged children across the UK using objective accelerometer-based measurements.
Design
Nationally representative prospective cohort study.
Setting
Children born across the UK, between 2000 and 2002.
Participants
6497 7-year-old to 8-year-old singleton children for whom reliable accelerometer data were available for at least 10 h a day for at least 2 days.
Main outcome measures
Physical activity in counts per minute (cpm); time spent in sedentary and moderate-to-vigorous intensity physical activity (MVPA); proportion of children meeting CMO guidelines (≥60 min/day MVPA); average daily steps.
Explanatory measures
Gender, ethnicity, maternal current/most recent occupation, lone parenthood status, number of children in the household and country/region of residence.
Results
The median daily physical activity level was 595 cpm (IQR 507, 697). Children spent a median of 60 min (IQR 47–76) in MVPA/day and were sedentary for a median of 6.4 h/day (IQR 6–7). Only 51% met CMO guidelines, with girls (38%) less active than boys (63%). Children took an average of 10 229 (95% CI (8777 to 11 775)) steps each day. Children of Indian ethnicity were significantly less active overall than all other ethnic groups. Children of Bangladeshi origin and those living in Northern Ireland were least likely to meet CMO guidelines.
Conclusions
Only half of 7-year-old children in the UK achieve recommended levels of physical activity, with significant gender, ethnic and geographic variations. Longitudinal studies are needed to better understand the relevance of these (in)activity patterns for long-term health and well-being. In the meantime population-wide efforts to boost physical activity among young people are needed which are likely to require a broad range of policy interventions.
Keywords: Public Health, Sports Medicine, Paediatrics
Article summary.
Article focus
This paper describes levels of physical activity (PA), sedentary time and adherence to Chief Medical Officers PA guidelines among primary school-aged children across the UK using objective accelerometer-based measurements.
Key messages
Fifty-one per cent of 7-year-old UK children achieve current recommendations for daily PA; this is significantly lower in girls (38%) than in boys (63%). This is also lowest in children living in Northern Ireland.
Half of all UK 7-year-olds are sedentary for 6.4 h or more each day.
Social and demographic variations in physical (in) activity levels are otherwise smaller.
A comprehensive policy response is needed to boost PA and decrease sedentary time among all young children to the levels appropriate for good health.
Strengths and limitations of this study
This is the first UK-wide study of children's objectively measured physical (in) activity.
Linkage of the accelerometer data to a range of social and demographic information enabled examination of ethnic, social and geographical variations in activity levels and adherence to policy recommendations.
While accelerometers provide higher levels of measurement precision relative to self-report methods of PA, they can underestimate certain activities like swimming.
The prevalence of adherence to current recommendations for PA is sensitive to the thresholds used to define moderate and vigorous PA.
Introduction
The physical and psychological benefits of physical activity (PA) for children and adolescents include reduced adiposity1 and cardiometabolic risk factors,2 improvements in musculoskeletal health3 and psychological well-being.4 Conversely, and independently of PA levels, high levels of sedentary behaviours such as TV viewing may also predict a poor cardiometabolic risk profile.5 As PA as well as sedentary behaviour track over time,6 7 children with low levels of activity may be at risk of continuing at this level in later life.
Guidelines for PA in children have recently been revised in the USA,8 Canada9 and the UK.10 The latter were launched in July 2011 as a UK-wide consensus from the four nations’ Chief Medical Officers (CMO) on the amount and type of PA for good health at each stage of the lifecourse.10 It is now recommended that all young people engage in moderate-to-vigorous intensity physical activity (MVPA; table 1) for at least 60 min and up to several hours every day. A greater emphasis is now placed on vigorous intensity activities and, for the first time, it is recommended that extended sedentary time should be reduced (although a daily limit is not specified).
Table 1.
Examples of sedentary, moderate and vigorous intensity physical activities
| Activity level | Age-adjusted metabolic equivalent (MET)* | Examples10 |
|---|---|---|
| Sedentary | 1.0–1.5 | Lying, sitting, watching TV, playing video games |
| Moderate | 3.0–5.9 | Bike riding and playground activities. These activities will cause children to get warmer and breathe harder and their hearts to beat faster, but they should still be able to carry on a conversation |
| Vigorous | 6.0–8.9 | Fast running and swimming. These activities will cause children to get warmer, breathe much harder and their hearts to beat rapidly, making it more difficult to carry on a conversation |
*MET, metabolic equivalent; 1 MET is defined as the energy expenditure of sitting quietly, equivalent in children to a resting oxygen intake of ∼6 mL/kg/min.11
The development of accelerometer-based activity monitors has enabled the frequency, intensity and duration of free-living activity to be measured objectively in large-scale population studies12–14 documenting the proportion of children meeting recommended guidelines.15 To date however, accelerometers have not been used in a representative sample of children from all four UK countries.
We report on the time spent in PA and sedentary behaviour in a UK-wide representative sample of primary school-aged children participating in a cohort study. We also evaluate adherence to CMO guidelines and variation according to a range of sociodemographic characteristics.
Methods
The Millennium Cohort Study (MCS) is a prospective study of the social, economic and health-related circumstances of children born in the UK between September 2000 and January 2002.16 The original cohort comprised 18 818 children (72% of those approached) whose parents were first interviewed at home when their child was aged 9 months. Since then data have been collected when the children were aged 3, 5 and 7 years, with follow-up currently being conducted at 11 years and planned for 14 years and beyond.
PA data
PA and sedentary time were measured using the Actigraph GT1M accelerometer (Actigraph, Pensacola, Florida), which has been demonstrated to measure PA reliably in children when compared with measures derived from heart rate monitoring,17 indirect and room calorimetry18 19 and doubly labelled water.20
A total of 14 043 children (13 681 singletons) were interviewed at age 7 and invited to participate in the accelerometry study. Those who consented were subsequently sent an accelerometer in the post, programmed to use a 15 s sampling epoch and to record activity as counts and steps. Participants were instructed to start wearing their accelerometer, on an elastic belt round the waist, the morning after they received it and to continue doing so during waking hours for seven consecutive days. They were asked to remove the accelerometer when bathing or during other aquatic activities.
Data were collected between May 2008 and August 2009. Accelerometers were returned by 9772 singleton children. Data were downloaded using Actigraph software V.3.8.3 (Actigraph, Pensacola, Florida, USA) and subsequently processed in-house,21 according to predetermined processing criteria.22 Non-wear time, defined as time periods of consecutive zero activity counts of 20 min or more, was excluded from analysis. Extreme count values above a threshold of ≥11 715 counts/min (cpm) were removed. A study was performed to discriminate between days when the accelerometer was worn and days when it was likely not worn (eg, during postal delivery) on the basis of the minimum number of valid minutes/day. The threshold was set to ≥150 min/day. The first day with registered time exceeding the threshold was set as start date. The last day with registered time above the threshold was set as end date.22 Participants with registered time of ≥10 h on at least ≥2 days were included in analyses; only days with ≥10 h of recorded time were included as this has been shown to produce reliable estimates of PA.23 This resulted in a final sample size of 6497 singleton children (3176 boys; figure 1) with a total of 36 309 days (nearly 449 000 h) of observation.
Figure 1.
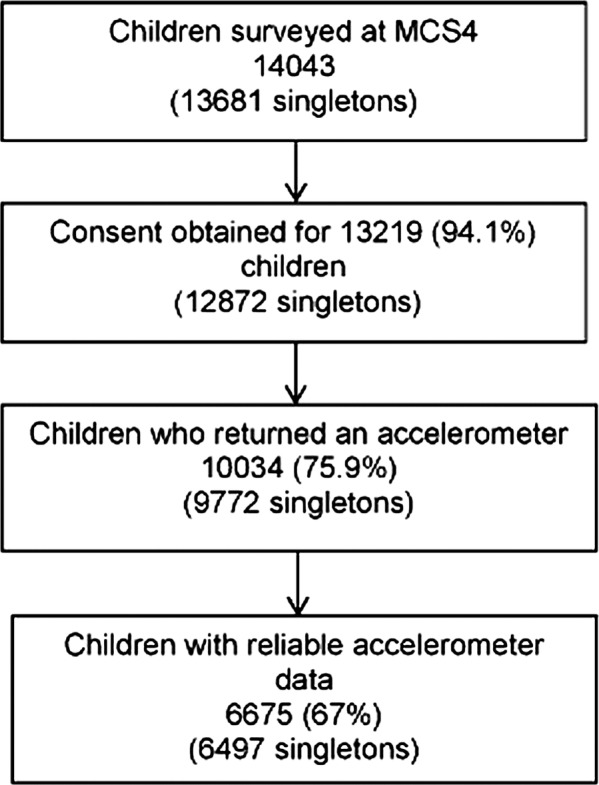
Flow diagram of study participants.
Small differences were found in the demographic characteristics of the sample of children with reliable accelerometer data relative to the whole cohort sample (n=13 681) interviewed at age 7 years (see online supplementary eTable 1). In particular, boys, children living in Wales, those belonging to the Indian, Pakistan/Bangladeshi and Black Caribbean/African ethnic groups, as well as children belonging to families with a single respondent at the interview showed a lower probability of having a valid accelerometer file. Information on predictors of reliable data acquisition in this study is available elsewhere.24
For each child the following variables were derived: total PA (average cpm) over the period worn, mean daily steps and minutes of sedentary time (defined as <100 cpm) and MVPA (>2241 cpm). These cut-off values were established to identify sedentary behaviour and light, moderate and vigorous PA using linear discriminant analysis and evaluated using receiver-operating characteristic curve analysis, and were taken from a calibration study in 7-year-olds, carried out specifically for this larger study.25 They are similar to those reported by Evenson et al.26 The start and end dates were detected based on a specified amount of daily waking time (defined as between 07:00 and 21:59) required to be different from zero counts: the threshold for the observational period was again set to at least 150 min/day. Total registered time is not constant across days. As a result, the total amount of counts and wearing time for each child will depend on how long the accelerometer was worn. These measures were standardised by introducing the notion of a standard day with equal duration (ie, 735 min, equal to mean wear time across all reliable days).27 For each child time spent in MVPA was used to determine adherence to the CMO PA guideline (≥60 min daily) and was based on the standardised average minutes/day spent in MVPA, where the objective of standardisation was to standardise wearing time across days.
Explanatory variables
We examined the association of the following social and demographic factors, collected in the home-based interview at 7 years: child's gender; age; ethnicity;28 maternal current or most recent occupation by child age 729; family structure (lone parent and number of children) and country of residence (England, Scotland, Wales and Northern Ireland) and (within England) Government Office Region of residence. Yearly seasons of measurement were defined astronomically, that is, spring (21 March–20 June), summer (21 June–20 September), autumn (21 September–20 December) and winter (21 December–20 March).
Statistical analyses
Analyses were conducted using STATA/SE V.11.2 (Stata Corporation, Texas, USA) and the R software environment for statistical computing V.2.15.0.30 31 Sampling weights were used to account for the stratified clustered design of the MCS. Weights were adjusted for attrition between contacts at successive MCS sweeps and for missing accelerometer data. Details on the adjustment for non-response and non-compliance are given elsewhere.27 Prevalences of the children meeting the CMO current PA guideline were derived, as were medians and IQRs for derived activity variables (given their non-normal distributions). Quantile regression models for medians and quartiles were fitted using the R package quantreg32 to examine differences between sociodemographic groups in terms of time spent in physical (in)activity adjusting for season of measurement. These models do not make assumptions about the shape of the distribution. Therefore they are robust to departures from normality, as for example, skewness, heavy-tailedness and heteroscedasticity, which affected all PA outcomes in this study. The Benjamini-Hochberg33 correction for false discovery rate in multiple comparisons was also applied setting the point-wise threshold for the correction at 0.05. We used the R package multtest34 to adjust p values for multiple comparisons using this correction. Multivariable logistic regression models were fitted to analyse differences between sociodemographic groups for prevalences of children meeting the MVPA guideline. Prevalences were adjusted for gender, ethnicity, maternal current or most recent occupation, lone parenthood status, number of children in the household, country of residence and season of measurement. Moran's I test35 was used to assess spatial autocorrelation among regions within England using a weighted matrix with a second-order nearest neighbourhood structure.36
Results
The majority of children in the sample (85%) were white (see online supplementary eTable 1), 49% were boys, 88% were living in households including at least one other child and 65% lived in England. The current or most recent occupation of mothers by child age 7 years was semiroutine and routine in 36%; 22% of mothers were lone parents. Mean age when wearing the accelerometer was 7.5 years.
Seasonally adjusted medians of derived PA variables are summarised in table 2.
Table 2.
Description of physical activity (PA) measures; adjusted(*) median and IQR, unless otherwise stated (N=6497)
| N | Overall activity (counts/min) | Sedentary (hours/day) | Moderate and vigorous (min/day) | Steps/day | Percentage of children meeting recommended PA (SE(†)) | |
|---|---|---|---|---|---|---|
| All children | 6497 | 595 507, 697 |
6.4 5.9, 6.9 |
60.1 47.1, 76.2 |
10 229 8777, 11 775 |
50.8 (0.009) |
| Child's gender | ||||||
| Male | 3176 | 630a (§) 541, 757 |
6.4a 5.9, 6.9 |
67.1a 53.9, 83.7 |
10739a 9213, 12 499 |
63.3a (0.012) |
| Female | 3321 | 561a 481, 656 |
6.5a 6.0, 7.2 |
54.4a 44.4, 67.1 |
9699a 8389, 11 063 |
37.8a (0.011) |
| Child's ethnicity(‡) | ||||||
| White | 5710 | 597a 512, 701 |
6.5a,b 6.0, 7.1 |
60.2a 47.8, 75.9 |
10343a–f 8926, 11 940 |
51.4 (0.010) |
| Mixed | 168 | 572b 505, 643 |
6.8a 6.3, 7.3 |
62.2b 49.9, 66.7 |
10071a,g–i 8553, 11 167 |
51.5 (0.040) |
| Indian | 139 | 511a–e 437, 680 |
6.9b–f 6.4, 7.4 |
52.6a–d 40.9, 66.7 |
8699b,g 7477, 9667 |
40.0 (0.049) |
| Pakistani | 177 | 563c 484, 680 |
6.4c 5.9, 7.0 |
58.2 46.4, 74.8 |
9419c,h 7906, 11 120 |
45.2 (0.058) |
| Bangladeshi | 70 | 538 450, 639 |
6.5d
6.0, 7.0 |
52.9 42.1, 70.6 |
8894d,i 6889, 10 013 |
32.8 (0.087) |
| Black | 142 | 598d 517, 737 |
6.5e
6.0, 7.0 |
63.1c 52.6, 86.3 |
9468d 7878, 10 857 |
52.0 (0.054) |
| Other | 90 | 581e 476, 650 |
6.5f
6.1, 7.7 |
58.2 45.8, 74.1 |
9814f 8270, 10 798 11 710 440 |
53.9 (0.081) |
| Maternal current or most recent occupation by child age 7 | ||||||
| Managerial and professional occupations | 2190 | 585 502, 690 |
6.6a
6.0, 7.1 |
59.4 46.8, 74.6 |
10 135 8685, 11 662 |
48.8a (0.013) |
| Intermediate occupations | 1202 | 597 511, 697 |
6.5b
6.1, 7.0 |
58.39.2 47.8, 75.8 |
10 239 8843, 11 722 |
48.7b (0.017) |
| Small employers and own account workers | 442 | 596 516, 671 |
6.6 6.1, 7.0 |
60.5c 48.3, 73.6 |
10 237 8901, 11 598 |
48.6c (0.031) |
| Lower supervisory and technical occupations | 288 | 598 505, 675 |
6.6c
6.1, 7.0 |
60.5 48.3, 73.6 |
10 152 8596, 11 710 |
51.0 (0.033) |
| Semiroutine and routine occupations | 1865 | 597 508, 710 |
6.5d
5.9, 7.0 |
61.5 47.3, 77.2 |
10 380 8891, 12 127 |
52.3 (0.015) |
| Never worked and long-term unemployed | 268 | 603 529,, 607 |
6.3a–d
5.9, 6.9 |
62.2 49.1, 77.0 |
10 116 8702, 11 017 |
59.7a–c (0.040) |
| Lone parenthood status | ||||||
| No | 5536 | 589a 504, 693 |
6.54a
6.0, 7.1 |
59.6a 47.1, 75.0 |
10127a 8683, 11 703 |
49.7a (0.010) |
| Yes | 961 | 606a 521, 712 |
6.48a
5.9, 7.0 |
63.0a 50.3, 78.2 |
10471a 9026, 12 242 |
54.7a (0.021) |
| No. of children in the household | ||||||
| Only child | 726 | 594 510, 679 |
6.6a 6.1, 7.1 |
61.9 48.0, 74.9 |
10 259 8920, 11 950 |
51.9 (0.023) |
| At least one other child | 5771 | 593 507, 697 |
6.5a 6.0, 7.0 |
60.0 47.5, 75.9 |
10 222 8761, 11 762 |
50.7 (0.009) |
| Country | ||||||
| England | 4204 | 589a,b 504, 692 |
6.6a,b 6.0, 7.1 |
60.6a 46.9, 75.3 |
10147a,b 8743, 11 763 |
50.9a (0.011) |
| Wales | 898 | 606a 509, 711 |
6.5a 5.9, 7.0 |
61.6b 47.0, 77.8 |
10357a,c 8931, 11 922 |
51.7b (0.021) |
| Scotland | 761 | 615b,c 578, 715 |
6.4b,c 5.9, 6.9 |
61.8c 50.5, 78.1 |
10521b,d 9022, 12 027 |
52.5c (0.024) |
| Northern Ireland | 634 | 586c 486, 617 |
6.6c 6.0, 7.1 |
57.6a–c 45.5, 73.4 |
9895c,d 8031, 11 351 |
43.4a–c (0.021) |
(*) Medians and IQR adjusted by seasons of measurement.
(†) The prevalences of children meeting the recommended MVPA guidelines are adjusted for gender, ethnicity, maternal current or most recent occupation, lone parenthood status, number of children in the household, country of residence and season of measurement.
(‡) This variable was based on a derived variable from the 2001 Census ethnicity categories indicating the ethnic identity of the children in the MCS data. Aggregate groupings were imposed on these categories to create a smaller manageable number of categories. The names of the groups were also adjusted for reporting. The final ethnic groups were: White (including White-British, White-Irish, White-Welsh, White-Scottish and other white background); Mixed; Indian; Pakistani; Bangladeshi; Black (including Black-Caribbean, Black-African and Black-British) and other (including other Asian, other Black, Chinese and other).
(§) As there are many multiple comparisons among levels of factors included in the models, this table does not show any p values and only indicates those pairwise differences which were significantly different after applying the Benjamini-Hochberg correction for false discovery rate. We used superindices (a–i) to indicate pairs of groups within a factor that differed significantly pairwise (p<0.05). For example, medians of minutes of overall activity significantly differed pairwise between England and Wales (a), England and Scotland (b), and Scotland and Northern Ireland (c).
Median PA was 595 (IQR 507, 696) cpm. Median daily minutes spent in MVPA was 60. (IQR 47.1, 76.2) and 50% of children were sedentary for 6.4 h (IQR 5.9, 6.9) or more each day. Children took a median of 10 229 (IQR 8777, 11 775) daily steps. We estimated that half of all children (50.8%) achieved ≥60 min of daily MVPA.
Girls engaged less in total PA and MVPA, and took fewer steps than boys. They were also more sedentary and were less likely than boys to meet the daily MVPA recommendation (37.8% vs 63.3%).
Overall activity levels were lowest in children of Indian origin, who also recorded the least MVPA, were among the most sedentary and took the fewest steps. MVPA levels were lower in girls than in boys across all ethnic groups (figure 2). Bangladeshi children were the least likely (32.8%) to meet the MVPA recommendation. In pairwise comparisons children of Indian ethnicity were significantly less active overall than all other ethnic groups. Those children whose mothers have never worked or had been long-term unemployed were the most likely to meet recommended levels of daily PA and had the lowest median of daily hours of sedentary behaviour.
Figure 2.
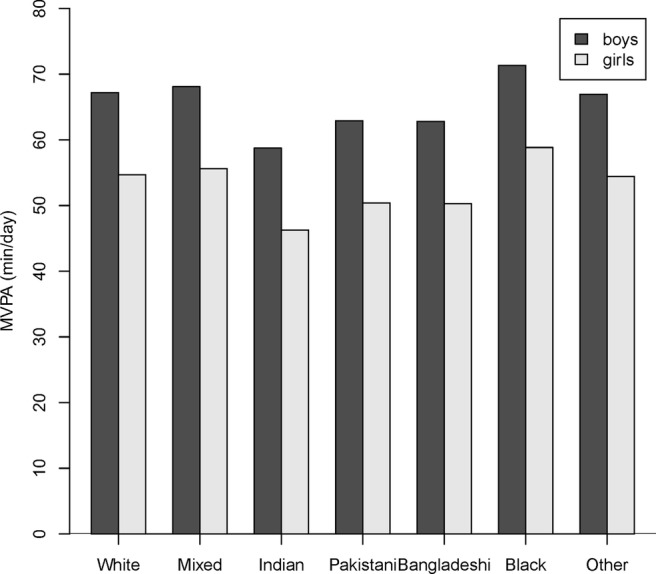
Median minutes/day of moderate-to-vigorous intensity physical activity by gender and ethnicity adjusting by season of measurement.
Children from couple parent families engaged in less total PA and daily MVPA than those whose mothers did not live with partners. They also took the least steps and were least likely to meet the MVPA recommendation. Little variation was found in PA levels according to the number of children living in the household, although lone children in the household were slightly more sedentary.
There were significant differences between UK countries: those living in Northern Ireland engaged in the least total PA, daily MVPA and took the fewest steps. Children in Scotland were the least sedentary, Children in Northern Ireland had the lowest prevalence of the recommended amount of daily MVPA (43.4%), while 50.9% of those living in England, 51.7% of those in Wales and 52.5% of those in Scotland, achieved the recommended amount of daily MVPA. Though spatial autocorrelation was not statistically significant (I=0.05, p=0.822) some regional differences within England were also identified (figure 3); children in the North West were the most likely (57.8%) and those in the Midlands the least likely (46%) to meet the CMO guideline.
Figure 3.

Prevalence of children meeting physical activity recommendation of ≥60 min/day moderate-to-vigorous intensity physical activity (%).
Discussion
Statement of principal findings
This is the first population-based UK-wide study of objectively measured PA and sedentary time in primary-school aged children. We found that when measured in 2008–2009, 51% of children met the CMO recommendation of 60 min or more of daily MVPA.10 37 More than half of all children spent a substantial part of the day being sedentary.
This study highlights social and demographic variation in the UK children's PA and inactivity. Girls were more sedentary than boys and less active across all intensities of PA. Ethnic differences were observed with children of Indian origin generally the least active across all outcomes and Bangladeshi children were least likely to achieve recommended levels of PA. There were no clear socioeconomic gradients in PA levels and adherence to guidelines, although there was a tendency for children whose mothers were never employed or unemployed to be slightly more active than children whose mothers were employed. Children of lone parents were slightly more active and more likely to meet the MVPA recommendations than those from couple parent families. There were differences between UK countries with children in Northern Ireland less active and least likely to achieve recommended activity levels than those from other countries. Nevertheless, with the exception of gender, the group differences observed in this study were relatively small and the most striking finding is the low level of activity across all groups.
Strengths and limitations
The strengths of this study include the large UK-wide and representative sample, the use of accelerometers to provide objective measures of PA and sedentary time, and the data processing undertaken to exclude any data that might be unreliable. As there is limited consensus on data reduction strategies,38 most commonly relating to the best threshold with which to define MVPA, we derived the thresholds used in our study from a calibration study we conducted specifically in this age group and consider the thresholds used to be reliable.25 The ability to link accelerometer data to a rich range of social and demographic information has enabled examination, for the first time, of ethnic, social and geographical variations in adherence to policy recommendations. Acknowledged limitations include potential underestimation, of PA as a result of the accelerometers used, the position in which they are worn or their removal during some activities, such as aquatic activities or contact sports.
Comparison with literature
Findings from the large (defined as ≥400 participants) UK-based accelerometry studies reporting adherence to PA guidelines are summarised in table 3.
Table 3.
Summary of accelerometry studies in the UK-based school-aged children
| Prevalence sufficiently active* (%) |
||||||
|---|---|---|---|---|---|---|
| Reference and study name/size | Setting | Year measured | Mean age (years) | Threshold used to define MVPA | Boys | Girls |
| National probability samples | ||||||
| MCS (current study) (n=6497) |
England, Scotland, Wales and Northern Ireland | 2008–2009 | 7.5 | 2240 cpm25 | 63 | 38 |
| HSE 200839 (n=1286) |
England | 2008 | 9.9 | 2802 cpm39 | 33 | 21 |
| Regional samples | ||||||
| Basterfield et al40 Gateshead Millennium Study (n=405) |
England (Gateshead) | 2006–2007 and 2008–2009 | 7.4 and 9.3 |
3200 cpm19 | 7 years: 10.1 9 years: 8.6 |
7 years: 2.9 9 years: 2.9 |
| Owen et al41 CHASE (n=2071) |
England (London, Birmingham and Leicester) | 2006–2007 | 9.9 | 2000 cpm18 | 76 | 53 |
| Steele et al42 SPEEDY (n=1862) |
England (Norfolk) | 2007 | 10.2 | 2000 cpm18 | 81.5 | 59.4 |
| Gidlow et al43 CHAMPS UK (n=503) |
England (Stoke-on-Trent) | 2006–2007 | 10.4 | Age-specific thresholds44 and 3200 cpm19 | 9444 5.219 |
8944 1.419 |
| Riddoch et al45 ALSPAC (n=5595) |
England (Bristol) | 2003–2005 | 11 | 3600 cpm46 | 5.1 | 0.4 |
*Accumulating ≥60 min/day MVPA. The exact measure used to define adherence to this guideline varies across the studies tabulated: in MCS, Gateshead, SPEEDY and ALSPAC studies a mean of 60 min or more was used; in the CHASE study only the first day of measurement, and in the Health Survey only a subsample with 7 days of observation each with at least 60 min of MVPA/day.
ALSPAC, Avon Longitudinal Study of Parents and Children; CHAMPS, Children's Health and Activity Monitoring Programme in Schools; CHASE, Child Heart and Health Study; cpm, counts per minute; MCS, Millennium Cohort Study; MPVA, moderate-to-vigorous intensity physical activity; SPEEDY, Sport, Physical Activity and Eating Behaviour, Environmental Determinants in Young People.
In none were children measured in population-based samples from all four UK countries. The Millennium Gateshead Study measured children of a similar age to those in our study, although in a much smaller sample. The results show wide variation in the proportions reported to adhere to recommended guidelines on activity but are consistent with our finding that boys are more active than girls. These differences may in part be due to the use of different MVPA intensity thresholds, ranging from 2000 to 3600 cpm. We examined this by recalculating our data using different thresholds: the percentage of children meeting recommendations increased to 80.4% (SE of proportion: 0.010) and 59.4% (0.011) for boys and girls, respectively, when applying a threshold of 2000 cpm and fell to 13.7% (0.008) and 0.4% (0.005) when applying a higher threshold of 3000 cpm. Clearly, therefore, our estimates are similar to some of these other studies41 42 when a similar threshold of 2000 cpm is applied. However, other differences may reflect variation in regions, sampling methods and settings for recruitment as well as in approaches to adjustment for missing data. Further work is needed to clearly define the best thresholds for different intensities of activity in children incorporating novel statistical techniques.47 Clarity over thresholds will be important for routine surveillance measures to monitor the achievement of policy objectives relating to PA. Differences in estimates of sedentary time and numbers of steps between studies may reflect measurement period, while decisions made about removal of zero values may also influence sedentary time. These parameters are not consistently reported in published reports.
Only one other large-scale study in the UK has examined ethnic differences in objectively measured PA. Owen et al41 reported lower levels in South Asian children than European whites and black African-Caribbeans, with 54%, 70% and 69%, respectively, meeting the recommendations. We also found that children of Bangladeshi origin were the least likely to meet these recommendations. Further research is however needed to explore the different cultural and social factors that determine these ethnic differences in activity levels.
Although activity levels differed between children from different socioeconomic circumstances, with those less advantaged slightly more active, we did not find a strong social gradient; this is consistent with other published evidence.45 48 This is the only study to report country and regional differences across the UK and so direct comparisons with other studies cannot be made.
The children in our study engaged in slightly less sedentary time than observed in older children in other UK-based accelerometry studies. For example, in the Avon Longitudinal Study of Parents and Children 7 and 7.3 h of daily sedentary time were reported in 12-year-old boys and girls, respectively, increasing at older ages.49 In a cross-sectional study of English 10-year-olds, Steele et al42 reported 7.5 and 7.7 h for boys and girls, respectively.
Tudor-Locke et al50 recommend that school-aged boys and girls should be encouraged to undertake 13 000–15 000 and 11 000–12 000 steps/day, respectively. The children in this study accumulated fewer steps than this (boys10 732; girls 9675); however, our estimates are very similar to those reported by Owen et al41 (boys 10 570; girls 9123) who also reported higher step numbers in white compared to black and Asian children, which is consistent with our findings.
Unanswered questions and future research
We are currently examining influences on PA and sedentary time in this representative cohort of school-aged children in more detail using longitudinal data to examine their prior determinants. Once follow-up data become available from subsequent contacts with cohort members we propose to examine the consequences for health in later childhood and adolescence. Objective measures of PA and sedentary time can allow these influences to be characterised with greater precision and to be compared with subjective and proxy reports of engagement in PA and sedentary behaviours, also collected within this cohort. We have documented the accelerometer data and derived variables, and these are accessible to other researchers through the UK Data Service.
Implications for practice and policy
Last year the London 2012 Olympic Games promised to inspire a generation to take part in sport. The UK sporting success in August 2012 provided a platform for the Government's plans for an Olympic and Paralympic sporting legacy,51 to encourage and enable pupils to engage in competitive sports and activities. The results of our study provide a useful baseline and strongly suggest that contemporary UK children are insufficiently active, implying that effort is needed to boost PA among young people to the level appropriate for good health. This is likely to require population-wide interventions across the range of PA domains. There are many opportunities to increase PA through sport but also in other areas.52 The journey to school has been recognised as an important opportunity for increasing total as well as more intense PA. Urban environments are also important for children’s PA,53 and factors from available green space to perceptions of safety all impact on children's activity. The full potential to boost PA will only be realised with a comprehensive policy response that increases time spent in more intense PA and decreases the time spent being sedentary. Investing in this area is a vital component to deliver the Olympic legacy and improve the short and long-term health of our children.
Supplementary Material
Acknowledgments
The co-operation of the participating families is gratefully acknowledged.
Footnotes
Contributors: CR, MG, MC-B, LJG, CD, FS and TP contributed to data processing. TP, MC-B and FS conducted the data analysis and, with LJG and CD, interpreted the data and drafted the article. All authors contributed to the study conception/design, critically revised the article and reviewed the final draft of the article. LJG is the guarantor.
Funding: The Wellcome Trust (grant 084686/Z/08/A) funded the accelerometry data collection study. The Centre for Paediatric Epidemiology and Biostatistics is supported in part by the Medical Research Council in its capacity as the MRC Centre of Epidemiology for Child Health (Grant reference G0400546). Research at the UCL Institute of Child Health and Great Ormond Street Hospital for Children receives a proportion of the funding from the Department of Health's National Institute for Health Research Biomedical Research Centres funding scheme. The fourth sweep of the Millennium Cohort Study was funded by grants to Professor Health Joshi, former director of the study, from the Economic and Social Research Council and a consortium of government funders. The current director is Professor Lucinda Platt.
Competing interests: None.
Ethics approval: Northern and Yorkshire Research Ethics Committee (07/MRE03/32).
Provenance and peer review: Not commissioned; externally peer reviewed.
Data sharing statement: The MCS data for surveys 1–4 can be downloaded from: http://www.esds.ac.uk/findingData/mcs.asp.
References
- 1.Hills AP, Andersen LB, Byrne NM. Physical activity and obesity in children. Br J Sports Med 2011;45:866–70 [DOI] [PubMed] [Google Scholar]
- 2.Owen CG, Nightingale CM, Rudnicka AR, et al. Physical activity, obesity and cardiometabolic risk factors in 9- to 10-year-old UK children of white European, South Asian and black African-Caribbean origin: the Child Heart and Health Study in England (CHASE). Diabetologia 2010;53:1620–30 [DOI] [PMC free article] [PubMed] [Google Scholar]
- 3.Tobias JH, Steer CD, Mattocks CG, et al. Habitual levels of physical activity influence bone mass in 11-year-old children from the United Kingdom: findings from a large population-based cohort. J Bone Miner Res 2007;22:101–9 [DOI] [PMC free article] [PubMed] [Google Scholar]
- 4.Ekeland E, Heian F, Hagen KB. Can exercise improve self esteem in children and young people? A systematic review of randomised controlled trials. Br J Sports Med 2005;39:792–8 [DOI] [PMC free article] [PubMed] [Google Scholar]
- 5.Ekelund U, Brage S, Froberg K, et al. TV viewing and physical activity are independently associated with metabolic risk in children: the European Youth Heart Study. PLoS Med 2006;3:e488. [DOI] [PMC free article] [PubMed] [Google Scholar]
- 6.Kwon S, Janz KF. Tracking of accelerometry-measured physical activity during childhood: ICAD pooled analysis. Int J Behav Nutr Phys Act 2012;9:68. [DOI] [PMC free article] [PubMed] [Google Scholar]
- 7.Biddle SJ, Pearson N, Ross GM, et al. Tracking of sedentary behaviours of young people: a systematic review. Prev Med 2010;51:345–51 [DOI] [PubMed] [Google Scholar]
- 8.U.S Department of Health and Human Services 2008 physical activity guidelines for Americans. Washington, U.S. Department of Health and Human Services, 2008 [Google Scholar]
- 9.Tremblay MS, Warburton DER, Janssen I, et al. New Canadian Physical Activity Guidelines. Appl Physiol Nutr Metab 2011;36:36–46 [DOI] [PubMed] [Google Scholar]
- 10.Department of Health. Start active, stay active: a report on physical activity from the four home countries’ Chief Medical Officers. 11-7-0011.
- 11.Harrell JS, McMurray RG, Baggett CD, et al. Energy costs of physical activities in children and adolescents. Med Sci Sports Exerc 2005;37:329–36 [DOI] [PubMed] [Google Scholar]
- 12.Reilly JJ, Ness AR, Sherriff A. Epidemiological and physiological approaches to understanding the etiology of pediatric obesity: finding the needle in the haystack. Pediatr Res 2007;61:646–52 [DOI] [PubMed] [Google Scholar]
- 13.Troiano RP. Large-scale applications of accelerometers: new frontiers and new questions. Med Sci Sports Exerc 2007;39:1501. [DOI] [PubMed] [Google Scholar]
- 14.Trost SG, McIver KL, Pate RR. Conducting accelerometer-based activity assessments in field-based research. Med Sci Sports Exerc 2005;37(Suppl 11):S531–43 [DOI] [PubMed] [Google Scholar]
- 15.Hamer M, Fisher A. Are interventions to promote physical activity in children a waste of time? BMJ 2012;345:e6320. [DOI] [PubMed] [Google Scholar]
- 16.Hansen K. Millennium Cohort Study first, second, third and fourth surveys: a guide to the datasets 6th edn London: Centre for Longitudinal Studies, University of London, 2012 [Google Scholar]
- 17.Ott AE, Pate RR, Trost SG, et al. The use of uniaxial and triaxial accelerometers to measure children's “free-play” physical activity. Pediatr Exerc Sci 2000;12:360–70 [Google Scholar]
- 18.Trost SG, Ward DS, Moorehead SM, et al. Validity of the computer science and applications (CSA) activity monitor in children. Med Sci Sports Exerc 1998;30:629–33 [DOI] [PubMed] [Google Scholar]
- 19.Puyau MR, Adolph AL, Vohra FA, et al. Validation and calibration of physical activity monitors in children. Obes Res 2002;10:150–7 [DOI] [PubMed] [Google Scholar]
- 20.Ekelund U, Yngve A, Brage S, et al. Body movement and physical activity energy expenditure in children and adolescents: how to adjust for differences in body size and age. Am J Clin Nutr 2004;79:851–6 [DOI] [PubMed] [Google Scholar]
- 21.Geraci M.2012. pawacc: Physical activity with accelerometers. R package version 1.0. http://r-forge r-projectorg/projects/pawacc/
- 22.Geraci M, Rich C, Sera F, et al. 2012. Technical report on accelerometry data processing in the Millennium Cohort Study. http://discovery ucl ac uk/1361699/
- 23.Rich C, Geraci M, Griffiths L, et al. Quality control methods in accelerometer data processing: defining minimum wear time. PLoS ONE 2013;8:e67206 [DOI] [PMC free article] [PubMed] [Google Scholar]
- 24.Rich C, Cortina-Borja M, Dezateux C, et al. Predictors of non-response in a UK-wide cohort study of children's accelerometer-determined physical activity using postal methods. BMJ Open 2013;3:e002290. [DOI] [PMC free article] [PubMed] [Google Scholar]
- 25.Pulsford RM, Cortina-Borja M, Rich C, et al. Actigraph accelerometer-defined boundaries for sedentary behaviour and physical activity intensities in 7-year-old children. PLoS ONE 2011;6:e21822. [DOI] [PMC free article] [PubMed] [Google Scholar]
- 26.Evenson KR, Catellier DJ, Gill K, et al. Calibration of two objective measures of physical activity for children. J Sports Sci 2008;26:1557–65 [DOI] [PubMed] [Google Scholar]
- 27.Griffiths LJ, Rich C, Geraci M, et al. 2013. Technical report on the enhancement of Millennium Cohort Study data with accelerometer-derived measures of physical activity and sedentary behaviour in seven year olds. http://www esdsacuk/doc/7238/mrdoc/pdf/mcs4_pa_technical_reportpdf.
- 28.Office for National Statistics Ethnic Group Statistics: a guide for the collection and classification of ethnicity data. London: The Stationery Office, 2003 [Google Scholar]
- 29.Rose D, Pevalin D. A researcher's guide to the National Statistics Socio-economic Classification. London: Sage Publications, 2003 [Google Scholar]
- 30.R Core Team R: a language and environment for statistical computing. Vienna, Austria: R Foundation for Statistical Computing, 2012 [Google Scholar]
- 31.Geraci M. Estimation of regression quantiles in complex surveys with data missing at random: an application to birthweight determinants. Stat Methods Med Res (In press) doi:10.1177/0962280213484401 [DOI] [PubMed] [Google Scholar]
- 32.Koenker R.2012. Quanteg: Quantile Regression R package version 4.79. http://CRAN R-project org/package=quanteg (cited 8 August 2012)
- 33.Benjamini Y, Hochberg Y. Controlling the false discovery rate: a practical and powerful approach to multiple testing. J R Stat Soc Ser B (Methodol) 1995;57:289–300 [Google Scholar]
- 34.Pollard KS, Gilbert HN, Ge Y, et al. Multtest: resampling-based multiple hypothesis testing. 2012. R package version 2.12.0.
- 35.Cliff AD, Ord JK. Spatial processes. London: Pion, 1981 [Google Scholar]
- 36.Anselin L. Exploratory spatial data analysis and geographic information systems. In: Longley P, Brooks S, Macmillan B, et al. eds. GeoComputation: a primer. New York: Willey, 1994:77–94 [Google Scholar]
- 37.Department of Health At least 5 a week: physical activity and health outcomes: a review of the Chief Medical Officer. London: Department of Health, 2004 [Google Scholar]
- 38.Ekelund U, Tomkinson G, Armstrong N. What proportion of youth are physically active? Measurement issues, levels and recent time trends. Br J Sports Med 2011;45:859–65 [DOI] [PubMed] [Google Scholar]
- 39.The NHS Information Centre. 2009. The Health Survey for England—2008: Physical Activity and Fitness.
- 40.Basterfield L, Adamson AJ, Frary JK, et al. Longitudinal study of physical activity and sedentary behavior in children. Pediatrics 2011;127:e24–30 [DOI] [PubMed] [Google Scholar]
- 41.Owen CG, Nightingale CM, Rudnicka AR, et al. Ethnic and gender differences in physical activity levels among 9-10-year-old children of white European, South Asian and African-Caribbean origin: the Child Heart and Health Study in England (CHASE). Int J Epidemiol 2009;38:1082–93 [DOI] [PMC free article] [PubMed] [Google Scholar]
- 42.Steele RM, Van Sluijs EM, Cassidy A, et al. Targeting sedentary time or moderate- and vigorous-intensity activity: independent relations with adiposity in a population-based sample of 10-y-old British children. Am J Clin Nutr 2009;90:1185–92 [DOI] [PubMed] [Google Scholar]
- 43.Gidlow CJ, Cochrane T, Davey R, et al. In-school and out-of-school physical activity in primary and secondary school children. J Sports Sci 2008;26:1411–19 [DOI] [PubMed] [Google Scholar]
- 44.Trost SG, Pate RR, Sallis JF, et al. Age and gender differences in objectively measured physical activity in youth. Med Sci Sports Exerc 2002;34:350–5 [DOI] [PubMed] [Google Scholar]
- 45.Riddoch CJ, Mattocks C, Deere K, et al. Objective measurement of levels and patterns of physical activity. Arch Dis Child 2007;92:963–9 [DOI] [PMC free article] [PubMed] [Google Scholar]
- 46.Mattocks C, Leary S, Ness A, et al. Calibration of an accelerometer during free-living activities in children. Int J Pediatr Obes 2007;2:218–26 [DOI] [PubMed] [Google Scholar]
- 47.Crouter SE, Clowers KG, Bassett DR., Jr A novel method for using accelerometer data to predict energy expenditure. J Appl Physiol 2006;100:1324–31 [DOI] [PubMed] [Google Scholar]
- 48.Ruiz JR, Ortega FB, Martinez-Gomez D, et al. Objectively measured physical activity and sedentary time in European adolescents: the HELENA study. Am J Epidemiol 2011;174:173–84 [DOI] [PubMed] [Google Scholar]
- 49.Mitchell JA, Pate RR, Dowda M, et al. A prospective study of sedentary behavior in a large cohort of youth. Med Sci Sports Exerc 2012;44:1081–7 [DOI] [PMC free article] [PubMed] [Google Scholar]
- 50.Tudor-Locke C, Craig CL, Beets MW, et al. How many steps/day are enough for children and adolescents? Int J Behav Nutr Phys Act 2011;8:78. [DOI] [PMC free article] [PubMed] [Google Scholar]
- 51.Department of Culture MaS Beyond 2012—the London 2012 Legacy Story. London: Department of Culture, Media and Sport, 2012 [Google Scholar]
- 52.NICE Promoting physical activity, active play and sport for pre-school and school-age children and young people in family, pre-school, school and community settings. London: NICE, 2009 [Google Scholar]
- 53.Wheeler BW, Cooper AR, Page AS, et al. Greenspace and children's physical activity: a GPS/GIS analysis of the PEACH project. Prev Med 2010;51:148–52 [DOI] [PubMed] [Google Scholar]
Associated Data
This section collects any data citations, data availability statements, or supplementary materials included in this article.