

Abstract
Speaking is a sensory-motor process that involves constant self-monitoring to ensure accurate vocal production. Self-monitoring of vocal feedback allows rapid adjustment to correct perceived differences between intended and produced vocalizations. One important behavior in vocal feedback control is a compensatory increase in vocal intensity in response to noise masking during vocal production, commonly referred to as the Lombard effect. This behavior requires mechanisms for continuously monitoring auditory feedback during speaking. However, the underlying neural mechanisms are poorly understood. Here we show that when marmoset monkeys vocalize in the presence of masking noise that disrupts vocal feedback, the compensatory increase in vocal intensity is accompanied by a shift in auditory cortex activity toward neural response patterns seen during vocalizations under normal feedback condition. Furthermore, we show that neural activity in auditory cortex during a vocalization phrase predicts vocal intensity compensation in subsequent phrases. These observations demonstrate that the auditory cortex participates in self-monitoring during the Lombard effect, and may play a role in the compensation of noise masking during feedback-mediated vocal control.
Introduction
During speech production and learning, the auditory system continuously monitors our vocal output and relies on the feedback of one's own voice to make corrections or desired changes. This sensory-motor processing mechanism enables humans to accurately control a range of parameters in speech, such as amplitude, pitch, and formant frequencies (Burnett et al., 1998; Houde and Jordan, 1998; Bauer et al., 2006). The absence or impairment of vocal feedback, such as in the cases of deafness or hearing loss, leads to degeneration of speech (Lane and Webster, 1991). One of the most ubiquitous vocal feedback-dependent behaviors is an increase in vocal intensity in the presence of masking noise, commonly referred to as the Lombard effect (Lombard, 1911). This dynamic modulation of voice intensity allows an individual to communicate effectively under noisy conditions. The Lombard effect has been demonstrated not only in humans (Hanley and Harvey, 1965; Lane et al., 1970; Lane and Tranel, 1971; Egan, 1972; Siegel and Pick, 1974), but also in every animal species examined, including birds (Potash, 1972; Cynx et al., 1998; Manabe et al., 1998; Brumm and Todt, 2002), cats (Nonaka et al., 1997), and monkeys (Sinnott et al., 1975; Brumm et al., 2004; Egnor and Hauser, 2006). The neural mechanisms underlying this important vocal behavior, however, remain largely unknown. The present study is among the first attempts to directly correlate single neuron activity with vocal behaviors in nonhuman primates, an area of research that has been hampered by technical challenges.
Studies have shown reduced activity in auditory cortex during speaking or vocalizing when compared with passive listening conditions in humans (Creutzfeldt et al., 1989; Paus et al., 1996; Numminen et al., 1999; Curio et al., 2000; Crone et al., 2001; Ford et al., 2001b; Houde et al., 2002) and nonhuman primates (Müller-Preuss and Ploog, 1981; Eliades and Wang, 2003, 2005). Our previous work has identified two populations of neurons in auditory cortex of the marmoset, a highly vocal primate: one being inhibited and the other being excited by self-produced vocalizations (Eliades and Wang, 2003, 2005). We further found that the suppressed neuronal population was sensitive to feedback alterations (Eliades and Wang, 2008a), suggesting its potential role in vocal feedback monitoring. However, whether the changes in cortical neural activity in cortex during altered vocal feedback are correlated with modified vocal production has not yet been established in previous studies.
The present study investigated neural responses in auditory cortex during the Lombard effect. If the auditory cortex is involved in feedback-dependent control of vocal intensity, we predict that masking will alter neural responses, which should lead to compensatory changes in vocal production. We show that when marmosets vocalize in the presence of masking noise that disrupts vocal feedback, the compensatory increase in vocal intensity during the Lombard effect is accompanied by a shift in auditory cortex activity toward the pattern observed during vocalizing under normal feedback condition. These findings shed light on neural mechanisms involved in processing vocal feedback signals during speaking or vocalizing.
Materials and Methods
Implanted electrode arrays and neural recordings.
Two marmoset monkeys (Callithrix jacchus) of either sex were each implanted bilaterally with multi-electrode arrays. The arrays used were Warp16 (Neuralynx), each of which contained 16 individually moveable metal microelectrodes (impedances 2–4 MΩ). The auditory cortex was located with standard single electrode recording methods before array placement. Full details of the electrode array design, characteristics, and recording have been previously published (Eliades and Wang, 2008b). The left hemisphere was implanted first, followed a few weeks to months later by an implant in the right hemisphere, after which both arrays were recorded simultaneously. Postmortem histologic examination showed all four arrays to span both primary auditory cortex as well as lateral and parabelt fields (Eliades and Wang, 2008b). All cortical layers were sampled. No consistent differences in responses were observed between cortical fields or across cortical layers.
Neural signals were observed on-line to guide electrode movement and optimize signal quality. During any given experimental session, two electrode channels were monitored, including on-line spike sorting (MSD; Alpha-Omega Engineering), to guide auditory stimulus selection. Digitized neural signals were sorted off-line using custom software and a principle component (PCA)-based clustering method. Neurons were later classified as either single-unit or multi-unit based on a signal-to-noise ratio > 13 dB, cluster separation of d′ > 2, and <1% of interspike intervals less than a 1 ms refractory period (multi-units were usually secondary signals recorded along with a single-unit). A total of 212 units were recorded during these experiments, of which 107 were classified as single-units (Subject 1: 38; Subject 2: 69) using the methods established in our previous study (Eliades and Wang, 2008b). Only the single-units were included in the experimental results, but no auditory or vocal response criteria were used to determine inclusion. Sessions were generally recorded over a week apart and neurons recorded from the same electrode (at different depths) in different sessions were considered separate units.
Vocal recordings.
Vocalizations were recorded using a directional microphone (AKG C1000S) placed ∼20 cm in front of the animals, then amplified (Symetrix SX202) and lowpass filtered to prevent aliasing (24 kHz, 8-pole Butterworth; Frequency Devices). Vocal signals were digitized at a 50 kHz sampling rate (National Instruments PCI-6052E) and synchronized with neural recordings. Vocalizations were later extracted from the digitized microphone signals and manually classified into established marmoset call types (Pistorio et al., 2006) based on their spectrograms. Only four of the major vocalization types were included for analysis: phees, trilphees, trills, and twitters. Microphones were previously calibrated for loudness using tones and noise of known intensity, and vocalization amplitudes were calculated as root mean squared decibel sound-pressure level (SPL).
Experimental sessions typically began with the presentation of acoustic stimuli to characterize the auditory tuning of neurons (see below). After auditory testing, vocal experiments were performed in either of two settings. Most experiments were conducted in the marmoset colony to increase the willingness of an animal to vocalize. The subject animal was placed within a portable three-walled sound-attenuation booth (for clearer vocal recordings) allowing free visual and vocal interaction with the rest of the animals in the colony. Multiple microphones were used to monitor both vocalizations produced by the subject animal and sounds from the rest of the colony. In this setting, marmosets made a diverse repertoire of vocalizations, including both isolation (phee) and social calls. A smaller number of sessions were antiphonal calling experiments (Miller and Wang, 2006), where an animal vocalized interactively with recorded vocalizations from a conspecific animal. These experiments were conducted with the animal in the soundproof chamber used for auditory experiments, but with the door ajar. During these experiments, the animals produced almost exclusively isolation (phee) calls.
Simultaneous neural and vocal recordings were performed with the animal either seated in a primate chair or while roaming ad libitum. Chair recordings, performed during early vocal experiments, involved keeping the subject in the custom primate chair after auditory experiments, but releasing its head to reduce the amount of restraint and increase its vocalization. Free-roaming experiments involved the use of a small cage in which the animal was allowed to move ad libitum without restraint. Tether wires connected the electrode arrays to hardware located outside the cage. As one might expect, animals were more vocal during free-roaming than chair (head-free) experiments. Full details of the free-roaming method have been previously published (Eliades and Wang, 2008a). Although animals were free to move their heads in any direction in both conditions, most vocalizations were produced with the animals facing the microphone and the rest of the colony. However, some vocalizations were produced with other head orientations, resulting in slightly reduced measurements of the vocal amplitudes. This vocal amplitude variability averages out in aggregate, but such head orientation likely contributes to wider distributions of the measurements.
All experiments were conducted under guidelines and protocols approved by the Johns Hopkins University Animal Care and Use Committee.
Masking experiments.
To block feedback during vocalization, masking noise was presented to the animal while vocal recordings were performed. Masking experiments were conducted in a blocked fashion, generally with an hour of vocal recordings with normal feedback (no-masking), followed by an hour of masking and sometimes an additional half hour of normal feedback. In general during masking, multiple levels of masker were not possible because of the time limitations to obtain sufficient numbers of the different vocalization types in each condition. Because of this limitation, we cannot comment on whether our results would generalize to other masking levels as one might expect. In general, the animals' vocalizations were fewer in number and more likely to be isolation (phee) calls during masking than during normal vocal production, reflecting an inability to hear and interact with the other animals in the marmoset colony. Median counts of vocalizations per session were 93 and 70 for unmasked and masked conditions, respectively. During a subset of experiments masking noise was presented intermittently rather than continuously. For these control experiments, the masker was manually controlled to begin only after the onset of vocalization during a random sample of vocalizations.
White noise was generated continuously in hardware (TDT WG2), attenuated to a calibrated level of 70 dB SPL (TDT PA4), and presented to the animal through a pair of earbud-style headphones (Sony MDR-E828LP) modified to attach to the animal's headcap. Presenting the masker in this fashion, through headphones rather than free-field, minimized the often encountered interference with microphone recordings as well as minimizing disruption of the rest of the marmoset colony. This level of masking noise was chosen based on the maximum amplitude output of the headphones (∼85 dB SPL), the first animal's normal vocal amplitudes (M49p; see Fig. 1), and concern for hearing loss if sustained amounts of louder noise were used. The 70 dB SPL used was still relatively quiet compared with some of the vocalizations produced, and may account for some of the experimental variability observed. Additionally, the large variation in overlapping background colony sounds (average level ∼50 dB SPL) may also account for some experimental variability.
Figure 1.

Distributions of vocalization intensity and the Lombard effect in marmosets. Distributions of vocalization intensity are shown for normal or unmasked (blue) and masked (red) conditions for four major marmoset vocalization types: phee (row A), trilphee (row B), trill (row C), and twitter (row D) measured from two individual animals (left column: Subject 1, marmoset-M49p; middle column: Subject 2, marmoset-M49r). Subject 2 did not produce sufficient twitter calls. The number of calls produced during masking were 271, 198, 366, and 23 (phees, trilphees, trills, and twitters) for Subject 1. and 127, 38, and 8 for Subject 2. The relatively low number of trilphees and trills accounts for irregularity noted in the plots for Subject 2. The right column shows examples of spectrograms of four marmoset vocalization types. A plot on the right of each intensity distribution compares the mean vocal intensities between the unmasked and masked conditions. Error bar indicates SD. *p < 0.05; **p < 0.001, rank sum. The level of the continuous masking noise (70 dB) is indicated on each plot (gray dashed line).
Data analysis.
Responses to individual vocalizations were calculated by comparing the firing rate before and during self-initiated vocalizations. A window of 4000 ms preceding vocal onset was recorded, with 500 ms immediately before vocal onset excluded from this calculation because of previous work (Eliades and Wang, 2003) indicating prevocal suppression (median duration 240 ms). The response to each vocalization was quantified using a normalized rate metric, the vocal Response Modulation Index (RMI), defined as follows: RMI = (Rvocal − Rprevocal)/(Rvocal + Rprevocal), where Rvocal is the average firing rate during vocalization and Rprevocal is the average rate before vocalization (excluding the 500 ms immediately before vocal onset). An RMI of −1 indicated complete suppression of neural activity and +1 indicated strongly driven vocalization responses, a low prevocal firing rate, or both. Full details on this calculation have been previously published (Eliades and Wang, 2003, 2008a). Vocalization responses that failed to elicit at least three spikes before or during the vocal period were excluded from analysis. The overall response of a neuron to vocalizations was assessed by averaging RMIs from multiple vocalization responses, calculated individually for each vocalization type.
The effect of masking noise on neurons was determined by calculating RMIs for individual vocalizations under both unmasked (unaltered) and masked feedback conditions and comparing the average RMIs for both conditions. Because of changes in prevocal firing rates for some neurons during masking, the average RMI during masking was calculated after correcting individual prevocal firing rates by the difference between the average prevocal rates in the masked and unmasked conditions. This correction was necessary because a decrease in prevocal firing might otherwise make an unchanged vocal suppression appear less inhibited due to the normalization. The RMI difference between unmasked and masked conditions was used to quantify masking effects, with positive differences indicating increased neural activity in the presence of masking noise. The significance of individual neuron masking effects were calculated from unmasked and masked RMI distributions using Wilcoxon rank sum tests.
Additional comparisons of feedback effects on suppressed (RMI ≤ −0.2) and excited (RMI ≥ 0.2) neural populations were made by calculating peristimulus time histograms (PSTHs). PSTHs were calculated by averaging neural responses to vocal production aligned by the onset of each vocalization. The binwidths used were 25 ms. Individual PSTHs were calculated for both suppressed and excited neural populations and for both unmasked- and masked-feedback conditions in each neural population. PSTHs were similarly calculated for individual neurons, for display purposes only, using 50 ms binwidths. PSTHs are not shown for twitter vocalizations due to a small sample size and PSTH irregularity. PSTHs calculated for playback of recorded vocalizations (from the same animal) used 25 and 50 ms binwidths for suppressed and excited units, respectively. The larger binwidths for excited units were necessitated by smaller sample size.
The effects of vocal compensation and masking noise were separated in a subset of analyses by categorizing individual vocalizations into three categories: unmasked, uncompensated, and compensated. In each class of vocalization, the 75th percentile of vocal intensity was calculated for unmasked vocalizations. For this analysis, unmasked vocalizations falling beneath this threshold were selected. Masked vocalizations beneath this SPL were considered uncompensated and labeled as such. Masked vocalizations louder than this threshold were labeled as compensated. When applied to individual neurons' responses, only those neurons with at least three vocalizations in each category were included in the analysis. A control analysis used non-masked vocalizations louder than this 75th percentile boundary. Additional analysis included normalization of individual vocalizations' loudness as z-scores relative to their unmasked mean SPL (for that session), allowing full comparison of SPL trends for both masked and unmasked responses.
All statistical tests were performed using nonparametric methods, unless otherwise indicated. Wilcoxon rank sum and signrank tests were used to test significance of differences between unmatched and matched distribution medians, respectively. Kruskal–Wallis ANOVAs, with Bonferroni corrections for multiple comparisons, were used when comparing more than two sets of neurons or conditions. All correlation coefficients were Spearman rank correlations, with permutation test verification of statistical significance, and required a minimum of four samples for analysis. Slopes were calculated using simple linear regression. Confidence intervals for mean values were calculated using 200 repetition bootstrapping. Comparisons were considered statistically significant for p < 0.05.
Results
We recorded responses from 107 single-units in auditory cortex of two marmoset monkeys during voluntary self-initiated vocalizations. These neurons consisted of 84 units suppressed during vocalization, 11 excited units, and 12 units with mixed or minimal responses. To study neural mechanisms related to the Lombard effect, we presented a loud masking noise while a marmoset vocalized and examined the resulting effects on both vocalization intensity and cortical neural activities. We were particularly interested in addressing the following questions. (1) To what extent do marmosets exhibit the Lombard effect behaviorally? (2) Are neurons in auditory cortex sensitive to masking noise during vocal production, as suggested by human experiments? (3) How are neural activities in auditory cortex correlated with the increase in vocal intensity during the Lombard effect?
Marmosets exhibit the Lombard effect in their vocal production
We first examined marmosets' vocal behavior in the presence of masking noise delivered through a pair of custom headphones worn by the subject. A microphone placed in front of an animal's cage was used to record its vocalizations which were subsequently analyzed to determine their vocal intensity. Animals' vocalizations in the presence of 70 dB SPL continuous wideband noise were compared with vocalizations produced during normal ambient noise conditions. We found that marmosets exhibited the expected increase in vocal intensity when masking noise was present. Figure 1 shows distributions of vocalization intensity of different call types measured in two marmosets, in the absence or presence of masking noise. Compensatory vocal intensity changes were examined by comparing vocal intensity distributions between normal or unmasked and masked conditions (Fig. 1). Considerable variability in vocal intensity was present due to the voluntary and dynamic nature of vocal production in freely behaving marmosets. One animal (Fig. 1, left column) exhibited significant increases in vocal intensity in the presence of the 70 dB SP masking noise for all four call types (p < 0.001, rank sum). The increase in vocal intensity was greater in phee and trilphee calls (Fig. 1A,B, middle column) where the level of the masking noise was substantially higher than the peak of the intensity distribution in the unmasked condition for each call type. A smaller, but significant, increase in vocal intensity was observed in trill and twitter calls (Fig. 1C,D, left column). Note that the level of the masking noise (70 dB SPL) was near the peak of trill call intensity distribution and below the peak of twitter call intensity distribution. The second animal (Fig. 1, middle column) exhibited vocal intensity increases for trilphee and trill calls (Fig. 1B,C, middle column). Interestingly, this animal did not exhibit vocal intensity increase for phees (Fig. 1A, middle column), which was likely due to the fact that the intensity of phees vocalized by this animal in the unmasked condition was quite loud (∼95 dB SPL, possibly reaching the upper limit on the phee's intensity) and much louder than the 70 dB noise masker. Unlike the first animal, whose phee calls were mostly softer than the masking noise, the second animal made all of its phee calls at intensities much louder than the masking noise. Other types of vocalizations (trilphee, trill) made by the second animal were much softer and their intensities increased in the presence of masking noise (Fig. 1B,C, middle column). While some vocalizations also changed in mean frequency during masking, this did not occur in a systematic pattern. Overall, the increase in vocal intensity during noise masking observed in our study parallels the Lombard effect as seen by others, as well as in other monkey species and humans during vocalizing or speaking.
Effects of noise masking on auditory cortex responses during vocalization
We next examined the neural responses in auditory cortex during vocalization on a neuron-by-neuron basis and compared between unmasked and masked conditions. Our previous work has shown that the majority of auditory cortex neurons in marmosets exhibited suppression of neural firing during self-produced vocalizations (Eliades and Wang, 2003). Figure 2A shows an example neuron that was nearly completely suppressed by the marmoset's own phee calls during the unmasked condition (Fig. 2A, middle and bottom plots, blue), as reflected by a mean RMI of −0.84. RMI is a quantitative measure of the relative change in firing rate during vocalization compared with firing rate before vocalization, with positive values indicating increased responses and negative values indicating reduced responses (see Materials and Methods). During the noise-masking condition (Fig. 2A, middle and bottom plots, red), the masking noise resulted in a small decrease in background (spontaneous) activity of this neuron, but did not change the firing rate during phee vocalizations when compared with the unmasked condition (RMI = −0.82; unmasked vs masked conditions: p > 0.05, rank sum), though this was saturated at zero firing rate. A second example neuron (Fig. 2B) represents another class of auditory cortex neurons that exhibit excitatory responses driven by self-produced vocalizations (Eliades and Wang, 2003). This neuron was strongly driven by the marmoset's own phee calls (RMI = 0.62) under the unmasked condition (Fig. 2B, middle and bottom plots, blue). However, the driven response disappeared when the marmoset vocalized under the noise-masking condition (RMI = −0.14). The strong response by this neuron under the unmasked condition resulted from auditory feedback of the self-produced vocalization. As a result, when masking noise blocked this feedback, the neural response was eliminated.
Figure 2.
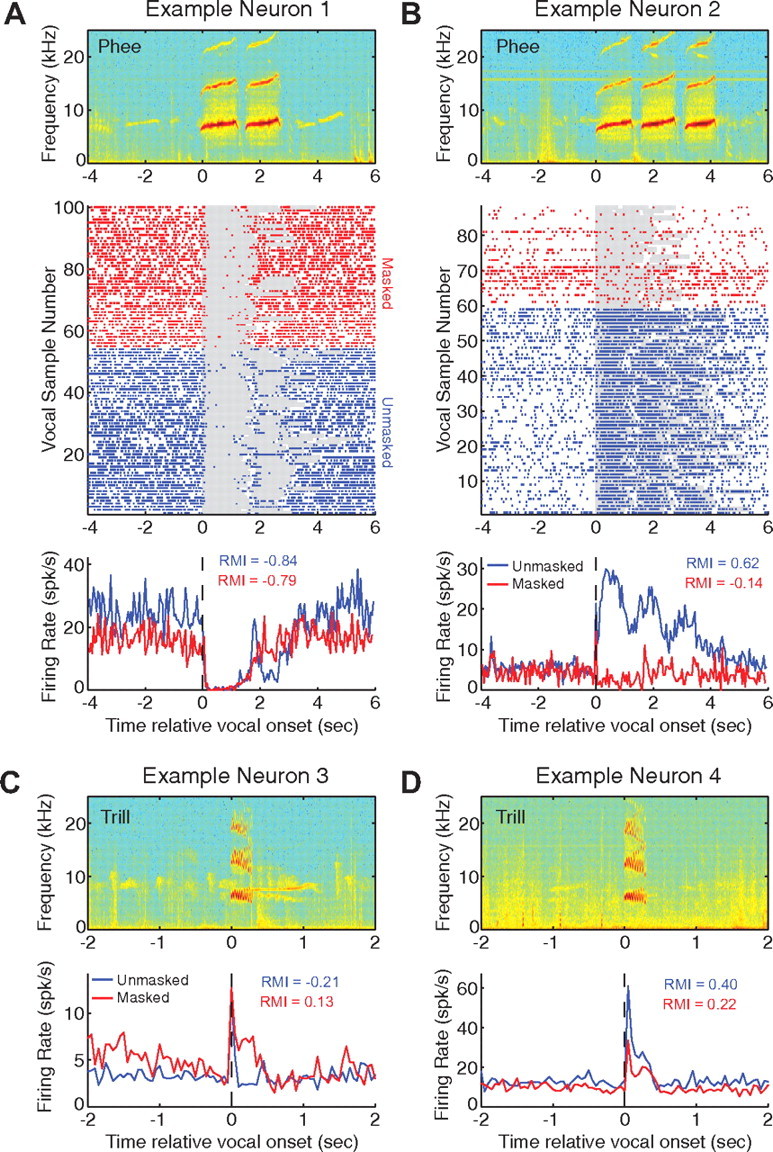
Representative examples of single neuron responses during vocalizations under normal and noise-masking conditions. Four representative neurons are illustrated, one suppressed (A) and one excited (B) during phee vocalizations and others suppressed (C) or excited (D) during trill vocalizations. A, Top, Spectrogram of a sample multiphrase phee call recorded during unmasked conditions. Middle, Raster plot of action potentials (spikes) before, during (shaded area), and after vocalizations recorded from a neuron that was suppressed during normal (unmasked) vocal production. Neural responses are shown for unmasked (blue) and masked (red) conditions. Bottom, PSTHs (50 ms binwidth) of the data shown in the middle panel. No significant change in firing rate during vocalization between unmasked (blue) and masked (red) conditions (p > 0.05, rank sum), based on firing rate over the entire call duration. All vocalizations were included regardless of vocal intensity changes. Mean RMIs are shown for unmasked and masked conditions. B, Raster plot and PSTH of the responses for a neuron strongly excited by phee vocalizations during the unmasked condition but not in the presence of masking noise (p < 0.001, rank sum). C, Top, Spectrogram of a sample trill vocalization. Trill vocalizations are much shorter than phee vocalizations. Bottom, PSTH of a neuron showing onset responses followed by weak suppression during trill vocalizations in the unmasked condition. This neuron exhibited a large increase in firing rate during vocalization in the presence of masking noise (p < 0.05, rank sum). D, Same format as in C. Top, Spectrogram of a sample trill vocalization. Bottom, PSTH of a neuron excited by trill vocalizations during the unmasked condition, but with reduced responses during the noise-masking condition (p < 0.001). The tone-based best frequency tunings for these four neurons were 9.8, 4.9, 5.5, and 10 kHz, respectively.
We also examined the effects of noise masking during other types of marmoset calls that were less frequently observed than phee calls. Two additional examples illustrate the responses of auditory cortex neurons during trill vocalizations (Fig. 2C,D). One of these neurons (Fig. 2C) exhibited an onset response followed by weak suppression during the unmasked condition (RMI = −0.21). During the masking condition, this neuron significantly increased its firing rate (RMI = 0.38, unmasked vs masked conditions: p < 0.05, rank sum). In contrast, a neuron that was excited by trills during the unmasked condition (Fig. 2D; RMI = 0.40) reduced its firing rate when the marmoset vocalized in the presence of masking noise (RMI = 0.23; unmasked vs masked conditions: p < 0.001, rank sum). These examples clearly demonstrate that neurons in auditory cortex are sensitive to alteration of auditory feedback caused by masking noise during vocal production.
Relationship between noise-masking effects and vocal modulation of auditory cortex
The two populations of neurons in marmoset auditory cortex with contrasting response properties during self-produced vocalizations that were identified in our previous work (Eliades and Wang, 2003) were also observed in the present study. The population-averaged PSTHs of these two populations of neurons during phee, trilphee, and trill calls are separately analyzed and shown in Figure 3. There were insufficient samples from twitter calls. The suppressed neurons, those with a mean RMI < −0.2, were inhibited during the unmasked condition (Fig. 3A–C, blue curves). However, masking noise lessened the vocalization-induced suppression of these neurons (Fig. 3A–C, red curves). These results show that, on average, masking noise increases the activity (or decreases the suppression) of the suppressed population of auditory cortex neurons during self-produced vocalizations. This is opposite to what would be expected if the responses of these neurons are purely auditory in nature. In auditory cortex of awake marmosets, unmodulated broadband noise stimuli generally suppress neural responses (Barbour and Wang, 2003a,b; Wang et al., 2005). The population of excited neurons (RMI > 0.2), on the other hand, exhibited increased firing rate in response to self-produced vocalizations during the unmasked condition, observed for all three types of calls (Fig. 3D–F, blue curves). Masking noise strongly attenuated firing rate of these neurons for phee and trilphee calls (Fig. 3D,E, red curves), but had little effect on responses to trills (Fig. 3F). Given the relative small number of excited neurons (N = 11) in our samples, we refrain ourselves from further interpreting these data.
Figure 3.
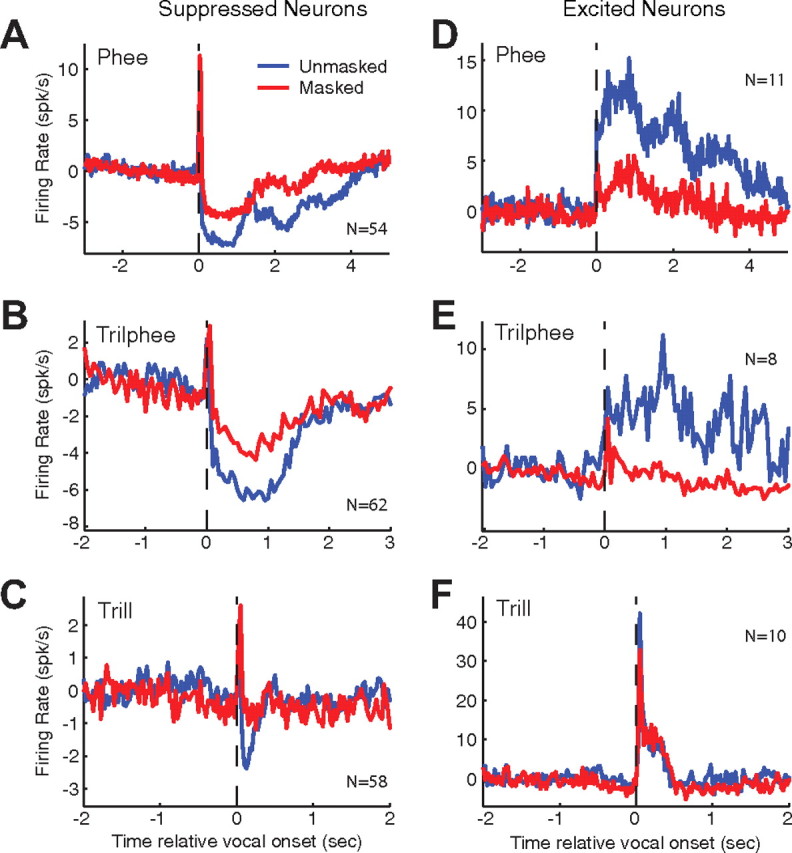
Average effects of masking on suppressed and excited neural populations. Average PSTHs were calculated from responses of multiple individual neurons to compare vocal responses during unmasked (blue) and masked (red) feedback conditions. Neural responses were aligned by their vocal onsets (dashed line) and averaged using 25 ms binwidths after subtraction of the prevocal firing rate. Responses to different classes of vocalizations are plotted separately: phee, trilphee, and trill. Suppressed (RMI ≤ −0.2, A–C) and excited (RMI ≥ 0.2, D–F) neural populations are shown individually. Vocalization-induced suppression was reduced for all classes of vocalization in masked conditions (A–C). Vocalization-related excitation was attenuated in masked conditions for both phees (D) and trilphees (E), but less so for trills (F).
Another interesting observation from these results is that the effects of masking noise on neural responses are present immediately at vocal onset. If the onset (first 100 ms) and sustained vocal responses are compared between conditions for suppressed neurons, phee responses show immediate increases at vocal onset (RMI difference: +0.26 onset, +0.14 sustained). A similar pattern was noted for both trilphee (+0.17 onset, +0.16 sustained) and trill responses (+0.15 onset, +0.10 sustained), with slightly decreased masking effects in the sustained response. In contrast, excited neurons showed the masking effect at onset that increased in the sustained period (phee: −0.21 onset, −0.31 sustained; trilphee: −0.26 vs −0.39; trill: −0.02 vs 0.01).
In a subset of experiments, masking was delivered in a random rather than a continuous fashion. This was performed both to better examine the timing of feedback monitoring as well as a control for possible behavioral-state changes resulting from continuous masking noise. Masking in these experiments was manually controlled and presented randomly during a subset of phee vocalizations. When masking began after the onset of vocalization, suppressed neural responses did not change until after the noise begins and then quickly rose to a peak (Fig. 4A). When both continuous and random masking were performed for the same neuron, there was a peak in neural firing after the onset of masking that quickly converged back to the level of the continuous masking response, both still elevated compared with unmasked suppression (Fig. 4B). These results suggest a transient onset response associated with the beginning of masking noise (or corresponding to a period of maximal disruption of vocal feedback). The similarity between random and continuous masking also suggests that masking effects on vocalization-induced modulation are not a result of behavioral state changes induced by continuous masking noise.
Figure 4.
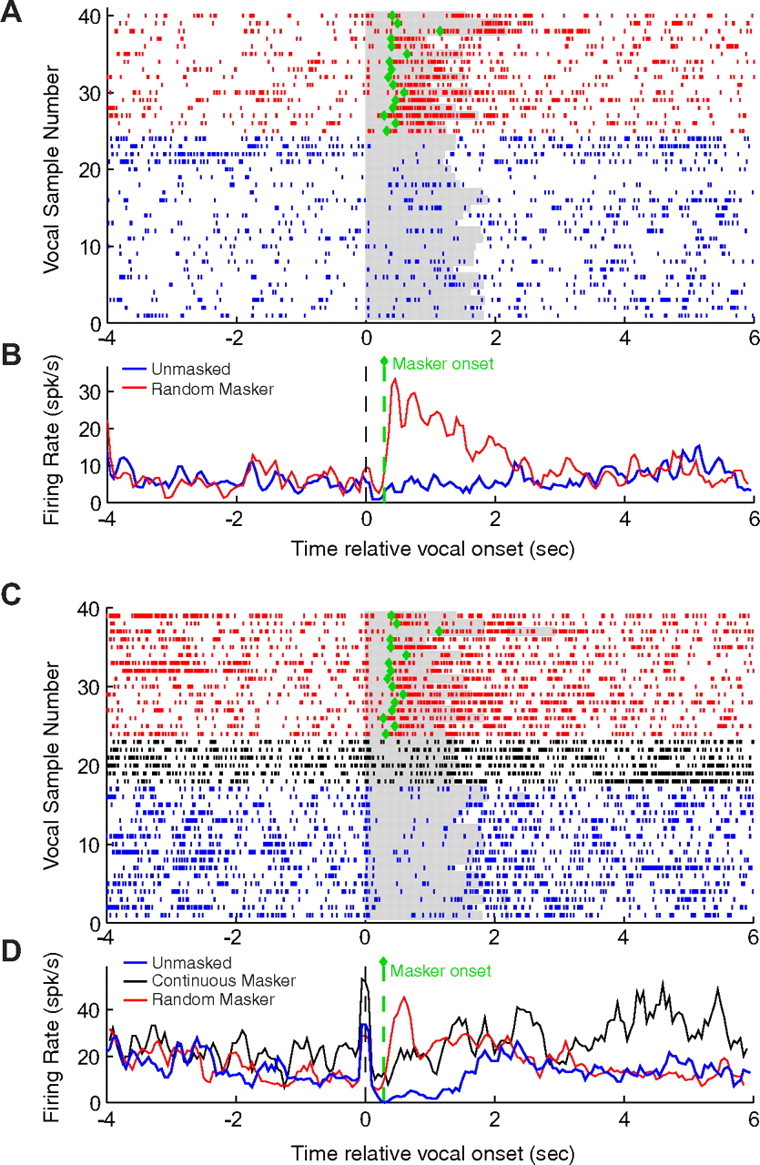
Altered feedback effects during noncontinuous masker presentation. Two example neurons are shown for which masking noise was randomly presented only during vocalization in a subset of recordings instead of being presented continuously. A raster plot (A) and PSTH (B) show the response of a neuron weakly suppressed during unmasked phees (blue), but strongly excited during random masking (red). Masking-related responses began shortly after the onset of masker, indicated by green diamonds on raster plot in A (for individual vocalizations) and green dashed line on PSTH in B (for averaged response aligned by vocal onset). A second example neuron is shown in C and D, comparing vocal responses during unmasked (blue), continuous masking (black), and random masking conditions (red). Continuous masking response diverged from unmasked immediately at vocal onset, whereas random masking response increased shortly after masker onset before converging with the continuous masking response.
We further analyzed the effect of masking noise on individual neurons' responses to vocalization within suppressed and excited populations (Fig. 5). Relative to the unmasked condition, we observed both increases and decreases in neural firing during masking within each population. We calculated RMI for both masked and unmasked conditions and plotted their difference (Fig. 5A). There was a bias toward increased RMI during masking (mean ± STD: 0.12 ± 0.26), and overall 44% of neurons showed significant changes in their vocalization-related activity resulting from masking (shaded). We further plotted RMI differences as a function of the unmasked RMI in Figure 5B. For suppressed neurons (unmasked RMI < −0.2), the effect of noise masking was strongly biased toward increased activity (or decreased suppression). Neurons with weaker suppression or no vocalization-induced modulation (unmasked −0.2 ≤ RMI ≤ 0.2) showed a mix of small increases or decreases in activity during noise masking. In contrast, excited neurons (unmasked RMIs > 0.2) showed a bias toward decreased activity during noise masking. There were no differences in spontaneous firing rates between suppressed and excited neurons (10.16 spk/s vs 10.12 spk/s; p = 0.78, rank sum), and no correlation between spontaneous rate and masking effects (r = −0.02, p = 0.7). The relationship between the masking effects and unmasked modulation shown in Fig. 5B was statistically significant (p < 0.001, Kruskal–Wallis) and is similar to the trend observed in an earlier study when the vocal feedback was altered by frequency shift (Eliades and Wang, 2008a). Our earlier study, however, did not investigate the relationship between the changes in auditory cortex responses due to feedback alteration and corresponding changes in the marmoset's vocal production. The present study investigated such a relationship in the context of the Lombard effect as explained in the following sections.
Figure 5.
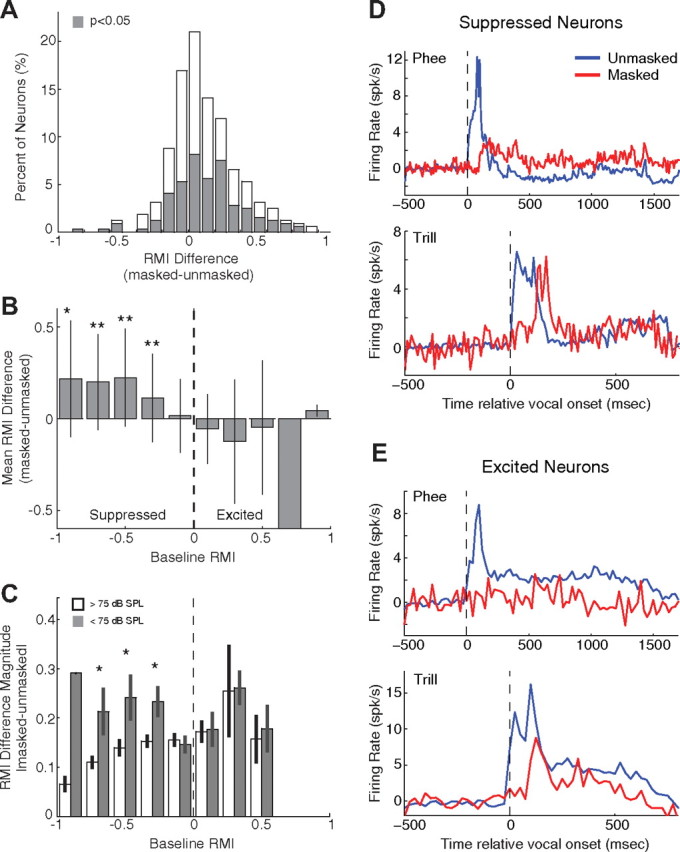
Relationship between masking effects and unmasked vocalization-induced modulation. The effects of masking on vocal responses are summarized (A) and plotted against non-masked vocal modulation (B). Vocal RMI differences between masking and unmasked conditions were calculated for individual neurons. A, A population histogram shows the distribution of RMI differences, including a prominent shift toward increased RMIs. Shaded: Neurons with statistically significant (p < 0.05) changes in RMI. B, RMI differences were averaged and then compared for different ranges of unmasked RMI, including all types of vocalizations. Shown are the mean difference and variability (error bars indicate SDs) for each RMI bin. Suppressed neurons showed increased activity during masking, while excited neurons showed decreased activity. Neurons with weak suppression or excitation exhibited more variable masking effects, including both increases and decreases in firing. Significant masking effects are indicated (*p < 0.05, **p < 0.001, sign rank). C, The magnitude of masked RMI differences is compared between louder (>75 dB SPL, open bars) and softer (<75 dB, filled bars) unmasked vocalizations. Significant differences were noted for suppressed but not excited neurons (*p < 0.05, rank sum). D, Average PSTHs are shown for playback of recorded phee (top) and trill (bottom) vocalizations for suppressed neurons. Responses to playback during masking (red) were generally reduced compared with unmasked condition (blue). PSTH binwidths were 25 ms. E, Same format as D for excited neurons. PSTH binwidths were 50 ms.
One observation from our behavioral data is that the degree of vocal compensation exhibited by Subject 2 was significantly less than for Subject 1, particularly for the phee vocalizations (Fig. 1). While this does limit our interpretation of the behavioral data, we suggest that this was likely a result of the louder unmasked phees in this animal, as it did show compensation for softer vocalization types. When we examine neural responses segregated by subject, there is a corresponding small decrease in the masking effects on neural responses. The magnitude of masking effects and correlation with unmasked RMI was stronger for Subject 1 (mean ± STD: 0.18 ± 0.31; r = −0.56; p < 0.001) than for Subject 2 (0.09 ± 0.24; r = −0.36; p < 0.001). To better determine the role unmasked vocal loudness plays in masking responses, we separately analyzed masking effects for louder and softer unmasked vocalizations (Fig. 5C). Suppressed neurons exhibited greater masking effects when unmasked vocalizations were softer than 75 dB SPL than for louder unmasked vocalizations. This difference may explain why phee vocalizations, which are generally the loudest among all vocalizations, had weaker masking effects than the other two types of vocalizations (see Fig. 1). Interestingly, this loudness dependence did not hold for excited neurons, where responses were identical between loud and soft unmasked vocalizations. This is consistent, however, with the strong attenuation of excited neural responses seen for the louder phee vocalizations (Fig. 3D).
As a control we examined the relationship between masking effects on neural activities during vocalization and the effects of similar masking upon auditory responses during passive presentation of sound. We presented animals with previously recorded tokens of their own vocalizations at multiple sound levels with and without masking noise. Suppressed neurons exhibited an equal mix of monotonic (51%) and non-monotonic (49%) rate-level functions, while excited neurons had predominantly monotonic (79%) rate-level functions. Responses for both suppressed and excited neurons were predominately excitatory during unmasked playback and were generally reduced during masking (Fig. 5D,E). A delay in masked playback responses was observed and likely corresponded to the middle portion of vocalization where the SPL first exceeded the masking level. The effects of masking noise on these playback neural responses did not correlate with masking effects during vocal production for either suppressed (r = 0.14, p > 0.05) or excited (r = 0.27, p > 0.05) neurons. A comparison of the magnitude of masking effects between vocal production and playback showed an increase in the sensitivity to altered feedback (median sensitivity index = +0.46) similar to that previously seen for frequency-shifted feedback (Eliades and Wang, 2008a; +0.59). As reported in our previous studies (Eliades and Wang, 2003, 2005, 2008a), there was no consistent relationship between vocal modulation and masking effects, with the frequency tuning of these neurons. For example, the frequency tuning of the neurons in Figure 2 were similar between the suppressed and excited neurons.
Relationship between auditory cortex activity and vocal compensation during the Lombard effect
We further examined the effects of noise masking on auditory cortex neurons to correlate neural activities to the vocal compensation observed during the Lombard effect. Vocalization intensity distributions in Figure 1 show that marmosets produce vocalizations with a range of intensity, both in unmasked and noise-masking conditions. The intensity distributions of the two conditions (unmasked and masked) partially overlap. This is not surprising because of the natural variability in vocal production (Peterson and Barney, 1952; Wang, 2000), but poses difficulties in analyzing neural responses to vocalizations of similar intensities produced in two different conditions (unmasked and masked). Because of this variability, it is not possible to demonstrate the magnitude of the Lombard effect for each individual vocalization. To resolve this problem, we calculated the 75th percentile of vocal intensity of unmasked vocalizations for each individual call type and each animal, respectively. The 75th percentile was chosen to separate louder and softer vocalizations while leaving sufficient sample numbers for comparison. Unmasked vocalizations of a particular call type and animal whose intensity falls below this 75th percentile threshold are referred to as the “unmasked” category. Vocalizations produced in the noise-masking condition were divided into two categories according to the same 75th percentile threshold defined for each individual call type and each animal. Those with intensity falling above the 75th percentile threshold were referred to as the “compensated” category and others with intensity falling below the 75th percentile threshold were referred to as the “uncompensated” category (see Materials and Methods). Vocalizations in the latter category have their intensities overlapping (mean SPL difference <2.6 dB) the intensities of the unmasked category (vocalized in unmasked condition), and any neural activity differences are presumed to result from masking alone, independent of any vocal compensation.
We examined neural responses corresponding to each of these vocalization categories (Fig. 6). For suppressed neurons, mean RMI of the uncompensated vocalizations (−0.16 ± 0.21) was significantly higher than mean RMI of unmasked vocalizations (−0.34 ± 0.17) (p < 0.001, Kruskal-Wallis; Fig. 6A), indicating lessened suppression or increased neural activity during noise masking even in the absence of vocal intensity increase. This observation suggests that the effect of noise masking on auditory cortex neurons was due to changes in vocal feedback rather than a result of changes in vocal intensity. When marmosets compensated their vocalizations under the masking condition by increasing vocal intensity, the neural responses shifted back toward the unmasked condition (RMI = −0.25 ± 0.25; Fig. 6A, green). In excited neurons (Fig. 6B), uncompensated masking entirely eliminated the vocalization-related excitation, with RMI decreases from 0.25 ± 0.14 in unmasked condition (Fig. 6B, blue) to −0.03 ± 0.15 in uncompensated condition (Fig. 6B, red). Similar to the suppressed neurons, when marmosets compensated their vocalizations under the masking condition by increasing vocal intensity, the neural responses increased toward the unmasked condition (RMI = 0.16 ± 0.09; Fig. 6B, green). These results suggest that the masking effects shown in Figures 2 and 3 may underestimate the effect of uncompensated masking, as those analyses included both compensated and uncompensated vocalizations. In contrast, the neural responses to unmasked vocalizations louder than the 75th percentile threshold, serving as controls, were not significantly different from responses in the Unmask condition (suppressed: RMI = −0.31 ± 0.21, p > 0.05; excited: RMI = 0.21 ± 0.20, p > 0.05). Thus for both suppressed and excited neurons, the effect of vocal compensation associated with the Lombard effect was to reduce the masking-induced change in auditory cortex neural responses. Such an observation has not been previously reported, either at the single neuron level or in human studies. The population trends discussed above are further examined on a neuron-by-neuron basis by comparing compensation effect (compensated vs uncompensated) and masking effect (uncompensated vs unmasked) in auditory cortex responses. In Fig. 6C, we plot RMI difference between compensated and uncompensated responses (Compensation Effect) as a function of RMI difference between uncompensated and unmasked responses (Masking Effect). Although a degree of variability is present, there is a significant negative correlation between compensation and masking effects (r = −0.41, p < 0.001; Fig. 6C). The slope of this relationship between compensation and masking effects was −0.40 (95% confidence interval: [−0.59, –0.20]). A flat slope would indicate no effect of vocal compensation on auditory cortex responses, whereas a slope of −1 would indicate a complete compensation. The observed intermediate slope shows that vocal compensation partially corrected the effects of noise masking on auditory cortex responses during self-produced vocalizations. The absence of a clear Lombard effect for phee vocalizations from the second animal may limit the interpretation of these results, although the correlation of neural responses and increases in vocal intensity were observed for both animals.
Figure 6.
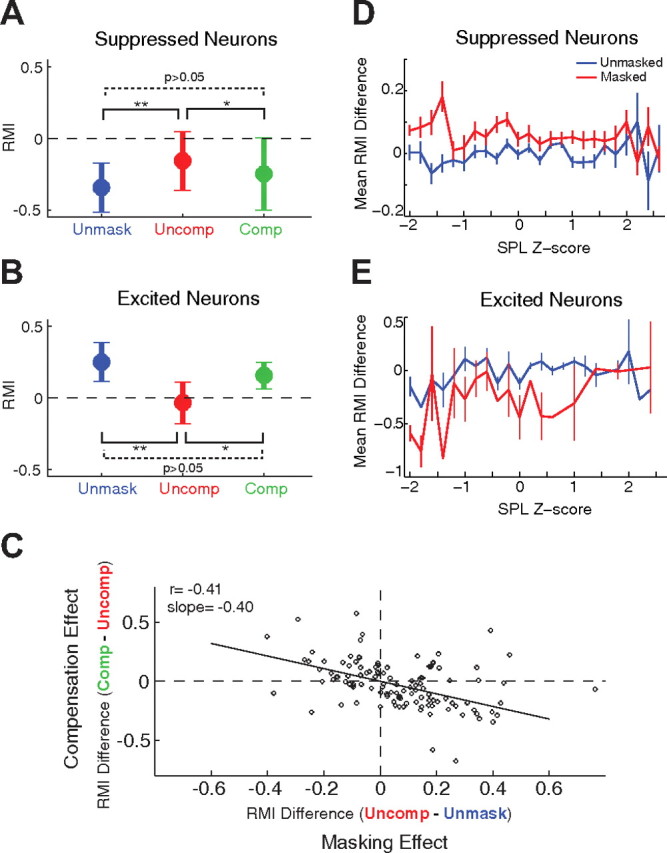
Correlation between neural responses and vocal compensation behavior. The effects of vocal compensation on neural responses were examined. Vocalizations produced during the masking noise condition were classified as uncompensated (“Uncomp”, red), or compensated (“Comp”, green) based upon whether the intensity of vocalization fell below or above the 75th percentile of unmasked vocal intensity distribution for a particular animal. Unmasked vocalizations below the 75th intensity percentile are labeled as unmasked (“Unmask”, blue). Neural responses were analyzed by grouping vocalizations into these categories. A, Population mean RMIs for suppressed neurons showed a significant reduction in magnitude during masking noise for uncompensated but not compensated masked vocalizations as compared with unmasked vocalizations (*p < 0.05, **p < 0.001, Kruskal–Wallis). B, Population mean RMIs for excited neurons also showed a significant reduction in magnitude during masking for uncompensated but not compensated vocalizations. C, The neural effects of vocal compensation (measured by the RMI difference between Comp and Uncomp groups) were compared with the effects of masking (RMI difference between Uncomp and Unmask groups) on a neuron-by-neuron basis. Compensation and masking effects were significantly correlated (r = −0.41, p < 0.001). Most compensation responses were in the opposite direction of masking responses, reflected in the negative slope (−0.40), indicating partial correction of the effects of masking. D, The neural effects of masking and vocal intensity changes are further examined for suppressed neurons. Mean RMIs for masked (red) and unmasked (blue) conditions are compared, as functions of vocalization SPL, expressed as z-scores relative to the unmasked mean SPL (for that session). During masking, suppressed neurons increased responses for unchanged or decreased SPLs, but less so for larger intensity increases. Error bars indicate SEM. E, Same format as in D. Mean RMI for excited neurons shows a decrease during masking for softer vocalizations, but with little effect for louder vocalizations.
We further examined the effects of masking and vocal intensity using a continuous rather than a categorical analysis. Individual vocalization intensities, including both masked and unmasked, were normalized as z-scores relative to the unmasked vocal SPLs during a given session. Suppressed neurons (Fig. 6D) showed the expected increase in masked RMI, particularly for vocalizations that were equal to or softer than unmasked levels. Louder vocalizations (presumably exhibiting the Lombard effect) showed smaller increases in responses that were similar to unmasked louder vocalizations. In contrast, excited neurons (Fig. 6E) showed decreased vocal responses during masking that normalized with increasing vocal intensity. These results are consistent with the categorical analyses of compensated and masked vocalizations (Fig. 6A,B).
Predicting vocal compensation from auditory cortex activity
The results described above show that masking noise changed auditory cortex responses to self-produced vocalizations by disrupting vocal feedback, and that vocal compensation shifts the neural activity back toward its default unmasked vocalization-related activity, presumably through vocal feedback monitoring mechanisms. Based on these observations, one could speculate a model in which the vocal production system in marmosets engages the auditory cortex in vocal feedback monitoring, and the auditory cortex neural activity during self-produced vocalization contributes to the computation of vocal error (i.e., a neural signal indicating the difference between intended and actually produced vocalization) that is, in turn, used to drive vocal compensation. One prediction of such a model is that the presence of masking-induced changes in auditory cortex neural activity should predict subsequent vocal compensation. This hypothesis was tested using multiphrase phee vocalizations (Fig. 7A) where it was possible to predict the intensity of subsequent phrases from the first phrase. Under the unmasked condition, the intensities of the first (P1) and second (P2) phee phrases are highly correlated (Fig. 7B, blue circles; r = 0.91, p < 0.001), with a small decrease in intensity from the first to second phrase (ΔSPLP2–P1) of −1.5 ± 3.3 dB (p < 0.001, signrank). We also plot the relationship between P2 and P1 intensity for multiphrase phee calls vocalized in the noise-masking condition (Fig. 7B, red circles; r = 0.87, p < 0.001). Although masking noise occasionally caused large compensatory increases in the P2 intensity, its primary vocal effect was to blunt the small decrease in intensity between the two phrases (−0.4 ± 3.6 dB, p > 0.05, signrank). As a population this was not a large change (p = 0.07), although individual neurons often showed more pronounced changes. This decrease in the interphrase SPL change may be indicative of a form of the Lombard effect, one that acts on a shorter time scale to compensate a second phrase based upon the feedback of the first phrase.
Figure 7.

Prediction of vocal compensation by neural responses. Responses of multiphrase phee vocalizations (A) were examined to see if neural activity during the first phrase (P1) predicted changes in vocal intensity between the first and second phrases (P2–P1). B, Scatter plot comparing P1 and P2 vocal amplitudes and showing a high degree of correlation for normal vocalizations (r = 0.91, p < 0.001; blue). Vocal amplitudes for masked vocalizations are also shown (red). The average unmasked change in SPL between phrases was small (−1.5 ± 3.3 dB SPL). C, The change in vocal amplitude form P1 to P2 is plotted against the firing rate during P1 for a number of vocalizations recorded from a sample neuron. Solid lines are linear regression estimates. There was a significant correlation during masking (red; r = 0.66, p < 0.001), but not during unmasked conditions (blue; r = −0.13, p > 0.05). D, Distribution of correlation coefficients between the vocal amplitude change (P2–P1) and P1 firing rate calculated for a population of auditory cortex neurons. The correlation coefficients were significantly higher during masking conditions (p < 0.001, rank sum).
Using the neural responses recorded during these multiphrase phees, the activities of individual neurons were correlated with changes in vocal intensity between the first and second phee phrases. Figure 7C illustrates this analysis with an example suppressed neuron. In the unmasked condition, there was little correlation between the interphrase vocal intensity difference and firing rate during the first phee phrase (Fig. 7C, blue circles; r = −0.13, p > 0.05). However, when the marmoset vocalized in the noise-masking condition, the interphrase vocal intensity difference was strongly correlated with the neuron's firing rate during the first phee phrase (Fig. 7C, red squares; r = 0.66, p < 0.01). In other words, when neurons exhibited less suppression (increased firing rate) during the first phee phrase, there was a larger increase in vocal intensity in the second phee phrase, indicating that the vocal compensation in P2 was related to the change in neural response in auditory cortex during P1. Figure 7D shows the distributions of correlation coefficient between ΔSPL(P2–P1) and P1 firing rate for the population of auditory cortex neurons we studied. On average, there was little correlation for the unmasked condition (mean ± STD: 0.01 ± 0.20, p > 0.05; Fig. 7D, blue). This correlation was not different between suppressed and excited neurons (p > 0.05 rank sum). When the marmosets vocalized during noise masking, however, there was a population shift in this correlation distribution to higher values, indicating that masking-induced changes in P1 neural firing were more strongly correlated with the subsequent change in the intensity in P2 (0.21 ± 0.29; Fig. 7D, red). This significant positive shift in correlation (p < 0.001, rank sum) indicates that the reduction in neural suppression typically seen during masking noise predicted subsequent changes in vocal amplitude. There was no significant correlation between the responses and SPL in P1 (unmasked: 0 ± 0.24; masked: −0.06 ± 0.31). Although these results are purely correlational, and cannot demonstrate causation, they are consistent with a model in which the masking noise-induced changes in auditory cortex responses are a possible input to a system for vocal compensation, as the presence or absence thereof predicts the degree of subsequent feedback-related vocal compensation during the Lombard effect.
Discussion
The present study has resulted in several interesting findings. First, our vocal behavior data confirm findings from previous studies (Brumm et al., 2004; Egnor and Hauser, 2006; Egnor et al., 2006) that New World monkeys exhibit the compensatory increase in vocal intensity during masking noise as expected from the Lombard effect (Fig. 1). Second, auditory cortex neurons are found to be sensitive to masking noise during vocal production, with neurons suppressed by self-produced vocalization increasing their firing (i.e., with reduced vocal suppression) and neurons excited by self-produced vocalization decreasing their firing (Figs. 2–5). The behavior of the suppressed neuron population indicates vocal feedback-monitoring mechanisms at work. Third, the increased vocal intensity in masking noise due to the Lombard effect is found to be correlated with neural responses during self-produced vocalization (Figs. 6, 7).
Comparison with previous studies
The effects of vocal feedback masking have been well studied behaviorally (Lane and Tranel, 1971). Only a handful of studies, however, have attempted to study brain activities during self-produced vocalization under noise-masking conditions. Human magnetoencephalographic recordings have shown that vocalization responses are dampened compared with playback of recorded speech and that masking noise eliminates this difference (Houde et al., 2002; Christoffels et al., 2007). This observation was interpreted as a result of a mismatch of expected sensory inputs and auditory feedback masked by the noise stimulus. These results closely parallel the effects of masking noise on the suppressed neurons shown in the present study. A difference between some human studies and the current study is that the noise in the present study may not have completely masked vocal feedback in marmosets due to extremely loud vocalizations produced by these animals, the result of which was altered but not completely blocked vocal feedback.
Another series of previous studies involved the use of masking noise and other interfering stimuli to alter feedback during song production in songbirds. Several studies have failed to find any change in neural activity during masked song (Leonardo, 2004; Kozhevnikov and Fee, 2007). On the other hand, Sakata and Brainard (2008) showed that some neurons in HVC, a premotor song structure, in adult Bengalese finches responded to feedback manipulations. Another recent study, using altered feedback, demonstrated feedback sensitivity in the auditory nuclei of juvenile zebra finches including field-L, the analog of the mammalian auditory cortex (Keller and Hahnloser, 2009). Interestingly, although these auditory nuclei are feedback sensitive like the mammalian auditory cortex, their neural activity during normal song production closely parallels that during song playback and does not exhibit the same degree of prominent vocalization-induced suppression common to both humans (Crone et al., 2001; Houde et al., 2002; Flinker et al., 2010; Greenlee et al., 2011) and nonhuman primates (Eliades and Wang, 2003).
Masking and the origins of vocalization-induced suppression
Beyond the direct implications for feedback-mediated vocal behaviors, the results of the present study also begin to address some of the mechanistic questions pertaining to the origin of suppressed and excited neural responses in auditory cortex during vocal production. We previously suggested that, while vocalization-induced suppression results from internal modulatory signals termed corollary discharges (Sperry, 1950), vocalization-related excitation likely results from sensory responses to the auditory feedback of the produced vocalization (Eliades and Wang, 2003, 2008a). The masking noise data presented in this report support such an assertion. By partially or entirely blocking feedback, masking noise severely attenuated the evoked activity of most auditory cortex neurons excited by vocalization.
In contrast, the suppressed neurons in auditory cortex during self-produced vocalizations showed increases in activity (or decreased suppression) during masking noise. This suggests that auditory cortex neurons presumably suppressed by corollary discharge inputs are sensitive to feedback alteration during self-produced vocalization. We previously predicted such a role of vocalization-induced suppression based upon neural activities during frequency-shifted changes in vocal feedback (Eliades and Wang, 2008a). Recent evidence from human studies confirms this increase in auditory cortex sensitivity during speech (Behroozmand et al., 2009; Greenlee et al., 2011). It has also been suggested that suppression occurs when there is a match between expected and perceived feedback, and that the increased activity during masking reflects a mismatch due to absence or reduced feedback (Houde et al., 2002). Although the present data may be consistent with such a model, the variability of masking responses in the suppressed neurons, including both increases and decreases in activity, suggests that the neuronal computation may be more complicated. The possible small contributions of behavioral state fluctuations, such as attention, may also complicate interpretation of these results. We also cannot fully account for the effects of small variations in vocal frequency spectra during masking, as masking effects do not appear correlated with cortical frequency tuning. One possibility might be a natural variation in neural activities with vocal acoustics (Eliades and Wang, 2005) that is largely subthreshold, with the presence of feedback error resulting in these variations becoming suprathreshold.
Auditory–vocal interaction and the Lombard effect
One of the most interesting results observed in the reported experiments was the correlation between the compensatory vocal amplitude increase and auditory cortex neural responses in the presence of masking noise (Fig. 6). When a marmoset vocalized in the presence of masking noise, there was an overall change in auditory cortex activity from its normal representation to an altered representation reflecting the change in feedback. The subsequent vocal compensation for the change in vocal feedback resulted in a correction of the auditory cortex neural responses back toward the normal vocalization-related neural activity. This suggests that auditory cortex may play a role in vocal feedback monitoring as suggested by earlier studies (Houde et al., 2002; Eliades and Wang, 2008a; Tourville et al., 2008; Behroozmand et al., 2009). This observation is empirically important and conceptually interesting because it reflects the expected events underlying feedback-dependent vocal control. Although the explicit goal of vocal control is to minimize the errors in vocal production, the brain only has access to a sensory representation of vocal feedback. Therefore, the goal of vocal control, from the perspective of cortex, is to minimize the distance between the current vocalization representation and a target representation, presumably corresponding to the feedback of intended vocal production. Our data are consistent with such a conceptual framework for self-monitoring.
How the Lombard effect is controlled by neural circuits in the brain is not clear. It is possible that there are multiple levels of vocal control involved in producing this vocal control behavior. The magnitude of vocal intensity increases during masking shown in a study of the decerebrate cat (vocalizations evoked by stimulating the brainstem periaqueductal gray) was ∼3 dB (Nonaka et al., 1997), in contrast to much higher increases observed both in the present study (Fig. 1) and in previous studies (Egnor and Hauser, 2006) in nonhuman primates. Furthermore, masking noise can also change other properties of vocalization, including vocal phrase timing and duration (Hanley and Steer, 1949; Egnor et al., 2006), implicating more complex control behaviors. Animals will also change the timing of their vocalizations to avoid overlap with patterned masking noise bursts (Egnor et al., 2007). Finally, compensatory vocal amplitude increases exhibit a context dependence, including voluntary extinction (Pick et al., 1989), modulation of the magnitude of compensation in appropriate social situations, and a learned behavior that results in compensation in the experimental environment even when masking noise is not used (Egnor et al., 2006). These results suggest that multiple levels of vocal control exist and act during Lombard effect behaviors, including automatic brainstem reflexes and more complicated mechanisms likely involving the cortex and other higher brain structures.
Further implications for vocal feedback monitoring
While these experiments used only a single method of manipulating vocal feedback (e.g., noise masking), the results have broader implications for self-monitoring and feedback-related vocal control. These experiments support our previous observations that vocalization-induced inhibition in auditory cortex is sensitive to alterations in vocal feedback, and that changes in vocal feedback cause a reduction in the suppression of neural activities. Such observations suggest a conserved mechanism for self-monitoring of vocal feedback, independent of specific feedback errors in amplitude, frequency, or other dimensions. This encoding of feedback changes could then be relayed to neural structures involved in computing vocal error and those involved in controlling vocal output.
There are also important implications for these findings beyond the physiological mechanisms for normal vocal production and control, for example, implications for understanding human speech deficits resulting from various diseases. Problems with the auditory cortex and vocal feedback processing have been suggested to underlie stuttering in some patients (Timmons and Boudreau, 1972; Fox et al., 1996). In particular, masking noise has been shown to reduce stuttering (Maraist and Hutton, 1957), possibly due to the blockade of vocal feedback during speech. Corollary discharge mechanisms (Crapse and Sommer, 2008a,b), like those involved in vocalization-induced inhibition of the auditory cortex, are thought to be involved in the auditory hallucinations of schizophrenia as their absence may interfere with the differentiation between internal and external sources of auditory cortex activity (Ford et al., 2001a; van Lutterveld et al., 2011). Finally, patients with Parkinson's disease exhibit both decreased vocal amplitudes and a smaller magnitude of the Lombard effect (Ho et al., 1999), suggesting a component of their vocal disturbances may be related to the calculation of vocal feedback error in the basal ganglia, in particular the error in vocal amplitude, when presented with masking noise.
Footnotes
This work was supported by National Institutes of Health Grants DC005808 and DC008578.We thank C. Miller for comments on this manuscript and A. Pistorio for assistance in animal care and training.
References
- Barbour DL, Wang X. Contrast tuning in auditory cortex. Science. 2003a;299:1073–1075. doi: 10.1126/science.1080425. [DOI] [PMC free article] [PubMed] [Google Scholar]
- Barbour DL, Wang X. Auditory cortical responses elicited in awake primates by random spectrum stimuli. J Neurosci. 2003b;23:7194–7206. doi: 10.1523/JNEUROSCI.23-18-07194.2003. [DOI] [PMC free article] [PubMed] [Google Scholar]
- Bauer JJ, Mittal J, Larson CR, Hain TC. Vocal responses to unanticipated perturbations in voice loudness feedback: an automatic mechanism for stabilizing voice amplitude. J Acoust Soc Am. 2006;119:2363–2371. doi: 10.1121/1.2173513. [DOI] [PMC free article] [PubMed] [Google Scholar]
- Behroozmand R, Karvelis L, Liu H, Larson CR. Vocalization-induced enhancement of the auditory cortex responsiveness during voice F0 feedback perturbation. Clin Neurophysiol. 2009;120:1303–1312. doi: 10.1016/j.clinph.2009.04.022. [DOI] [PMC free article] [PubMed] [Google Scholar]
- Brumm H, Todt D. Noise-dependent song amplitude regulation in a territorial songbird. Anim Behav. 2002;63:891–897. [Google Scholar]
- Brumm H, Voss K, Köllmer I, Todt D. Acoustic communication in noise: regulation of call characteristics in a New World monkey. J Exp Biol. 2004;207:443–448. doi: 10.1242/jeb.00768. [DOI] [PubMed] [Google Scholar]
- Burnett TA, Freedland MB, Larson CR, Hain TC. Voice F0 responses to manipulations in pitch feedback. J Acoust Soc Am. 1998;103:3153–3161. doi: 10.1121/1.423073. [DOI] [PubMed] [Google Scholar]
- Christoffels IK, Formisano E, Schiller NO. Neural correlates of verbal feedback processing: an fMRI study employing overt speech. Hum Brain Mapp. 2007;28:868–879. doi: 10.1002/hbm.20315. [DOI] [PMC free article] [PubMed] [Google Scholar]
- Crapse TB, Sommer MA. Corollary discharge circuits in the primate brain. Curr Opin Neurobiol. 2008a;18:552–557. doi: 10.1016/j.conb.2008.09.017. [DOI] [PMC free article] [PubMed] [Google Scholar]
- Crapse TB, Sommer MA. Corollary discharge across the animal kingdom. Nat Rev Neurosci. 2008b;9:587–600. doi: 10.1038/nrn2457. [DOI] [PMC free article] [PubMed] [Google Scholar]
- Creutzfeldt O, Ojemann G, Lettich E. Neuronal activity in the human lateral temporal lobe. II. Responses to the subjects own voice. Exp Brain Res. 1989;77:476–489. doi: 10.1007/BF00249601. [DOI] [PubMed] [Google Scholar]
- Crone NE, Hao L, Hart J, Jr, Boatman D, Lesser RP, Irizarry R, Gordon B. Electrocorticographic gamma activity during word production in spoken and sign language. Neurology. 2001;57:2045–2053. doi: 10.1212/wnl.57.11.2045. [DOI] [PubMed] [Google Scholar]
- Curio G, Neuloh G, Numminen J, Jousmäki V, Hari R. Speaking modifies voice-evoked activity in the human auditory cortex. Hum Brain Mapp. 2000;9:183–191. doi: 10.1002/(SICI)1097-0193(200004)9:4<183::AID-HBM1>3.0.CO;2-Z. [DOI] [PMC free article] [PubMed] [Google Scholar]
- Cynx J, Lewis R, Tavel B, Tse H. Amplitude regulation of vocalizations in noise by a songbird, Taeniopygia guttata. Anim Behav. 1998;56:107–113. doi: 10.1006/anbe.1998.0746. [DOI] [PubMed] [Google Scholar]
- Egan JJ. Psychoacoustics of the Lombard voice response. J Aud Res. 1972;12:318–324. [Google Scholar]
- Egnor SE, Hauser MD. Noise-induced vocal modulation in cotton-top tamarins (Saguinus oedipus) Am J Primatol. 2006;68:1183–1190. doi: 10.1002/ajp.20317. [DOI] [PubMed] [Google Scholar]
- Egnor SE, Iguina CG, Hauser MD. Perturbation of auditory feedback causes systematic perturbation in vocal structure in adult cotton-top tamarins. J Exp Biol. 2006;209:3652–3663. doi: 10.1242/jeb.02420. [DOI] [PubMed] [Google Scholar]
- Egnor SE, Wickelgren JG, Hauser MD. Tracking silence: adjusting vocal production to avoid acoustic interference. J Comp Physiol A Neuroethol Sens Neural Behav Physiol. 2007;193:477–483. doi: 10.1007/s00359-006-0205-7. [DOI] [PubMed] [Google Scholar]
- Eliades SJ, Wang X. Sensory-motor interaction in the primate auditory cortex during self-initiated vocalizations. J Neurophysiol. 2003;89:2194–2207. doi: 10.1152/jn.00627.2002. [DOI] [PubMed] [Google Scholar]
- Eliades SJ, Wang X. Dynamics of auditory-vocal interaction in monkey auditory cortex. Cereb Cortex. 2005;15:1510–1523. doi: 10.1093/cercor/bhi030. [DOI] [PubMed] [Google Scholar]
- Eliades SJ, Wang X. Neural substrates of vocalization feedback monitoring in primate auditory cortex. Nature. 2008a;453:1102–1106. doi: 10.1038/nature06910. [DOI] [PubMed] [Google Scholar]
- Eliades SJ, Wang X. Chronic multi-electrode neural recording in free-roaming monkeys. J Neurosci Methods. 2008b;172:201–214. doi: 10.1016/j.jneumeth.2008.04.029. [DOI] [PMC free article] [PubMed] [Google Scholar]
- Flinker A, Chang EF, Kirsch HE, Barbaro NM, Crone NE, Knight RT. Single-trial speech suppression of auditory cortex activity in humans. J Neurosci. 2010;30:16643–16650. doi: 10.1523/JNEUROSCI.1809-10.2010. [DOI] [PMC free article] [PubMed] [Google Scholar]
- Ford JM, Mathalon DH, Heinks T, Kalba S, Faustman WO, Roth WT. Neurophysiological evidence of corollary discharge dysfunction in schizophrenia. Am J Psychiatry. 2001a;158:2069–2071. doi: 10.1176/appi.ajp.158.12.2069. [DOI] [PubMed] [Google Scholar]
- Ford JM, Mathalon DH, Kalba S, Whitfield S, Faustman WO, Roth WT. Cortical responsiveness during inner speech in schizophrenia: an event-related potential study. Am J Psychiatry. 2001b;158:1914–1916. doi: 10.1176/appi.ajp.158.11.1914. [DOI] [PubMed] [Google Scholar]
- Fox PT, Ingham RJ, Ingham JC, Hirsch TB, Downs JH, Martin C, Jerabek P, Glass T, Lancaster JL. A PET study of the neural systems of stuttering. Nature. 1996;382:158–161. doi: 10.1038/382158a0. [DOI] [PubMed] [Google Scholar]
- Greenlee JD, Jackson AW, Chen F, Larson CR, Oya H, Kawasaki H, Chen H, Howard MA., 3rd Human auditory cortical activation during self-vocalization. PLoS One. 2011;6:e14744. doi: 10.1371/journal.pone.0014744. [DOI] [PMC free article] [PubMed] [Google Scholar]
- Hanley CN, Harvey DG. Quantifying the Lombard effect. J Speech Hear Disord. 1965;30:274–277. doi: 10.1044/jshd.3003.274. [DOI] [PubMed] [Google Scholar]
- Hanley TD, Steer MD. Effect of level of distracting noise upon speaking rate, duration and intensity. J Speech Disord. 1949;14:363–368. doi: 10.1044/jshd.1404.363. [DOI] [PubMed] [Google Scholar]
- Ho AK, Bradshaw JL, Iansek R, Alfredson R. Speech volume regulation in Parkinson's disease: effects of implicit cues and explicit instructions. Neuropsychologia. 1999;37:1453–1460. doi: 10.1016/s0028-3932(99)00067-6. [DOI] [PubMed] [Google Scholar]
- Houde JF, Jordan MI. Sensorimotor adaptation in speech production. Science. 1998;279:1213–1216. doi: 10.1126/science.279.5354.1213. [DOI] [PubMed] [Google Scholar]
- Houde JF, Nagarajan SS, Sekihara K, Merzenich MM. Modulation of the auditory cortex during speech: an MEG study. J Cog Neurosci. 2002;14:1125–1138. doi: 10.1162/089892902760807140. [DOI] [PubMed] [Google Scholar]
- Keller GB, Hahnloser RH. Neural processing of auditory feedback during vocal practice in a songbird. Nature. 2009;457:187–190. doi: 10.1038/nature07467. [DOI] [PubMed] [Google Scholar]
- Kozhevnikov AA, Fee MS. Singing-related activity of identified HVC neurons in the zebra finch. J Neurophysiol. 2007;97:4271–4283. doi: 10.1152/jn.00952.2006. [DOI] [PubMed] [Google Scholar]
- Lane H, Tranel B. The Lombard sign and the role of hearing in speech. J Speech Hear Res. 1971;14:677–709. [Google Scholar]
- Lane H, Webster JW. Speech deterioration in postlingually deafened adults. J Acoust Soc Am. 1991;89:859–866. doi: 10.1121/1.1894647. [DOI] [PubMed] [Google Scholar]
- Lane H, Tranel B, Sisson C. Regulation of voice communication by sensory dynamics. J Acoust Soc Am. 1970;47:618–624. doi: 10.1121/1.1911937. [DOI] [PubMed] [Google Scholar]
- Leonardo A. Experimental test of the birdsong error-correction model. Proc Natl Acad Sci U S A. 2004;101:16935–16940. doi: 10.1073/pnas.0407870101. [DOI] [PMC free article] [PubMed] [Google Scholar]
- Lombard E. Le signe de l'elevation de la voix. Annales des Maladies de l'Oreille et du Larynx. 1911;37:101–119. [Google Scholar]
- Manabe K, Sadr EI, Dooling RJ. Control of vocal intensity in budgerigars (Melopsittacus undulatus): differential reinforcement of vocal intensity and the Lombard effect. J Acoust Soc Am. 1998;103:1190–1198. doi: 10.1121/1.421227. [DOI] [PubMed] [Google Scholar]
- Maraist JA, Hutton C. Effects of auditory masking upon the speech of stutterers. J Speech Hear Disord. 1957;22:385–389. doi: 10.1044/jshd.2203.385. [DOI] [PubMed] [Google Scholar]
- Miller CT, Wang X. Sensory-motor interactions modulate a primate vocal behavior: antiphonal calling in common marmosets. J Comp Physiol A Neuroethol Sens Neural Behav Physiol. 2006;192:27–38. doi: 10.1007/s00359-005-0043-z. [DOI] [PubMed] [Google Scholar]
- Müller-Preuss P, Ploog D. Inhibition of auditory cortical neurons during phonation. Brain Res. 1981;215:61–76. doi: 10.1016/0006-8993(81)90491-1. [DOI] [PubMed] [Google Scholar]
- Nonaka S, Takahashi R, Enomoto K, Katada A, Unno T. Lombard reflex during PAG-induced vocalization in decerebrate cats. Neurosci Res. 1997;29:283–289. doi: 10.1016/s0168-0102(97)00097-7. [DOI] [PubMed] [Google Scholar]
- Numminen J, Salmelin R, Hari R. Subject's own speech reduces reactivity of the human auditory cortex. Neurosci Lett. 1999;265:119–122. doi: 10.1016/s0304-3940(99)00218-9. [DOI] [PubMed] [Google Scholar]
- Paus T, Perry DW, Zatorre RJ, Worsley KJ, Evans AC. Modulation of cerebral blood flow in the human auditory cortex during speech: role of motor-to-sensory discharges. Eur J Neurosci. 1996;8:2236–2246. doi: 10.1111/j.1460-9568.1996.tb01187.x. [DOI] [PubMed] [Google Scholar]
- Peterson GE, Barney HL. Control methods used in the study of vowels. J Acoust Soc Am. 1952;24:175–184. [Google Scholar]
- Pick HL, Jr, Siegel GM, Fox PW, Garber SR, Kearney JK. Inhibiting the Lombard effect. J Acoust Soc Am. 1989;85:894–900. doi: 10.1121/1.397561. [DOI] [PubMed] [Google Scholar]
- Pistorio AL, Vintch B, Wang X. Acoustic analysis of vocal development in a New World primate, the common marmoset (Callithrix jacchus) J Acoust Soc Am. 2006;120:1655–1670. doi: 10.1121/1.2225899. [DOI] [PubMed] [Google Scholar]
- Potash LM. Noise-induced changes in calls of the Japanese quail. Psyhcon Sci. 1972;26:252–254. [Google Scholar]
- Sakata JT, Brainard MS. Online contributions of auditory feedback to neural activity in avian song control circuitry. J Neurosci. 2008;28:11378–11390. doi: 10.1523/JNEUROSCI.3254-08.2008. [DOI] [PMC free article] [PubMed] [Google Scholar]
- Siegel GM, Pick HL., Jr Auditory feedback in the regulation of voice. J Acoust Soc Am. 1974;56:1618–1624. doi: 10.1121/1.1903486. [DOI] [PubMed] [Google Scholar]
- Sinnott JM, Stebbins WC, Moody DB. Regulation of voice amplitude by the monkey. J Acoust Soc Am. 1975;58:412–414. doi: 10.1121/1.380685. [DOI] [PubMed] [Google Scholar]
- Sperry RW. Neural basis of the spontaneous optokinetic response produced by visual inversion. J Comp Physiol Psychol. 1950;43:482–489. doi: 10.1037/h0055479. [DOI] [PubMed] [Google Scholar]
- Timmons BA, Boudreau JP. Auditory feedback as a major factor in stuttering. J Speech Hear Disord. 1972;37:476–484. doi: 10.1044/jshd.3704.476. [DOI] [PubMed] [Google Scholar]
- Tourville JA, Reilly KJ, Guenther FH. Neural mechanisms underlying auditory feedback control of speech. Neuroimage. 2008;39:1429–1443. doi: 10.1016/j.neuroimage.2007.09.054. [DOI] [PMC free article] [PubMed] [Google Scholar]
- van Lutterveld R, Sommer IE, Ford JM. The neurophysiology of auditory hallucinations—a historical and contemporary review. Front Psychiatry. 2011;2:28. doi: 10.3389/fpsyt.2011.00028. [DOI] [PMC free article] [PubMed] [Google Scholar]
- Wang X. On cortical coding of vocal communication sounds in primates. Proc Natl Acad Sci U S A. 2000;97:11843–11849. doi: 10.1073/pnas.97.22.11843. [DOI] [PMC free article] [PubMed] [Google Scholar]
- Wang X, Lu T, Snider RK, Liang L. Sustained firing in auditory cortex evoked by preferred stimuli. Nature. 2005;435:341–346. doi: 10.1038/nature03565. [DOI] [PubMed] [Google Scholar]