

Abstract
Using a coarse-grained lipid and peptide model, we show that the free energy stabilization of amyloid-β in heterogeneous lipid membranes is predicted to have a dependence on asymmetric distributions of cholesterol compositions across the membrane leaflets. We find that a highly asymmetric cholesterol distribution that is depleted on the exofacial leaflet but enhanced on the cytofacial leaflet of the model lipid membrane thermodynamically favors membrane retention of a fully embedded Aβ peptide. However, in the case of cholesterol redistribution that increases concentration of cholesterol on the exofacial layer, typical of aging or Alzheimer’s disease, the free energy favors peptide extrusion of the highly reactive N-terminus into the extracellular space that may be vulnerable to aggregation, oligomerization, or deleterious oxidative reactivity.
Introduction
Alois Alzheimer, in his original 1907 report on the pathologies he observed of the brain of deceased patient Auguste Deter, noted three markers for the degenerative disease (1). Two of the markers of Alzheimer’s disease (AD) are the now well-known presence of insoluble extracellular plaques containing the Aβ peptide and intracellular tangles that also incorporate the hyperphosphorylated Tau protein (2–4). These compelling features have led to many decades of long investigations devoted to refining our knowledge about these deposits, the possible origins of the cytotoxicity of the insoluble aggregates or their soluble precursors (4), and the continued search for therapeutics that mitigate their cytotoxic effects (5,6). However, a third pathological marker for AD noted by Alzheimer in his early study was the presence of lipoid granules that is now recognized as a symptom of aberrant lipid metabolism (1,2).
The disease implications for this third pathology for Alzheimer’s have only become prominent over the last decade (2) and arise from several well-supported observations (3,4): the one definitive genetic marker for AD involves mutation of apolipoprotein E (ApoE) that is responsible for lipid transport and cholesterol regulation; many of the proteins indicted in AD are transmembrane proteins such as the amyloid precursor protein (APP) as well as α-, β-, and γ-secretases that cleave APP to yield various peptide products including Aβ; and finally the fact that aggregation of Aβ and possibly Tau is mediated by the cell membrane environment (3). Recent NMR, chromatography, and mass spectrometry studies have examined how lipid composition changes in neuronal cell membranes of Alzheimer’s patients, noting a significant loss of phosphatidyl-ethanolamine (PE) and a variety of sphingolipids such as sulfatides and ceramides (7).
The newly emergent field of lipidomics (8) is allowing for large-scale measurements of lipid compositions and/or their spatial/temporal arrangements in the cell membrane of various tissues. Relevant to this work is that such measurements provide information on lipid membrane compositions of brain matter as a function of aging (9–13) or induced by the degenerative AD state (7). For example, aging rat brain cells show a redistribution of cholesterol toward greater accumulation onto the exoplasmic leaflet of the synaptic plasma membrane (SPM) (14,15). In the aging human brain (aging being a primary factor in AD) there is a marked loss or gain of various gangliosides (10,11), and redistributions of phospholipids and cholesterol across the bilayer leaflets are thought to negatively impact neuronal membrane function (16). Modifications of cholesterol distributions in neuronal plasma membranes may especially be relevant for neurodegenerative diseases of aging such as Alzheimer’s and Parkinson’s (17). For example, a ∼30% decrease in the molar ratio of cholesterol/phospholipid with respect to healthy levels (18) and cholesterol redistribution in the membrane (16,17) are hypothesized to be predisposition factors to AD because they are a consequence of aging, the primary factor in developing the disease, and they correlate with overexpression or aberrant activity of ApoE (14,19), whose function is to transport cholesterol across the membrane leaflets.
In this work we model the lipid compositions based on a combination of two different experimental studies of lipid compositions of the SPM from rats and mice. Cotman and co-workers (20) assayed the composition of rat SPM using chromatography to characterize the concentration and types of phospholipids as well cholesterol across the lipid bilayer. Their data showed that 62% of the lipid content of the SPM consists of neutral saturated phosphatidylcholine (PC) and unsaturated PE lipids, 12% negatively charged phosphatidylserine (PS) and phosphatidylinositol lipids, and a small percentage (∼3%) of sphingomyelin. The predominant sterol is found to be cholesterol, comprising over 18% of the membrane (by mass). It has long been known that the phospholipids are unevenly distributed between the exofacial (exo) and cytofacial (cyto) leaflets of the membrane, with the cyto one being negatively charged (by virtue of including most of the PS), whereas the exo leaflet is approximately neutral. Somewhat more recently, Igbavboa et al. (15) showed there is an age-dependent distribution of cholesterol between the SPM leaflets, which they measured at four different stages of life. Young mice (∼3–4 months) were reported to have the total cholesterol distributed asymmetrically at 15% along the exo plane, with the remaining 85% accumulated along the cyto leaflet (15%/85% exo/cyto); these values change during life and level off at a mature stage to reach a roughly 50%/50% exo/cyto distribution (15).
Here, we investigate how different lipid compositions increase or decrease the free energy of lipid bilayer incorporation of the Aβ42 peptide, and whether it is the asymmetry or the amount of cholesterol that matters for the positioning of the Aβ peptide in the membrane. We use coarse-grained (CG) representations of Aβ42 assuming that it has an overall helical percentage of 70% or 30%, and lipid bilayers composed of phosphatidylcholine (POPC), phosphatidylethanolamine (DOPE), phosphatidylserine (POPS), and cholesterol. Given the small percentages of measured phosphatidylinositol and sphingomyelin (20), and the finite bilayer area we have simulated, their number representations are negligible and therefore were ignored in our study. The spatial composition of the lipids are organized so that they reproduce age-dependent asymmetries in cholesterol distributions between the inner and outer membrane leaflets, and we compare them to controls that vary the cholesterol percentage while keeping it symmetrically distributed across the two leaflets, or with no cholesterol at all.
We find that the reduced concentrations of cholesterol in the exofacial leaflet, the membrane model closest to that of young neuronal cells in rodents, favors membrane retention of the highly reactive N-terminus region of the Aβ peptide with the C-terminus exposed to the cytosol. By contrast, decreases in the cholesterol content of the cyto leaflet, corresponding to the SPM of aged individuals, favor repositioning of the Aβ42 C-terminus to the exo leaflet, with the first 28 residues of the Aβ42 peptide collocated to the extracellular space. Elimination of cholesterol altogether (an extreme case of the depletion of cholesterol as reported for AD patients (18)), no longer stabilizes any part of the Aβ42 peptide in the membrane, and instead the entire peptide is stabilized on the membrane surface. These results are dependent on the condition that the C-terminal residues of Aβ42 adopt helical structure, which would be expected for a peptide with the glycine-X-X-X-glycine motif that is observed for other transmembrane proteins and peptides that adopt an α-helix structure inside a membrane (21). Our work shows that small variations in cholesterol asymmetries (∼10% molar fraction per leaflet) can strongly influence the thermodynamics of Aβ peptide exposure to the extracellular solvent.
Models and Methods
Model membrane compositions and peptide structure
We used the MARTINI 2.0 model (22) for all the lipids, cholesterol, Aβ42 peptide, ions, and water, and molecular dynamics (MD) simulations of the CG model were performed using GROMACS 4.5.4 (23). Six planar lipid bilayers were created with composition percentages of POPC, DOPE, POPS, and cholesterol chosen to reproduce reasonable models of heterogeneous SPM lipid compositions in [(20)] and [(15)], and including some additional controls, which are listed in Table 1. The overall cholesterol concentration (compared to all of the lipids in the membrane) varied between 0% and 80%, and the cholesterol was distributed symmetrically or asymmetrically for a given concentration. Although it is estimated that typical membranes are composed on average of equal percentages of proteins and a variety of lipids, if we consider our small surface of ∼100 nm2 in area compared to the total neuronal cell diameter that varies from 0.4 to 100 μm, we can legitimately model the subdomain as a planar bilayer devoid of multiple protein constituents.
Table 1.
Number and type of each lipid and solvation molecules simulated for each type of bilayer; variations arise due to small differences in simulation box volume
| Lipid bilayer model | Leaflet | POPC | DOPE | POPS | Cholesterol |
|---|---|---|---|---|---|
| 40% cholesterol concentration | Exo | 60 | 47 | 3 | 33 |
| 30% exo/70%cyto | Cyto | 28 | 24 | 27 | 100 |
| 40% cholesterol concentration | Exo | 58 | 47 | 3 | 40 |
| 40% exo/60%cyto | Cyto | 30 | 24 | 27 | 93 |
| 20% cholesterol concentration | Exo | 44 | 47 | 3 | 24 |
| 50% exo/50%cyto | Cyto | 44 | 27 | 27 | 24 |
| 40% cholesterol concentration | Exo | 44 | 47 | 3 | 66 |
| 50% exo/50%cyto | Cyto | 44 | 24 | 27 | 66 |
| 80% cholesterol concentration | Exo | 44 | 47 | 3 | 376 |
| 50% exo/50%cyto | Cyto | 44 | 24 | 27 | 380 |
| No sterol | Exo | 120 | 25 | 3 | 0 |
| Cyto | 27 | 96 | 24 | 0 |
The most physiologically relevant lipid bilayers we studied had an overall cholesterol concentration of 40%, in which cholesterol was varied asymmetrically or symmetrically across the exo and cyto leaflets, consistent with the SPM changes with age studied by Igbavboa and co-workers (15). We note that it was not possible to stabilize a planar bilayer model of the 15%/85% exo/cyto asymmetry (corresponding to the earliest stage of life for mice SPM), in which the membrane exhibited high curvature (24). The appearance of high curvature due to heterogeneous or asymmetric membranes formed by different sizes/lengths of lipid components has already been analyzed by others (24) and was largely found to be independent of the ensemble used. Nonetheless, we were able to produce stable planar bilayers with a total cholesterol concentration of 40% and distributions of 30%/70% and 40%/60% exo/cyto asymmetry. To be consistent in our analysis of a given cholesterol composition for the asymmetric distributions at 40% concentration, we fixed the total number of all lipids, and changed just the partitioning of cholesterol and POPC to maintain a constant surface area of the membrane; we note that the molecular weight of cholesterol is roughly half that of other phospholipids. Although other choices are possible, this approach also kept the PS numbers constant to ensure the basic electrostatic configuration of the membrane (inner leaflet = negative, outer leaflet = roughly neutral) was maintained. We also considered additional controls of planar lipid bilayers with symmetric distributions of 20% and 80% cholesterol concentration, as well as no cholesterol at all.
We have focused most of our calculations on the reasonable expectation that a single Aβ42 peptide is predominately (∼70%) helical in a lipid bilayer environment, although an additional control was considered that lowered helical content to just 30%. Coordinates for Aβ42 with 70% helical content were obtained from structure 1IYT (25), in which the peptide is solvated in an apolar environment that mimics the membrane interior. The structure was converted to the MARTINI CG secondary structure assignment using Dictionary of Secondary Structure of Proteins (DSSP) (26): TTSSSTTHHHHHHHHHHHHHHHHHHTTHHHHHHHHHHHHSTT. (In DSSP the secondary structure abbreviations are: H = α-helix, S = bend, and T = hydrogen-bonded turn.) It should be noted that the secondary structure is immutable in the MARTINI force field once specified and subsequently the helical regions do not change when simulated under thermal motion or altered membrane environments (although the low dihedral barriers for the turn regions are more flexible). Therefore, we also considered an alternative secondary structure profile for Aβ42 in which the overall α-helical content was reduced to 25–30%, and was manifested as the secondary assignment of: TTSSTTTTTTHHHHHHHHHHHTTTTTTSGGGSSSSTTSSTTT based on Protein Data Bank structure 1Z0Q (27). (The additional DSSP abbreviation here is G = 310-helix.) Note that the two alternative structures differ primarily in whether the C-terminus adopts a helical domain.
Simulation protocols
To produce the initial configurations of the model bilayers both with and without the Aβ42 peptide, we used Packmol (28). For the systems containing Aβ42, the system was built with the helical peptide inserted with its longitudinal axis parallel to the membrane axis (vertical position). We chose simulation box sizes that allowed for ∼30 CG water molecules per lipid, equivalent to hydrating each phospholipid with >120 all-atom water molecules. We added Na+ and Cl− ions to reproduce the physiological salt concentration of 150 mM, with additional Na+ to neutralize the overall negative net charge of the bilayer, and used a relative dielectric constant of 15. We then performed 4000 steps of steepest descent minimization, and then carried out two ∼3 μs NPγT simulations (constant surface tension γ = 0) at T = 298.15 K and at T = 323.15 K—each with periodic boundary conditions. The purpose of conducting simulations at two temperatures was to produce controls that studied the difference in the mobility of the peptide between 298 and 323 K. We chose a time step of 20 fs for all of the unbiased simulations. To ensure a constant temperature, we coupled the lipids and water (including counterions) separately using a Bussi velocity rescaling thermostat (29) with a time constant τT = 0.3 ps for each coupling group. To ensure constant pressure and surface tension, we used a semiisotropic Berendsen barostat (30) with a time constant τP = 3 ps, pressure of 1.0 bar, and compressibility of 3 × 10⁻⁵ bar−1. In addition, we chose shifted nonbonded potentials in the range 0–1.2 nm (Coulomb) and 0.9–1.2 nm (van der Waals). We constrained all the lengths of the bonds via the Lincs algorithm (31). All other analyses (and the biased simulations described below) were performed on the systems produced at 323 K, a temperature that was purposefully chosen to be above the gel-to-liquid phase transition for all of the phospholipids included in our bilayers.
For the asymmetric cholesterol distribution the initial conditions of exo/cyto cholesterol distributions were 25%/75% and 30%/70% which equilibrated to a concentration of 30%/70% and 40%/60%, respectively. The symmetric distributions equilibrated to cholesterol distributions consistent with their initial conditions. We calculated the diffusion coefficient from the Einstein relation based on the mean square displacement. We limited the calculation to the outer leaflet, because we were primarily interested in the changes of fluidity that occur within the exo region through which the Aβ peptide is released. We considered a number of additional controls: two symmetric bilayers (20% and 80% total cholesterol concentration) and two bilayers in which Aβ42 was assigned an alternate secondary structure (described previously). For these controls, the simulation protocols were the same as previously described, but the equilibration and production simulations were run only at 323 K (∼3 μs).
To calculate the free energy as a function of the distance between the center of mass of the peptide and of the overall lipid bilayer, we used an umbrella sampling method consistent with the one used by Lemkul and Bevan (32). Initial snapshots for the umbrella sampling windows were generated by performing steered MD (SMD) simulations in which the center of mass of the peptide was pulled along the z axis from within the membrane out into solvent. A schematic of the simulation setup is depicted in Fig. 1. The pulling rates used in the SMD simulations varied from 0.05–0.60 nm/ns, and the force constants used varied from 1000–8000 kJ/mol/nm2. The umbrella sampling windows were separated by ∼1 Å along the reaction coordinate, resulting in 23–46 windows for each peptide-membrane system depending on cholesterol content. Individual umbrella simulations ranged in length from 525 to 1800 ns, resulting in total simulation times ranging from 12 to 60 μs. The umbrella sampling simulations used a simple harmonic potential to maintain the system within the specified range of the reaction coordinate. In both the SMD simulations and umbrella sampling simulations, we sampled with integration steps ranging between 0.01 and 0.02 ps and made use of the Nosé-Hoover thermostat (33,34) and Parrinello-Rahman barostat (35,36) using coupling constants τT = 4 ps and τP = 4 ps, respectively. The reaction coordinate histograms were obtained by excluding the first 300 ns of each umbrella window simulation (i.e., treating this time as the equilibration period). These were then converted into free energy profiles using WHAM (23,37), and respective error bars were computed via bootstrapped trajectories based on the umbrella histograms (37). Specifically, the histograms of the umbrella sampling windows were used to create new random (reaction coordinate versus time) trajectories with the appropriate probability distributions and autocorrelation times. For each pmf, we generated 50 such bootstrapped trajectories, and the error bars shown are the standard deviations of the bootstrapped pmfs from the average pmfs (which in the limit of an infinite number of bootstrapped trajectories would be identical to the original pmfs (37)).
Figure 1.
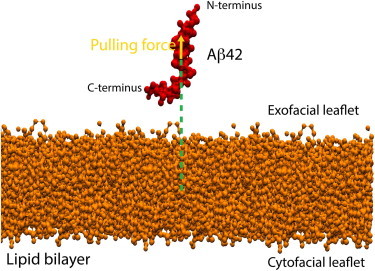
Representative schematic of the simulation setup depicting Aβ42 (red) plus a lipid bilayer (orange) system. The green dotted lines define the distance between the centers of mass of the peptide and of the overall lipid bilayer, used as the reaction coordinate for the computation of the free energy. The yellow arrow indicates the direction of the pulling force vector to generate the starting snapshots for the umbrella sampling windows.
Results
Membrane thickness and diffusion
Table 2 presents the results on bilayer thickness for the 40% total cholesterol bilayers, in which we found values between 4.2 and 4.7 nm, in excellent agreement with the experimental data generated from neutron (38) and x-ray diffraction (39) and the expected dependence on temperature. Nevertheless, our heterogeneous membranes in the presence of 70% helical Aβ resulted in a small but measureable thinning of the different membranes, averaged over the whole membrane patch, except for the symmetric (i.e., 50%/50% exo/cyto) cholesterol distribution in which the difference is within the uncertainties of the calculation. It is interesting to note that a general thinning of neuronal membrane has been observed in AD patients as compared to healthy subjects (18), and another study documented a membrane thinning associated with the introduction of Aβ (40,41). However, the much smaller (nearly order of magnitude) differences in membrane thinning we observe in this study are certainly due to the low Aβ42 concentration and higher cholesterol/lipid molar ratio used here compared to these previous experiments. Although we cannot directly make connections between our results and these other disease studies (40,42), it does bring up an important point about the interpretation of those measurements. In particular, the membrane thickness is not uniform over the entire patch as we will see from the radial distribution functions presented below, and those variations differ depending on cholesterol content and distribution. For example, for the symmetric cholesterol distribution we find that the sterol and lipids significantly enhance their local density near the peptide that results in a measurable thickening, even when averaged over the whole membrane patch.
Table 2.
Values of bilayer thickness for all the bilayers at each temperature
| Temperature | Peptide | Bilayer 30%/70% exo/cyto (40% cholesterol concentration) (nm) | Bilayer 40%/60% exo/cyto (40% cholesterol concentration) (nm) | Bilayer 50%/50% exo/cyto (40% cholesterol concentration) (nm) | No cholesterol (nm) |
|---|---|---|---|---|---|
| 298 K | No | 4.748 ± 0.050 | 4.665 ± 0.019 | 4.541 ± 0.014 | 4.538 ± 0.006 |
| Aβ | 4.524 ± 0.058 | 4.430 ± 0.086 | 4.666 ± 0.032 | 4.382 ± 0.024 | |
| 323 K | No | 4.647 ± 0.028 | 4.592 ± 0.039 | 4.459 ± 0.049 | 4.530 ± 0.100 |
| Aβ | 4.426 ± 0.011 | 4.380 ± 0.038 | 4.541 ± 0.075 | 4.465 ± 0.033 |
To quantify bilayer thickness to compare to an electron (or a mass) density profile, we measure at different temperatures the distance between the peaks belonging to the phospholipids headgroup regions of the asymmetrical cholesterol containing bilayers and of the bilayer without cholesterol. The average distance and standard deviation were taken over three different blocks of trajectories, each consisting of 250 ns of simulation time.
Table 3 reports the lateral diffusion constant of phospholipids belonging to the exo leaflet, which range from 7–90 × 10−12 m2/s depending on temperature (298 or 323 K) and whether 70% helical Aβ42 and/or cholesterol is present. The simulations reproduce the expected diffusion enhancement trends with increasing temperature and the experimental observation that above a ∼30% mole fraction of cholesterol the lipid lateral diffusion is consistently reduced by a factor of 2–3 (43). In the presence of Aβ42 at 323 K, however, we find a small increase in the lateral diffusion coefficients for the 30%/70% and 40%/60% exo/cyto cholesterol distributions, consistent with previous quasielastic neutron scattering data on Aβ25–35 in DMPC/DMPS membranes (44) that showed an increase in lipid mobility caused by the interaction between the bilayer and the Aβ peptide itself. In fact comparing our results to that study (44), which measured lateral lipid diffusion coefficients of 50–180 10−12 m2/s over a range of 290–320 K for membranes without cholesterol, our determined values of 7–90 × 10−12 m2/s over the same temperature range and with cholesterol, and given that the MARTINI CG model dynamics are usually faster, appear reasonable. The one exception is that the lipid lateral diffusion coefficient decreased in the presence of the Aβ peptide for the 50%/50% exo/cyto, in good agreement with an atomistic MD study (45) that simulated the Aβ42 monomer embedded in a bilayer composed of only POPC with symmetrically distributed cholesterol at a 40% concentration. This result is due to the strong interactions of the peptides with cholesterol and lipids, consistent with the membrane thickening results at the same cholesterol conditions described previously, and which we analyze in more detail below.
Table 3.
Values of exofacial phospholipid lateral diffusion coefficient DL
| Temperature | Peptide | No cholesterol (10−11 m2/s) | Bilayer 30%/70% exo/cyto (40% cholesterol concentration) (10−11 m2/s) | Bilayer 40%/60% exo/cyto (40% cholesterol concentration) (10−11 m2/s) | Bilayer 50%/50% exo/cyto (40% cholesterol concentration) (10−11 m2/s) |
|---|---|---|---|---|---|
| 298 K | No peptide | 4.16(±0.81) | 1.12 (±0.85) | 1.33(±0.42) | 1.83 (±0.59) |
| Aβ | 3.17(±0.14) | 1.56 (±0.74) | 1.33(±0.96) | 0.73 (±0.05) | |
| 323 K | No peptide | 6.58(±0.26) | 2.59 (±0.26) | 2.63(±0.65) | 2.65 (±0.88) |
| Aβ | 9.13(±1.45) | 4.21 (±0.55) | 4.28(±1.63) | 2.01 (±0.24) |
Errors computed from the standard deviations from the linear fit in the range 70–400 ns.
Free energy profiles
The free energy trends of the positioning of Aβ42 in the heterogeneous bilayer as a function of cholesterol concentration and asymmetry is evaluated along a reaction coordinate, DCOM, which is the distance between the center of mass of the bilayer and the center of mass of the vertically inserted Aβ42 peptide. Near complete burial of the peptide in the lipid bilayer occurs when DCOM ∼0 nm, and progressively greater extrusion of the Aβ42 peptide into the extracellular space corresponds to DCOM > 0 nm. Umbrella sampling was used to examine the free energy change for the Aβ42 peptide initially embedded in the lipid bilayer at DCOM = 0 nm and as it progresses along the reaction coordinate toward the exo side for each lipid bilayer membrane composition (see Methods).
We first discuss the potential of mean force results on the physiologically relevant lipid bilayer with 40% cholesterol concentration, but in which the cholesterol is distributed at 30%/70%, 40%/60%, and 50%/50% in the exo/cyto leaflets. We also only consider the 70% helical Aβ42 that adopts helical domains in both the N-terminus and C-terminus of the peptide. Fig. 2 a shows that a highly asymmetric cholesterol distribution in the membrane—one consistent with the sterol distributions observed in young mice SPMs—thermodynamically favors the nearly full embedding of the Aβ42 peptide at DCOM ∼0 nm, with a favorable binding free energy of ∼40 kJ/mol compared to the completely released peptide at DCOM ∼3.0 nm. When we evaluate the solvent accessible surface area (SASA) of the peptide to water at the free energy minimum (DCOM ∼0 nm), we find that the N-terminal region of the peptide largely remains protected from the extracellular space (exposing only the first six residues), although the C-terminus of the peptide is solvent exposed on the cytosol side of the model membrane (Fig. 3 a).
Figure 2.
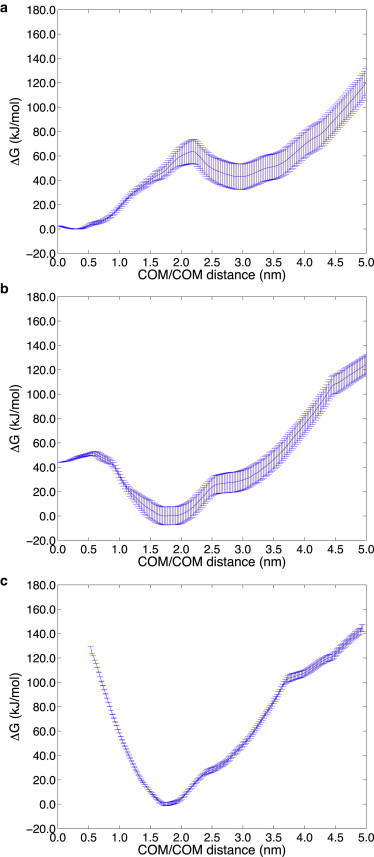
Free energy profile at 323 K as a function of the distance between the centers of mass of the 70% helical Aβ42 peptide and lipid bilayer (DCOM), for 40% total cholesterol. (a) The most asymmetric 30%/70% exo/cyto cholesterol distribution consistent with the SPM of a young individual. The global free energy minimum corresponds to the near complete burial of the peptide in the membrane (DCOM ∼0 nm) with C-terminus exposed to the cytosol. (b) The asymmetric 40%/60% exo/cyto cholesterol distribution, consistent with the SPM of an aging individual, has a global free energy minimum in which the N-terminus of Aβ42 strongly prefers exposure to the extracellular region and to the membrane surface (DCOM ∼1.75 nm). (c) The symmetric 50%/50% exo/cyto cholesterol distribution consistent with the SPM of the most mature individual. The free energy shows that Aβ42 N-terminus is irreversibly exposed to the extracellular region and to the membrane surface.
Figure 3.
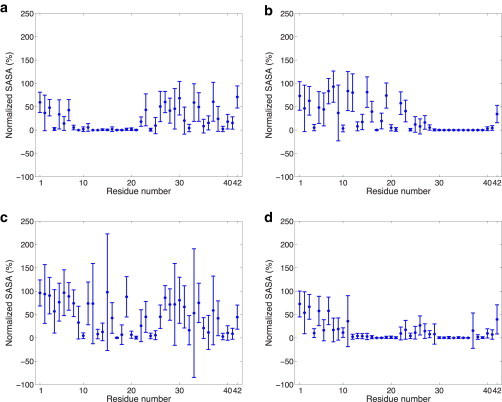
SASA of 70% helical Aβ42 residues evaluated at the dominant minima for (a) 30%/70% exo/cyto in which the C-terminus is exposed to the cytosol, (b) 40%/60% exo/cyto in which the first 28 residues of the N-terminus is solvent exposed to the exo side of the membrane, (c) no cholesterol and evaluated at the lower free energy minimum where the entire peptide is fully exposed to the membrane surface and solvent on the exo side, and (d) no cholesterol and evaluated at the relative free energy minimum where only the first 6 residues are exposed to solvent on the exo side and no exposure on the cytosol side. The SASA values were normalized by the maximum SASA values obtained for the peptide alone (i.e., without any other surrounding molecules). This enables us to differentiate between residues with low SASA due to the structure of the peptide and those with low SASA due to burial within/contact with the lipid membrane.
By contrast for the 40%/60% and 50%/50% exo/cyto cholesterol partitioning, shown to be typical of an aging individual (15), the peptide thermodynamically favors displacement toward the exo side. For the 40%/60% exo/cyto partitioning the new global free energy minimum is at DCOM ∼1.75 nm (Fig. 2 b) and the binding free energy for complete burial of Aβ42 (i.e., at DCOM ∼0 nm) is now unfavorable by ∼50 kJ/mol. At the global free energy minimum for the 40%/60% exo/cyto cholesterol partitioning, the SASA plot in Fig. 3 b shows that the first 28 residues of the N-terminus of the peptide are exposed to the membrane exo membrane surface and aqueous solvent. When 40% total cholesterol is distributed symmetrically across the two leaflets (i.e., 50%/50% exo/cyto partitioning), Aβ42 is further displaced toward the exo side at DCOM ∼1.75–2.0 nm with a binding free energy that now irreversibly favors the N-terminus of the peptide to be collocated outside the exo leaflet of the membrane (Fig. 2 c). In this case, the first 28 residues of the N-terminus of the peptide are again exposed to the exo membrane surface and aqueous solvent, similar to that seen for 40%/60% exo/cyto in Fig. 3 b.
Next, we consider our free energy results from the perspective of whether it is the asymmetry of cholesterol distribution that matters, or whether it depends more on absolute cholesterol content. Fig. 4 shows the free energy change as the 70% helical Aβ42 peptide is pulled out of the lipid bilayer toward the exo side for the symmetric exo/cyto compositions of 20% and 80% total cholesterol, and with no cholesterol at all. With the sterol present at 20% concentration (Fig. 4 a) and 80% concentration (Fig. 4 b), Aβ42 again thermodynamically favors displacement toward the exo side at DCOM ∼1.75–2.0 nm, similar to the 40% cholesterol results. Because the free energy minimum is largely the same for all of the symmetric cholesterol distribution cases, the 20% and 80% SASA plots were found to be largely equivalent to the 40% total cholesterol results seen in Fig. 3 b, in which the first 28 residues of the N-terminus of the peptide is exposed to the membrane exo surface and aqueous solvent. When cholesterol is eliminated altogether (Fig. 4 c), the dominant free energy minimum is displaced to DCOM ∼2.5 nm, corresponding to the fact that neither the N-terminus nor the C-terminus of Aβ42 is anchored in the cyto leaflet of the lipid bilayer. Instead, the peptide is fully released from the membrane to bind to the membrane surface as assessed by the SASA plots shown in Fig. 3 c. However, the peptide still shows a relatively favorable free energy minimum with the peptide buried, but in contrast to the 30%/70% exo/cyto results, the peptide is positioned so that only the roughly first 10 residues are solvent exposed and there is no C-terminus exposure to the cytosol side as shown in Fig. 3 d.
Figure 4.
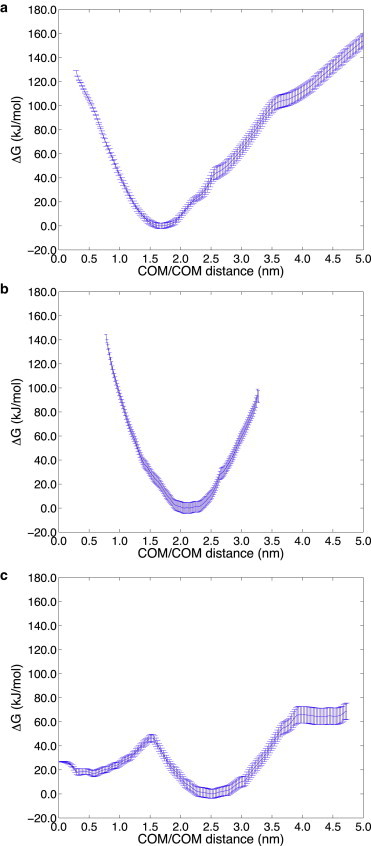
Free energy profile at 323 K as a function of the distance between the centers of mass of the 70% helical Aβ42 peptide and lipid bilayer (DCOM), for (a) 20% total cholesterol and (b) 80% total cholesterol, both symmetrically (50%/50% exo/cyto) distributed across the bilayer, and (c) with no cholesterol present. When cholesterol is present the free energy shows that the Aβ42 N-terminus is irreversibly exposed to the extracellular region and to the membrane surface. When no sterol is present, the free energy profile shows that the Aβ42 peptide has a relative free energy minimum corresponding to the buried peptide (DCOM ∼0.5 nm), whereas the dominant free energy minimum corresponds to collocation of both the N- and C-terminus to the extracellular region and membrane surface (DCOM ∼2.5 nm).
Fig. 5 provides a representative snapshot at the dominant free energy minimum of the very different positioning of the Aβ42 peptide observed in the lipid bilayer for the 30%/70% and 40%/60% exo/cyto cholesterol partitioning, a mere 10% difference in sterol distributions, and with no cholesterol at all. In Fig. 6, we also provide a more quantitative description of the density profile across the lipid bilayer for the headgroups and tails of cholesterol, POPC, and POPS, as well the N- and C-terminus of the Aβ42 peptide. These data are consistent with the trends seen in the SASA plots in Fig. 3, a–d.
Figure 5.
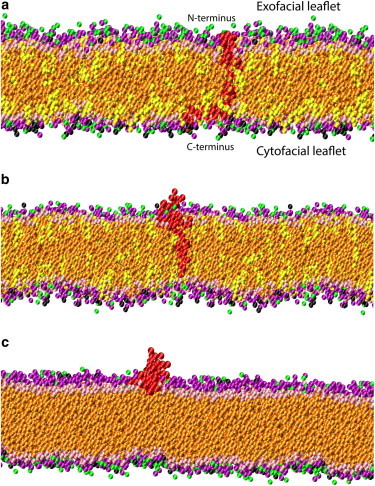
Images representing a configuration at the global free energy minimum for (a) the most asymmetric 30%/70% exo/cyto cholesterol distribution, which shows that the Aβ42 peptide (red) prefers to remain well inserted into the SPM composed of various phospholipids (purple for POPC headgroups, green for DOPE headgroups, black for POPS headgroups, and orange phospholipid tails, whereas pink for cholesterol polar headgroups and yellow for cholesterol tails). (b) The most symmetric 50%/50% exo/cyto cholesterol distribution, which shows that the N-terminus of the Aβ42 peptide prefers to exude from the membrane (same coloring scheme as (a)). (c) A bilayer with no cholesterol distribution shows that the Aβ42 peptide is only stable on the membrane surface (same coloring scheme as (a)).
Figure 6.
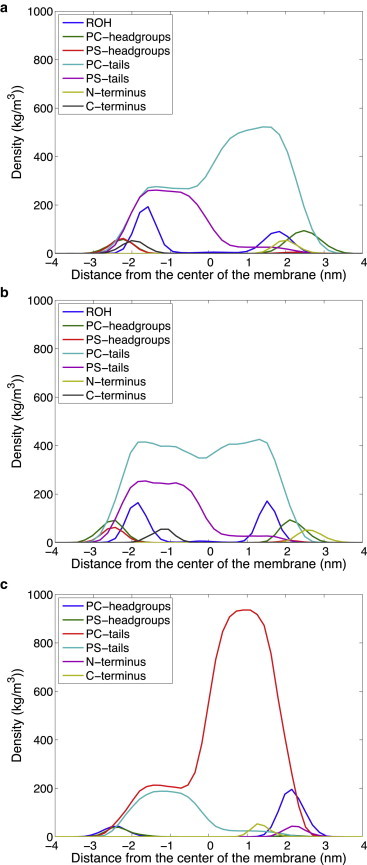
The density profile across the lipid bilayer membrane for different components of the peptides, sterol, and lipids for: (a) the most asymmetric 30%/70% exo/cyto cholesterol distribution; (b) the most symmetric 50%/50% exo/cyto cholesterol distribution; (c) a bilayer with no cholesterol. In the legend ROH represents the polar headgroup of cholesterol. We multiplied the density of the first and last three amino acids (N-terminus and C-terminus) of the Aβ peptide by a factor of 5 to highlight its positioning with respect to the other bilayer constituents.
This trend is, however, is strongly dependent on the helical content of the Aβ peptide. When we considered the 30%/70% exo/cyto cholesterol partitioning but with loss of helicity of the C-terminal domain of Aβ42 (i.e., using secondary structure based on 1Z0Q), the peptide exits the membrane altogether as the free energy (Fig. S1 a in the Supporting Material) and SASA plots (Fig. S1 b) make evident. This is an equally important result that shows that helicity of the C-terminal region of Aβ42 is necessary for its retention in the lipid bilayer and that any loss of secondary structure in this region will release the peptide into the extracellular space.
To better understand what peptide-lipid interactions may be stabilizing Aβ42 at different positions in the bilayer, we have examined the radial distribution functions (RDFs) evaluated at the dominant free energy minimum for the 40% total cholesterol system with 30%/70%, 40%/60%, and 50%/50% exo/cyto cholesterol partitioning, with no cholesterol present, and the symmetrically distributed 20% and 80% total cholesterol membranes. The RDFs are defined as the measured distances of all of the membrane-buried CG atoms of the Aβ42 peptide with all of the CG atoms of the different lipid and sterol components in the membrane bilayers. To not overwhelm the RDF figures, we only plot the neutral PC lipid, the charged PS lipid, and cholesterol interaction profile with the peptide.
Fig. 7 suggests that the primary driving force for the peptide positioning in the membrane is the strong association of the hydrophobic C-terminus of the peptide with cholesterol. The loss of cholesterol on the cyto side eventually destabilizes the buried position of the C-terminus in the membrane seen for 30%/70% and shifts it into the exo leaflet at 40%/60% and 50%/50% (20%, 40%, and 80% total cholesterol), and correspondingly drives out the N-terminus of the peptide to interact with the membrane surface and solvent. The increase in the POPS density is certainly due to the association of its headgroup with the N-terminus of the peptide, which is now on or above the membrane surface, and is also confirmed by the case when cholesterol is eliminated altogether. Because POPC strongly associates with the sterol, its increasing density is tracking the cholesterol association with the peptide C-terminus. Furthermore, we found that the peptide-PE lipid RDFs were very similar to the trends seen for the PC lipid, in which the PE is associating with PC or cholesterol, but not directly with the peptide itself. In the Supporting Material we also include a version of Fig. 7 c with the POPE RDFs included to support this (Fig. S2).
Figure 7.
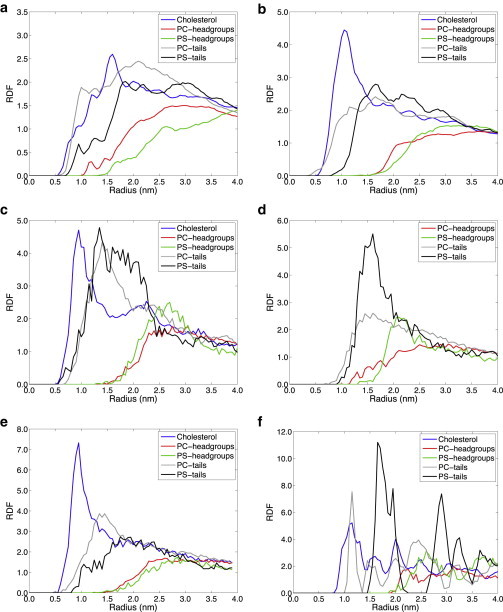
The radial distribution function of the Aβ peptide with different lipid and sterol components for: (a) the most asymmetric 30%/70% exo/cyto cholesterol distribution with total cholesterol of 40%; (b) the 40%/60% exo/cyto cholesterol distribution with total cholesterol of 40%; (c) the symmetric 50%/50% exo/cyto cholesterol distribution with total cholesterol of 40%; (d) no cholesterol. The symmetric 50%/50% exo/cyto cholesterol distribution with total cholesterol of (e) 20% and (f) 80%, in which the high cholesterol concentration in the membrane is found to be a crystalline ordered phase.
Discussion
Various biophysical experiments on Aβ interactions with different lipid environments have shown a strong dependence on cholesterol presence and concentrations that are consistent with the results presented here. In simple lipid monolayers and lipid vesicles (i.e., with only a single phospholipid type and/or distributions that are symmetric across the leaflets) Aβ fully inserts only when the cholesterol content is sufficiently high (46), and Aβ has been found to incorporate more easily into cholesterol-enriched planar lipid membranes composed of PC (47). An NMR study of C-99 embedded in LMPG micelles with low cholesterol concentrations found that the first 28 residues of this APP fragment were found in the extracellular space, although the C-terminus was below the membrane surface. In this experiment the cholesterol concentration in the LMPG micelles was ∼5 mol %, suggesting that the depleted sterol concentration lacks the hydrophobic driving force for deep insertion of the peptide into the micelle (48). A neutron diffraction experiment (49) demonstrated that the helical C-terminal region of the small fragment Aβ25–35 was embedded, but the entire peptide was unable to fully penetrate lipid bilayers as the cholesterol content increased beyond 20% molar ratio. These findings where confirmed for the same peptide fragment, via electron paramagnetic resonance spectroscopy on spin-labeled phospholipid acyl tails, which showed that cholesterol, and not leaflet charge, affects the ability of Aβ fragments to insert (50). Our results are fully consistent with these experimental studies in that the C-terminus of Aβ does embed into the membrane, but the N-terminus is exposed to the extracellular space. What we observe is that the Aβ peptides insert completely for the asymmetric cholesterol partitioning, which is one of the primary results presented here that could be investigated experimentally.
The results generated with the CG lipid and peptide model explored here are consistent with all-atom simulations that also showed that peptide interactions with the membrane were influenced by cholesterol (45,51), although the all-atom studies did not investigate cholesterol asymmetry as we have done here. Lemkul and Bevan (51) found that the C-terminus of Aβ40 remained inserted in the lipid bilayer in the presence of lipid rafts that have cholesterol content. Our results also agree qualitatively with their observation that Aβ40 remained embedded in simpler lipid bilayers with no cholesterol (homogeneous POPC and POPS lipid bilayers, as well as mixed POPC/POPE membranes) in which we also observe a free energy minimum, although the lower free energy state in our model corresponds to the preference for Aβ42 to fully cross the membrane surface and to be fully solvent exposed. We believe that this discrepancy in the preferred free energy minimum is most likely due to differences in the compositions of the membrane systems used in the previous all-atom simulation studies versus the membrane systems used in our study. Indeed, our study has shown that different lipid/sterol compositions can make a qualitative difference in the free energy for peptide stabilization within the membrane. As such, one would have to do a careful calibration study of the same systems using both CG and all-atom simulations to understand whether the differing results are due to incomplete sampling of the all-atom model, differences in the reaction coordinates investigated, and/or force field issues.
Lemkul and Bevan (51) additionally noted that the Aβ40 peptide could lose significant helicity during the course of their MD simulation runs depending on the proximity of the C-terminus to the membrane surface. In particular, they found that the more deeply embedded peptide retained helicity in the C-terminus, whereas it lost helicity in favor of random coil structures through interactions with the polar headgroups on the membrane surface. This is consistent with our CG model and potentials of mean force for the 70% and 30% helical Aβ42 peptides, because membrane embedding of the C-terminus requires it to be helical or it will otherwise prefer the membrane surface. Although other studies may define embedding as having any portion of the Aβ42 being below the membrane-solvent surface, our results are far more quantitative by providing the free energy at any position of the Aβ42 peptide inside or outside the lipid bilayer.
Conclusions
We have computed relative free energies for the process of release of Aβ42 to the extracellular region from an embedded position inside planar lipid bilayers that are modeled on realistic rodent SPM lipid/sterol compositions (20), and which are compared as a function of age-dependent cholesterol redistributions across the bilayer (15). We showed that the reduced concentrations of cholesterol in the exo leaflet of young neuronal cells favors membrane retention of the highly reactive N-terminus region of the Aβ peptide, whereas age-dependent increases in the cholesterol content of the exo leaflet favor secretion of the first 28 residues of Aβ42 peptide into the extracellular space. Loss of helicity in the C-terminus of the Aβ42 peptide and model membranes not including cholesterol were found to be the least favorable domains for the membrane retention of the peptide, thereby contributing to the substantial binding of Aβ42 to the exo surface of the membrane.
In summary, this work has shown that a new, to our knowledge, membrane variable—cholesterol asymmetry—has a significant influence on the free energy of release of the virulent Aβ42 species into the extracellular space. Furthermore, we emphasize that the helicity of the C-terminus of the Aβ42 peptide is critical for its retention. Our results and those generated by others show that the complexity of the lipid bilayer composition, the spatial distributions of lipids and sterol (or rafts), combined with the length, protonation states, and secondary structure of the peptide, all have influence on the stabilization of the disease peptide in the membrane. Thus, membrane influences that favor peptide unfolding at the C-terminus or extrusion of the highly reactive N-terminus into the extracellular space may result in vulnerability for aggregation, oligomerization, or deleterious oxidative reactivity. The repositioning of the amyloid peptide in the membrane as individual ages could also result in changing the position for the cleavage site of secretases that might favor the amyloidogenic pathway.
Acknowledgments
This work was supported by resources of UC Berkeley CITRIS and the National Energy Research Scientific Computing Center, which is supported by the Office of Science of the U.S. Department of Energy under contract No. DE-AC02-05CH11231.
N.L. thanks the University of Roma Tre for the scholarship in support of her Master’s thesis.
The authors declare no conflict of interest.
Supporting Material
References
- 1.Alzheimer, A. 1907. Über eine eigenartige Erkrankung der Hirnrinde [About a unique disease of the cerebral cortex]. Allgemeine Zeitschrift für Psychiatrie und psychisch-gerichtliche Medizin [General Journal of Psychiatry and psycho-forensic Medicine] 64, 146–148.
- 2.Foley P. Lipids in Alzheimer’s disease: A century-old story. Biochim. Biophys. Acta. 2010;1801:750–753. doi: 10.1016/j.bbalip.2010.05.004. [DOI] [PubMed] [Google Scholar]
- 3.Di Paolo G., Kim T.-W. Linking lipids to Alzheimer’s disease: cholesterol and beyond. Nat. Rev. Neurosci. 2011;12:284–296. doi: 10.1038/nrn3012. [DOI] [PMC free article] [PubMed] [Google Scholar]
- 4.Goedert M., Spillantini M.G. A century of Alzheimer’s disease. Science. 2006;314:777–781. doi: 10.1126/science.1132814. [DOI] [PubMed] [Google Scholar]
- 5.Arispe N., Diaz J.C., Simakova O. Abeta ion channels. Prospects for treating Alzheimer’s disease with Abeta channel blockers. Biochim. Biophys. Acta. 2007;1768:1952–1965. doi: 10.1016/j.bbamem.2007.03.014. [DOI] [PubMed] [Google Scholar]
- 6.Diaz J.C., Simakova O., Pollard H.B. Small molecule blockers of the Alzheimer Abeta calcium channel potently protect neurons from Abeta cytotoxicity. Proc. Natl. Acad. Sci. USA. 2009;106:3348–3353. doi: 10.1073/pnas.0813355106. [DOI] [PMC free article] [PubMed] [Google Scholar]
- 7.Han X. Multi-dimensional mass spectrometry-based shotgun lipidomics and the altered lipids at the mild cognitive impairment stage of Alzheimer’s disease. Biochim. Biophys. Acta. 2010;1801:774–783. doi: 10.1016/j.bbalip.2010.01.010. [DOI] [PMC free article] [PubMed] [Google Scholar]
- 8.Lagarde M., Géloën A., Spener F. Lipidomics is emerging. Biochim. Biophys. Acta. 2003;1634:61. doi: 10.1016/j.bbalip.2003.11.002. [DOI] [PubMed] [Google Scholar]
- 9.Svennerholm L., Boström K., Jungbjer B. Membrane lipids in the aging human brain. J. Neurochem. 1991;56:2051–2059. doi: 10.1111/j.1471-4159.1991.tb03466.x. [DOI] [PubMed] [Google Scholar]
- 10.Svennerholm L., Boström K., Jungbjer B. Changes in weight and compositions of major membrane components of human brain during the span of adult human life of Swedes. Acta Neuropathol. 1997;94:345–352. doi: 10.1007/s004010050717. [DOI] [PubMed] [Google Scholar]
- 11.Svennerholm L., Boström K., Olsson L. Membrane lipids of adult human brain: lipid composition of frontal and temporal lobe in subjects of age 20 to 100 years. J. Neurochem. 1994;63:1802–1811. doi: 10.1046/j.1471-4159.1994.63051802.x. [DOI] [PubMed] [Google Scholar]
- 12.Ariga T., McDonald M.P., Yu R.K. Role of ganglioside metabolism in the pathogenesis of Alzheimer’s disease—a review. J. Lipid Res. 2008;49:1157–1175. doi: 10.1194/jlr.R800007-JLR200. [DOI] [PMC free article] [PubMed] [Google Scholar]
- 13.Wood W.G., Igbavboa U., Eckert G.P. Cholesterol asymmetry in synaptic plasma membranes. J. Neurochem. 2011;116:684–689. doi: 10.1111/j.1471-4159.2010.07017.x. [DOI] [PMC free article] [PubMed] [Google Scholar]
- 14.Hayashi H., Igbavboa U., Yanagisawa K. Cholesterol is increased in the exofacial leaflet of synaptic plasma membranes of human apolipoprotein E4 knock-in mice. Neuroreport. 2002;13:383–386. doi: 10.1097/00001756-200203250-00004. [DOI] [PubMed] [Google Scholar]
- 15.Igbavboa U., Avdulov N.A., Wood W.G. Increasing age alters transbilayer fluidity and cholesterol asymmetry in synaptic plasma membranes of mice. J. Neurochem. 1996;66:1717–1725. doi: 10.1046/j.1471-4159.1996.66041717.x. [DOI] [PubMed] [Google Scholar]
- 16.Schroeder F. Role of membrane lipid asymmetry in aging. Neurobiol. Aging. 1984;5:323–333. doi: 10.1016/0197-4580(84)90010-1. [DOI] [PubMed] [Google Scholar]
- 17.Wood W.G., Schroeder F., Chochina S.V. Brain membrane cholesterol domains, aging and amyloid beta-peptides. Neurobiol. Aging. 2002;23:685–694. doi: 10.1016/s0197-4580(02)00018-0. [DOI] [PubMed] [Google Scholar]
- 18.Mason R.P., Shoemaker W.J., Herbette L.G. Evidence for changes in the Alzheimer’s disease brain cortical membrane structure mediated by cholesterol. Neurobiol. Aging. 1992;13:413–419. doi: 10.1016/0197-4580(92)90116-f. [DOI] [PubMed] [Google Scholar]
- 19.Mahley R.W., Weisgraber K.H., Huang Y. Apolipoprotein E4: a causative factor and therapeutic target in neuropathology, including Alzheimer’s disease. Proc. Natl. Acad. Sci. USA. 2006;103:5644–5651. doi: 10.1073/pnas.0600549103. [DOI] [PMC free article] [PubMed] [Google Scholar]
- 20.Cotman C., Blank M.L., Snyder F. Lipid composition of synaptic plasma membranes isolated from rat brain by zonal centrifugation. Biochemistry. 1969;8:4606–4612. doi: 10.1021/bi00839a056. [DOI] [PubMed] [Google Scholar]
- 21.Russ W.P., Engelman D.M. The GxxxG motif: a framework for transmembrane helix-helix association. J. Mol. Biol. 2000;296:911–919. doi: 10.1006/jmbi.1999.3489. [DOI] [PubMed] [Google Scholar]
- 22.Marrink S.J., Tieleman D.P. Perspective on the Martini model. Chem. Soc. Rev. 2013 doi: 10.1039/c3cs60093a. in press. [DOI] [PubMed] [Google Scholar]
- 23.Spoel, D. V. D., E. Lindahl, …, H. J. C. Berendsen. 2010. Gromacs User Manual version 4.5.4. http://www.gromacs.org. Accessed: July 19, 2013.
- 24.Esteban-Martín S., Risselada H.J., Marrink S.J. Stability of asymmetric lipid bilayers assessed by molecular dynamics simulations. J. Am. Chem. Soc. 2009;131:15194–15202. doi: 10.1021/ja904450t. [DOI] [PubMed] [Google Scholar]
- 25.Crescenzi O., Tomaselli S., Picone D. Solution structure of the Alzheimer amyloid beta-peptide (1-42) in an apolar microenvironment. Similarity with a virus fusion domain. Eur. J. Biochem. 2002;269:5642–5648. doi: 10.1046/j.1432-1033.2002.03271.x. [DOI] [PubMed] [Google Scholar]
- 26.Kabsch W., Sander C. Dictionary of protein secondary structure: pattern recognition of hydrogen-bonded and geometrical features. Biopolymers. 1983;22:2577–2637. doi: 10.1002/bip.360221211. [DOI] [PubMed] [Google Scholar]
- 27.Tomaselli S., Esposito V., Picone D. The α-to-β conformational transition of Alzheimer’s Abeta-(1-42) peptide in aqueous media is reversible: a step by step conformational analysis suggests the location of β conformation seeding. ChemBioChem. 2006;7:257–267. doi: 10.1002/cbic.200500223. [DOI] [PubMed] [Google Scholar]
- 28.Martínez L., Andrade R., Martínez J.M. PACKMOL: a package for building initial configurations for molecular dynamics simulations. J. Comput. Chem. 2009;30:2157–2164. doi: 10.1002/jcc.21224. [DOI] [PubMed] [Google Scholar]
- 29.Bussi G., Donadio D., Parrinello M. Canonical sampling through velocity rescaling. J. Chem. Phys. 2007;126:014101. doi: 10.1063/1.2408420. [DOI] [PubMed] [Google Scholar]
- 30.Berendsen H.J.C., Postma J.P.M., Haak J.R. Molecular dynamics with coupling to an external bath. J. Chem. Phys. 1984;81:3684–3690. [Google Scholar]
- 31.Hess B., Bekker H., Fraaije J. LINCS: a linear constraint solver for molecular simulations. J. Comput. Chem. 1997;18:1463–1472. doi: 10.1021/ct700200b. [DOI] [PubMed] [Google Scholar]
- 32.Lemkul J.A., Bevan D.R. Assessing the stability of Alzheimer’s amyloid protofibrils using molecular dynamics. J. Phys. Chem. B. 2010;114:1652–1660. doi: 10.1021/jp9110794. [DOI] [PubMed] [Google Scholar]
- 33.Nose S.A. Molecular dynamics method for simulations in the canonical ensemble. Mol. Phys. 1984;52:255–268. [Google Scholar]
- 34.Hoover W.G. Canonical dynamics: Equilibrium phase-space distributions. Phys. Rev. A. 1985;31:1695–1697. doi: 10.1103/physreva.31.1695. [DOI] [PubMed] [Google Scholar]
- 35.Parrinello M., Rahman A. Polymorphic transitions in single crystals: a new molecular dynamics method. J. Appl. Phys. 1981;52:7182–7190. [Google Scholar]
- 36.Nose S., Klein M.L. Constant pressure molecular dynamics for molecular systems. Mol. Phys. 1983;50:1055–1076. [Google Scholar]
- 37.Hub J.S., Groot B.L.D., Spoel D.V.D. g_wham. A free weighted histogram analysis implementation including robust error and autocorrelation estimates. J. Chem. Theory Comput. 2010;6:3713–3720. [Google Scholar]
- 38.Ashley R.H., Harroun T.A., Bradshaw J.P. Autoinsertion of soluble oligomers of Alzheimer’s Abeta(1-42) peptide into cholesterol-containing membranes is accompanied by relocation of the sterol towards the bilayer surface. BMC Struct. Biol. 2006;6:21. doi: 10.1186/1472-6807-6-21. [DOI] [PMC free article] [PubMed] [Google Scholar]
- 39.Mason R.P., Estermyer J.D., Mason P.E. Alzheimer’s disease amyloid beta peptide 25-35 is localized in the membrane hydrocarbon core: x-ray diffraction analysis. Biochem. Biophys. Res. Commun. 1996;222:78–82. doi: 10.1006/bbrc.1996.0699. [DOI] [PubMed] [Google Scholar]
- 40.Dante S., Hauss T., Dencher N.A. Membrane fusogenic activity of the Alzheimer’s peptide A beta(1-42) demonstrated by small-angle neutron scattering. J. Mol. Biol. 2008;376:393–404. doi: 10.1016/j.jmb.2007.11.076. [DOI] [PubMed] [Google Scholar]
- 41.Mason R.P., Jacob R.F., Wood W.G. Distribution and fluidizing action of soluble and aggregated amyloid beta-peptide in rat synaptic plasma membranes. J. Biol. Chem. 1999;274:18801–18807. doi: 10.1074/jbc.274.26.18801. [DOI] [PubMed] [Google Scholar]
- 42.Pahnke J., Walker L.C., Krohn M. Alzheimer’s disease and blood-brain barrier function-Why have anti-beta-amyloid therapies failed to prevent dementia progression? Neurosci. Biobehav. Rev. 2009;33:1099–1108. doi: 10.1016/j.neubiorev.2009.05.006. [DOI] [PMC free article] [PubMed] [Google Scholar]
- 43.Almeida P.F.F., Vaz W.L.C., Thompson T.E. Lipid diffusion, free area, and molecular dynamics simulations. Biophys. J. 2005;88:4434–4438. doi: 10.1529/biophysj.105.059766. [DOI] [PMC free article] [PubMed] [Google Scholar]
- 44.Buchsteiner A., Hauss T., Dencher N.A. Alzheimer’s disease amyloid-beta peptide analogue alters the ps-dynamics of phospholipid membranes. Biochim. Biophys. Acta. 2010;1798:1969–1976. doi: 10.1016/j.bbamem.2010.06.024. [DOI] [PubMed] [Google Scholar]
- 45.Yu X., Zheng J. Cholesterol promotes the interaction of Alzheimer β-amyloid monomer with lipid bilayer. J. Mol. Biol. 2012;421:561–571. doi: 10.1016/j.jmb.2011.11.006. [DOI] [PubMed] [Google Scholar]
- 46.Ji S.-R., Wu Y., Sui S.-F. Cholesterol is an important factor affecting the membrane insertion of beta-amyloid peptide (A beta 1-40), which may potentially inhibit the fibril formation. J. Biol. Chem. 2002;277:6273–6279. doi: 10.1074/jbc.M104146200. [DOI] [PubMed] [Google Scholar]
- 47.Micelli S., Meleleo D., Gallucci E. Effect of sterols on beta-amyloid peptide (AbetaP 1-40) channel formation and their properties in planar lipid membranes. Biophys. J. 2004;86:2231–2237. doi: 10.1016/S0006-3495(04)74281-2. [DOI] [PMC free article] [PubMed] [Google Scholar]
- 48.Beel A.J., Mobley C.K., Sanders C.R. Structural studies of the transmembrane C-terminal domain of the amyloid precursor protein (APP): does APP function as a cholesterol sensor? Biochemistry. 2008;47:9428–9446. doi: 10.1021/bi800993c. [DOI] [PMC free article] [PubMed] [Google Scholar]
- 49.Dante S., Hauss T., Dencher N.A. Cholesterol inhibits the insertion of the Alzheimer’s peptide Abeta(25-35) in lipid bilayers. Eur. Biophys. J. 2006;35:523–531. doi: 10.1007/s00249-006-0062-x. [DOI] [PubMed] [Google Scholar]
- 50.D’Errico G., Vitiello G., D’Ursi A.M. Interaction between Alzheimer’s Abeta(25-35) peptide and phospholipid bilayers: the role of cholesterol. Biochim. Biophys. Acta. 2008;1778:2710–2716. doi: 10.1016/j.bbamem.2008.07.014. [DOI] [PubMed] [Google Scholar]
- 51.Lemkul J.A., Bevan D.R. Lipid composition influences the release of Alzheimer’s amyloid β-peptide from membranes. Protein Sci. 2011;20:1530–1545. doi: 10.1002/pro.678. [DOI] [PMC free article] [PubMed] [Google Scholar]
Associated Data
This section collects any data citations, data availability statements, or supplementary materials included in this article.