

Abstract
In primates, the sense of touch has traditionally been considered to be a spatial modality, drawing an analogy to the visual system. In this view, stimuli are encoded in spatial patterns of activity over the sheet of receptors embedded in the skin. We propose that the spatial processing mode is complemented by a temporal one. Indeed, the transduction and processing of complex, high-frequency skin vibrations have been shown to play an important role in tactile texture perception, and the frequency composition of vibrations shapes the evoked percept. Mechanoreceptive afferents innervating the glabrous skin exhibit temporal patterning in their responses, but the importance and behavioral relevance of spike timing, particularly for naturalistic stimuli, remains to be elucidated. Based on neurophysiological recordings from Rhesus macaques, we show that spike timing conveys information about the frequency composition of skin vibrations, both for individual afferents and for afferent populations, and that the temporal fidelity varies across afferent class. Furthermore, the perception of skin vibrations, measured in human subjects, is better predicted when spike timing is taken into account, and the resolution that predicts perception best matches the optimal resolution of the respective afferent classes. In light of these results, the peripheral representation of complex skin vibrations draws a powerful analogy with the auditory and vibrissal systems.
Introduction
Mechanoreceptive afferents innervating the glabrous skin of the primate hand produce highly repeatable and exquisitely temporally patterned responses to mechanical oscillations of the skin (Fig. 1; Talbot et al., 1968; Freeman and Johnson, 1982; Muniak et al., 2007). This temporal patterning is thought to convey information about the spectral content of skin vibrations. Indeed, for sinusoids in the flutter range (<50 Hz), the modal interspike interval reflects the period of the stimulus and mediates the ability to discriminate frequency (Talbot et al., 1968). In this view, information about spectral content is conveyed in the temporal patterning of the afferent response while information about intensity is conveyed in the strength of the response (Muniak et al., 2007). The types of vibrations encountered in everyday tactile experience, for example during texture exploration, tend to be complex rather than sinusoidal and contain components in the high-frequency range (Bensmaia and Hollins, 2005). Whether spike timing plays a role in the perception of such spectrally complex and high-frequency (>100 Hz) stimuli is currently unknown.
Figure 1.
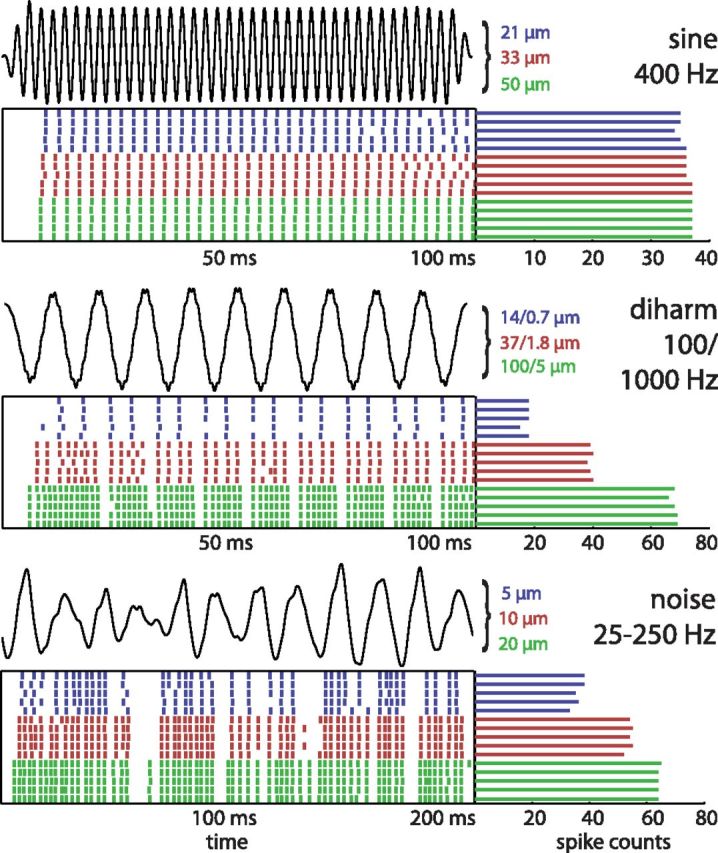
Responses of a PC afferent to sinusoidal, diharmonic and bandpass noise stimuli. In each of the three panels, the top trace shows the time-varying position of the vibratory stimulus (with the three amplitudes marked to the right: for the diharmonic stimuli, the amplitudes of the low and frequency component are indicated; for the noise stimulus, the rms amplitude is indicated). The raster plots show the responses of a PC afferent to 5 repeated presentations of the stimulus at the three stimulus amplitudes. The bars to the right indicate the spike counts evoked on each stimulus presentation. For clarity, only the first 200 ms are shown for the noise stimulus. While spike counts tend to change with stimulus amplitude, temporal patterning in the afferent response is more consistent across amplitudes. Note that afferent responses to sinusoids are relatively consistent in both their strength and patterning across stimulus intensities, highlighting the fact that these are less suitable to disentangle the respective contributions of spike timing and spike rate to neural coding.
Previous work has shown that information about tactile stimuli is contained in precise spike timing of cutaneous mechanoreceptive afferents in primates. For instance, first spike latency of afferent responses conveys more information about the curvature of an object and the force it exerts on the skin than does firing rate (Johansson and Birznieks, 2004; Saal et al., 2009). However, even though spike timing, in some cases, transmits more information about the stimulus than does spike rate, there is no guarantee that this information is used in downstream processing. To show that a putative neural code is behaviorally relevant, it must be linked to behavior (Arabzadeh et al., 2006; Jacobs et al., 2009; Panzeri et al., 2010). In an elegant example of this idea, Salinas et al. (2000) showed that while both spike timing and spike rate in primary somatosensory cortex convey information about stimulus frequency in the flutter range, the acuity of a rate-based code is more commensurate with perceptual acuity than is that of a temporal code.
In the present study, we first assess the temporal resolution at which information about the spectral content of skin vibrations is optimally transmitted in the responses of each type of mechanoreceptive afferent. Specifically, we determine (1) whether vibrations can be classified by frequency content based on the responses they evoke in single afferents or in populations of afferents and (2) the extent to which classification performance depends on the temporal resolution at which responses are decoded. We focus specifically on simple and complex vibrations with components in the high-frequency range, as these have not received as much empirical attention as their low-frequency counterparts despite their ubiquity in natural tactile experience (Manfredi et al., 2011). Second, in psychophysical experiments, we seek to determine the temporal resolution that best predicts how these complex vibrations are perceived. Third, comparing the results of our classification analyses on neuronal data with our perceptual analysis, we establish whether afferent signals are decoded at their optimal temporal resolution.
Materials and Methods
Apparatus.
Two different stimulators were used to deliver well controlled vibratory stimuli. High-frequency stimuli (>100 Hz) were delivered with a Mini-Shaker (Type 4810; Bruel and Kjaer) driven by a power amplifier (Type 2706; Bruel and Kjaer). Low-frequency vibrations were delivered via a custom-made Chubbuck motor (Chubbuck, 1966), driven by a servo-controlled amplifier and equipped with a high-precision linear variable displacement transducer with micrometer resolution. The input voltage to both amplifiers, under computer control, was generated using a digital-to-analog card (PCI 6229; output rate 20 kHz; National Instruments).
The Chubbuck displacement sensor was calibrated using an Optodyne laser interferometer (Optodyne LDS 100), capable of measuring absolute displacement to sub-micrometer resolution. The actual position, as measured by the interferometer, was regressed onto the output of the position sensor. Mini-Shaker movements were monitored using an accelerometer (Type 8702B50M1; Kistler Instrument Corporation) with a dynamic range of ±50 × g. The threaded stud on the top of the accelerometer was mounted directly to the Mini-Shaker motor, and the stud of the stylus was attached to the bottom of the accelerometer. The contactor consisted of a steel-tipped stylus fixed to the table of the Chubbuck, and the threaded bottom of the accelerometer on the Mini-Shaker. The stylus was 175 mm long, with a radius of 12.5 mm, and a weight of 12.5 g, and was machined out of Carbon Afferent and Ultem (GE), a light-weight and rigid polyimide thermoplastic resin. The stylus was outfitted with a steel tip, embedded into the hollow shaft, and secured with a setscrew. The steel tip was flat and had a diameter of 1 mm (Freeman and Johnson, 1982; Muniak et al., 2007).
Stimuli.
Stimuli were selected to span the range of everyday tactile experience. Stimuli varied widely in their frequency content and amplitude and included sinusoidal, diharmonic, and bandpass noise stimuli. In total, we presented sinusoids at 11 different frequencies, noise stimuli with 12 different bandpasses, and diharmonic stimuli consisting of 13 different pairs of frequencies. Diharmonic stimuli were included because they are of intermediate spectral complexity. The range of stimulus amplitudes varied as a function of frequency to reflect the fact that we tend to experience higher amplitude vibrations at low frequencies than at high frequencies. Furthermore, sensitivity to vibration is highly frequency dependent: thresholds are 100-fold lower at 300 Hz than at 10 Hz (Bolanowski et al., 1988; Muniak et al., 2007).
Sinusoids were presented at 11 frequencies (50, 100, 150, 200, 250, 300, 400, 500, 600, 800, and 1000 Hz), and three amplitudes each. The maximum amplitudes were constrained by limits imposed by the motors: At 50 Hz, amplitudes were 114, 169, and 250 μm (zero-to peak); at 250 Hz, they were 27, 45, and 75 μm; at 500 Hz, 11, 17, and 25 μm; and at 1000 Hz, 3, 4.5, and 6 μm. The stimulus duration was 0.1 s for all conditions.
Diharmonic stimuli were specified using the following expression:
where A1 and A2 are the amplitudes of the low- and high-frequency components, respectively, ω1 and ω2 are the two frequencies (ω1 < ω2) and ϕ is the phase of the high-frequency component relative to that of the low-frequency component. Thirteen different frequency pairs were included: 50/100, 50/150, 50/250, 50/500, 50/1000, 100/200, 100/300, 100/500, 100/1000, 200/400, 200/600, 200/1000, and 400/800 Hz. Each frequency pair was presented at three different amplitudes; amplitudes were 16, 44, and 125 μm for 50 Hz components; 14, 37, and 100 μm for 100 Hz components; 6, 15, and 38 μm for 250 Hz components; 2, 6, and 19 μm for 500 Hz components; and 0.7, 1.8 and 5 μm for 1000 Hz components. The phase difference between both frequency components was set to 0. The stimulus duration was 0.1 s for all stimuli.
Bandpass noise stimuli were generated by first creating wide-band noise, then bandpass filtering it to the specified frequency range, i.e., each noise stimulus was created from the same master noise trace. A total of 12 frequency ranges were included: 5–10, 5–25, 5–50, 5–100, 25–50, 25–125, 25–250, 25–500, 50–100, 50–250, 50–500, and 50–1000 Hz. Each noise stimulus was then scaled to a set of three predetermined root-mean-squared (rms) amplitudes. These were 5, 10, and 50 μm if the lower frequency cutoff was 5 Hz; 5, 10, and 20 μm for 25 Hz; and 1, 5, and 10 μm for a cutoff of 50 Hz. The duration of all noise stimuli was 1 s.
Each stimulus was preceded and followed by a period of no stimulation to limit the effects of vibratory adaptation (Bensmaia et al., 2005; Leung et al., 2005) and to allow us to establish the spontaneous firing rates of each afferent (which were typically near zero). The interstimulus interval was 100 ms for sinusoidal and diharmonic stimuli and 1 s for noise stimuli. Five repetitions of each stimulus per amplitude level were delivered. Amplitude ranges were chosen so as to include the range over which the three afferent populations reliably responded to stimulation, to the extent possible (based on data shown by Muniak et al., 2007).
Neurophysiology.
The neurophysiological experiments were performed at Johns Hopkins University, Baltimore, MD and complied with the guidelines of the Johns Hopkins University Animal Care and Use Committee and the National Institutes of Health Guide for the Care and Use of Laboratory animals. We recorded the responses of eight slowly adapting type I (SA1), 14 rapidly adapting (RA), and five Pacinian (PC) afferents, though not every afferent was included in all of the conditions. For the sinusoidal and diharmonic datasets, recordings from 8 SA1, 10 RA, and 5 PC afferents were available. For the bandpass noise stimuli, data from 6 SA1, 9 RA, and 4 PC afferents were available.
The neurophysiological methods are described in detail in a previous paper (Muniak et al., 2007) and are summarized here. Single-unit recordings were made from the ulnar and median nerves of two anesthetized male macaque monkeys (Macaca mulatta) using standard methods (Talbot et al., 1968). Standard procedures were used to classify mechanoreceptive afferents according to their responses to step indentations and vibratory stimulation (Talbot et al., 1968; Freeman and Johnson, 1982). An afferent was classified as SA1 if it produced sustained firing in response to a step indentation. It was classified as RA if it had a small receptive field (RF) and responded only to the onset and offset of an indentation. It was classified as PC if (1) it was vigorously activated by air gently blown over the hand; (2) it was activated by transmitted vibrations produced by tapping on the hand restraint; and (3) its receptive field was large. The point of maximum sensitivity of the afferent (or hotspot) was located on the skin using a handheld probe and then marked with a felt-point pen. The stimulator probe was centered on the hotspot of the afferent to the extent possible (PC RFs do not have clear hotspots). The tip of the probe was fixed with cyanoacrylate glue to the skin at its resting position, i.e., with no pre-indentation.
Psychophysics.
Psychophysical experiments were performed at the University of Chicago. All testing procedures were performed in compliance with the policies and procedures of the Institutional Review Board for Human Use of the University of Chicago. Data were collected from 5 subjects (3 males, 2 females) ranging in age from 18 to 21. All subjects were paid for their participation, and reported normal tactile and auditory sensitivity and no history of neurological disease.
Subjects wore earphones playing pink noise inside of earmuffs to eliminate auditory cues. Before each experimental block, the stimulus probe was lowered until it just contacted the skin. Each trial was preceded and followed by a 1 s period of no stimulation to limit the effects of vibratory adaptation (Bensmaia et al., 2005; Leung et al., 2005).
On each trial, two vibratory stimuli (listed in Table 1) were presented, for one second each, with 0.2 s between the stimuli. The subject produced estimates of the perceived dissimilarity of those stimuli on a ratio scale: If the stimuli felt identical, the subject was to assign the number 0 to the pair. In a given experimental block, the first rating was arbitrary (unless the stimuli felt identical). The subjects were instructed to produce a number twice as large if the next stimuli felt twice as dissimilar or a number one-half as large if the stimuli felt one-half as dissimilar. They were encouraged to use decimals or fractions if they deemed it necessary. Before the first experimental block, subjects rated a subset of pairs for practice. The practice block was followed by five experimental blocks in which archival data were collected. Psychophysical ratings were normalized by the mean rating obtained in each experimental block, then averaged across blocks and subjects. All pairwise combinations of the vibratory stimuli used in the magnitude scaling experiment were presented in pseudorandom order.
Table 1.
List of stimuli included in the psychophysical study
| Stimulus type | Frequency (Hz) | Amplitude (μm) |
|---|---|---|
| Sine | 100 | 150 |
| Diharmonic | 100 1000 | 100 5 |
| Diharmonic | 100 300 | 100 25 |
| Diharmonic | 50 500 | 125 18.75 |
| Triharmonic | 100 300 500 | 80 20 20 |
Subjects rated the perceived dissimilarity between pairs of stimuli.
Single-afferent analysis.
We used a spike distance, Dspike[q], as a parametric measure of the dissimilarity between two spike trains (Victor and Purpura, 1997). This spike distance ascribes the cost of transforming one spike train into the other by using two elementary operations. Spikes can be added or deleted at a cost of one, and spikes can be shifted in time at a cost that is proportional to the amount that they are shifted (a cost of q per second). By changing the parameter q, we can control the temporal asynchrony between two spikes at which it becomes cheaper to delete and reinsert a spike rather than to move it. This parameter thus corresponds to the inverse of a neuron's temporal resolution in seconds. Thus, q = 500 corresponds to a temporal sensitivity of 2 ms, while q = 0 indicates a rate code, with no penalty to move spikes.
Metric space analysis involves first characterizing the dissimilarity of pairs of spike trains using spike distance, Dspike[q] (Victor and Purpura, 1996). Then, for each spike train T, we determine which stimulus category evoked spike trains whose average distance from T was smallest, where stimulus categories are defined on the basis of frequency content. We then measured the proportion of times the stimulus category into which a given spike train was categorized corresponded to the stimulus category that actually evoked it. In other words, what proportion of times is a spike train more similar to other spike trains evoked by stimuli with the same frequency composition (but varying in amplitude) than it is to spike trains evoked by stimuli with a different frequency composition? We measured classification performance for a range of q values.
To examine the extent to which information about spectral composition is conveyed independently of stimulus intensity, we included stimuli at a range of amplitudes for each frequency composition. We wished to assess whether stimuli that varied widely in amplitude would still be categorized together if they had the same frequency composition. In other words, does one aspect of the afferent response remain relatively invariant across changes in amplitude to convey information about frequency composition? To ensure that our results were not an artifact of our stimulus selection, we examined the effect of manipulating the amplitude ranges on classification performance and optimal temporal resolution. We found that, as long as multiple amplitudes were included in each category, the optimal temporal resolution, i.e., the location of the peak of each individual classification curve (such as those shown in Fig. 2), remained consistent. We conclude that our results are not an artifact of our choice of stimulus intensities.
Figure 2.

Performance of classification algorithms. Stimulus-dependent clustering performance, based on spike distance, as a function of the temporal resolution (ranging from submillisecond to a rate code), obtained from afferent responses to sine, diharmonic, and bandpass noise stimuli. Error bars indicate SEM. RA and PC fibers both convey frequency information at a fine temporal resolution. When the resolution is too low, classification is poor because informative differences in spike timing are ignored; when the resolution is too high, classification deteriorates due to spiking noise.
Note that we obtained almost identical classification performance when aligning spike trains with each other to minimize spike distance as we did aligning spike trains with stimulus onset. Thus, relative and absolute spike timing are both viable coding schemes for spectral information.
Population analysis.
To extend our analysis from single afferents to afferent populations, we computed the spike distance from the responses of each afferent to each pair of stimuli. We then averaged the spike distances for each stimulus pair over all neurons and performed the classification based on these average distances (see the “labeled line” code in the article by Aronov et al., 2003).
To account for the possibility that the three afferent classes contribute differentially to classification performance and to normalize for differences in firing rate across afferent types, we assigned weights to the average spike distances from each afferent class and optimized these weights with respect to classification accuracy by finding the weights that yielded the best performance.
To test the extent to which stimuli could be discriminated on the basis of the relative levels of activation of the three afferent populations, we first averaged the spike counts evoked in each afferent population during each presentation of each stimulus. The response of the population to each presentation of the stimulus could then be represented as a point in three dimensional space, each dimension defined by the mean firing rate of one afferent population. We then calculated the Euclidean distance between each pair of neuronal responses. Each response was placed into the group to which it was nearest in this Euclidean space (using an approach analogous to that described above). Again, distances were weighted by afferent class to maximize classification accuracy.
Predicting perceived dissimilarity.
To demonstrate the biological relevance of a coding scheme, it must be connected to behavior (Panzeri et al., 2010). The basic law of psychophysics stipulates that a linear relationship should exist between a percept and its neural correlate (Johnson et al., 2002). Thus, the perceived dissimilarity of two vibratory stimuli should be linearly related to some difference in the neural activity evoked by those stimuli. We used the same measure of spike distance Dspike[q] as described above to quantify neural dissimilarity because it allowed us to parametrically vary the temporal resolution at which differences in spike timing are perceptually relevant. We varied the resolution from extremely fine (0.2 ms temporal resolution) to coarse (rate code) and we fit the following model for each value of qRA, and qPC:
 |
where Ŷ(s1,s2) is the perceived dissimilarity of stimuli s1 and s2, DnRA(s1,s2|qRA) and DmPC(s1,s2|qPC) are the spike distances between the responses of individual RA and PC afferents, respectively, to stimuli s1 and s2, for temporal resolutions defined by qRA and qPC; βRA and βPC are the slope coefficients for RA and PC afferents, respectively; and α is the intercept term. The upper bounds of the summation, N and M, represent the number of afferents of each type. Our objective was to find the values of βRA, βPC, α, qRA, and qPC that minimize (Y − Ŷ)2, where Y is the perceived dissimilarity measured in the psychophysical experiment, averaged over participants. We used a nonlinear curve fitting algorithm, lsqcurvefit (MATLAB, MathWorks), to optimize the values of all 5 parameters simultaneously. The optimization algorithm was run 100 times to exclude spurious results due to local optima. Note that for each value of qRA and qPC, our model reduces to multiple linear regression; that is, the estimated dissimilarity is a linear function of the average spike distance of the responses evoked in RA and PC afferents. We compare the coefficient of variation (R2) between the optimal temporal resolution with that achieved by a rate code (qRA = qPC = 0). In total, 14 RA afferents and 5 PC afferents were included in this analysis. SA1 fibers were not included because they did not respond reliably to the selected stimulus set. We tested the degree to which nonlinear combinations of mean spike distance could predict perceived dissimilarity and found that they were outperformed by the simple linear relationship shown in Equation 2.
Results
Temporal resolution of single tactile afferents
At what temporal resolution do peripheral afferents encode information about the spectral content of complex skin vibrations? One way to address this question is to assess how well stimuli can be classified based on the responses they evoke in afferents. We can express spike trains with different temporal precisions and determine what temporal precision yields the highest classification performance. Decoding the afferent response at finer temporal resolutions will take into account minute differences that are irrelevant to stimulus coding, while decoding at coarser temporal resolutions will wash out crucial differences in spike timing.
Stimuli were chosen to span the breadth of vibrations elicited in the skin during natural tactile exploration (Manfredi et al., 2011). Specifically, we varied the complexity of these stimuli, ranging from simple (sinusoids) to complex (bandpass noise) to mimic the varying complexity of texture-elicited vibrations (Bensmaia and Hollins, 2005; Manfredi et al., 2011).
We wished to identify the neural basis for our ability to discern the frequency composition of skin vibrations, independently of intensity. Indeed, while changes in stimulus amplitude affect perceived intensity (Talbot et al., 1968; Johnson, 1974; Muniak et al., 2007), they have little effect on perceived frequency content over a range of amplitudes (Hernández et al., 1997; Roy and Hollins, 1998; Yau et al., 2009). Thus, while the strength of the population response increases with stimulus amplitude (Johnson, 1974; Muniak et al., 2007), some aspect of the peripheral neural response must be preserved to convey information about spectral content (Fig. 1). With this in mind, we used a range of amplitudes for each frequency combination, and assessed the extent to which stimuli that had identical spectral content but different amplitudes were correctly classified as belonging together.
First, we found that classification performance differed across afferent types. PC afferents conveyed the most information about the frequency content of the vibrations, SA1 fibers conveyed the least, and RA afferents yielded intermediate classification performance. For example, we were able to correctly classify, on average (at their optimal temporal resolution), >60% of diharmonic stimuli based on the responses of single PC fibers, whereas classification performance based on individual RA and SA1 responses was <40% and 25%, respectively (Fig. 2, middle). Similar results were obtained from afferent responses to sinusoidal and bandpass noise stimuli (Fig. 2). Second, we found that classification performance was substantially improved when spike timing was taken into account than when it was not (Fig. 3A). The improved performance at the optimal resolution (relative to a rate-based code) was most pronounced for the PC, least for SA1, and intermediate for RA fibers. The effects of both afferent type and stimulus type on accuracy gain were significant (unbalanced two-way ANOVA, F(2,60) = 47.82 and 9.65 for afferent and stimulus type, respectively; p < 0.01). Post hoc t tests (with Bonferroni correction) revealed that accuracy gains were significantly different across all pairs of afferent types. Third, the optimal temporal resolutions also differed across afferent classes: While timing on the order of a single millisecond improved classification based on PC responses, the optimal resolution was 2–6 ms for RA, and coarser for SA1 afferents (Fig. 3B). An unbalanced two-way ANOVA revealed a significant effect of afferent type (F(2,60) = 12.97; p < 0.01) but not of stimulus type on resolution (F(2,60) = 2.64; p = 0.08). Post hoc t tests (with Bonferroni correction) revealed that the optimal temporal resolutions of both RA and PC were significantly different (p < 0.01) from that of SA1 afferents, but not from each other. In summary, PC fibers convey more information about frequency composition and do so at a finer temporal resolution than do RA and SA1 afferents. The spectral information is lowest and the temporal resolution is most coarse for SA1, and intermediate for RA fibers.
Figure 3.

Spike timing in single afferents. A, Accuracy gain over a rate code in percentage points (δP) at the optimal resolution, indicated in B, for the three different afferent classes (mean and SEM across single afferents).
That individual PC fibers carry more information about high stimulus frequencies than do individual SA1 and RA fibers (as evidenced by the higher classification performance based on PC responses) is not surprising given their different sensitivities: SA1 afferents are most responsive to static indentations or low-frequency vibratory stimulation (<20 Hz); PC afferents are highly sensitive to high-frequency vibrations (peaking in sensitivity ∼250–300 Hz), while RA afferents are sensitive at intermediate frequencies. Indeed, for some of the higher frequencies tested, SA1 and RA afferents produced very weak responses or did not respond at all. Nonetheless, to the extent that RA and SA1 fibers did respond, the timing of their responses conveyed information about stimulus frequency, albeit at a lower temporal resolution than for PC fibers.
Temporal resolution of population responses
Next, we extended our analysis to populations of afferents. First, we analyzed the stimulus information conveyed in the responses of the SA1, RA, and PC afferent populations independently. To this end, we repeated the metric space analysis described above, but rather than using the spike distances obtained from the responses of individual afferents to categorize stimuli, we used the mean distance for each class of afferents. Confirming results from our analysis with single afferents, we found that (1) classification accuracy was best for PC and worst for SA1 responses (Fig. 4A); (2) accuracy improved when spike timing was taken into account for all three afferent classes; (3) the optimal resolution was highest for PC and lowest for SA1 afferents and optimal resolutions for populations were similar to those for individual afferents.
Figure 4.

Population classification results. A, Population classification accuracy for the three afferent classes at their respective optimal temporal resolutions. B, Population classification accuracy based on individual and combined afferent responses to diharmonic stimuli. Performance with PC responses alone is better than or comparable to performance with any other combination of afferents.
Next, we investigated how much information about spectral composition was conveyed by the entire afferent population, including all three classes of fibers. This analysis allows us to assess whether the different classes convey complementary stimulus information. That is, to the extent that information about frequency composition is redundant across classes, classification performance based on PC responses alone will be as good or better as that with any combination of fibers. To combine spiking information from the three afferent populations, we introduced weight parameters that scaled the mean spike distances for each afferent class independently. These parameters were optimized to yield the best possible classification performance. We found that PC responses carried virtually all of the available stimulus information; indeed, including SA1 and/or RA responses into the classification analysis only marginally improved performance (Fig. 4B). In this analysis, spike timing was crucial for PC fibers, but SA1 and RA responses were redundant whether or not spike timing was taken into consideration.
Finally, we tested the hypothesis that frequency composition is encoded in the relative activation levels of the three afferent populations, following a mechanism akin to that mediating color perception. Specifically, we classified vibrations based on differences in mean firing rates evoked across the three afferent populations. Classification performance was good for sinusoids (78% accuracy), confirming results from a prior psychophysical study (Roy and Hollins, 1998), but considerably worse for diharmonic (33%) and bandpass noise stimuli (50%). Thus, spike patterning is important to discriminate stimuli that comprise more than one frequency component. For example, a 150 Hz sinusoidal stimulus and a diharmonic stimulus containing 100 and 200 Hz components are not discriminable based on population spike counts, but are easily discriminable based on interspike interval distributions (Fig. 5).
Figure 5.

Example of two stimuli that are distinguishable only if spike timing is taken into consideration. Light markers, 150 Hz sinusoid; dark markers, 100/200 Hz diharmonic. Left, Average firing rates for both stimuli shown for the SA1, RA and PC afferent populations. Right, Average ISI histograms for the RA and PC populations. Bin sizes were 5 ms for the RA and 2 ms for the PC populations. Only the first three bins are shown for either histogram. Error bars indicate SD. Note that these two stimuli are perceptually distinguishable (data not shown).
Predicting psychophysical responses from neural data
Using single-afferent and population-level stimulus-dependent clustering, we established that spike timing at millisecond resolution conveys information about the spectral content of vibrations. However, the fact that information is available does not guarantee that it is used. To show that a coding scheme is biologically relevant, it must be linked to behavior (Perkel and Bullock, 1969; Uttal, 1969; LaMotte and Mountcastle, 1975; Cariani and Delgutte, 1996; Eggermont, 2001; Luna et al., 2005). Accordingly, we tested the extent to which neural codes at different temporal resolutions could account for perception. Specifically, human subjects judged the dissimilarity of pairs of vibrations using a free dissimilarity scaling paradigm. In these psychophysical experiments, stimuli consisted of a subset of the sinusoidal and diharmonic stimuli used in the neurophysiological experiments. Stimuli were chosen from two clusters within which responses evoked in each afferent population were approximately equivalent across stimuli. Because perceived intensity is determined by the firing rate of populations of afferents (Muniak et al., 2007), we sought to ensure that perceived dissimilarity would not be dominated by differences in perceived magnitude. We wished to assess the extent to which the dissimilarity between the spiking responses evoked by each pair of stimuli, computed at different temporal resolutions, could account for their perceived dissimilarity. The quantitative prediction of human perception based on neuronal responses measured in Rhesus macaques is validated by previous studies showing that vibratory perception in humans is indistinguishable from that in macaques (Mountcastle et al., 1972, 1990; LaMotte and Mountcastle, 1975; Hernández et al., 1997).
As a gauge of dissimilarity between spike trains, we again computed the spike distance between the responses evoked in each afferent by each pair of stimuli used in the dissimilarity estimation protocol at different temporal resolutions. Having obtained a measure of the dissimilarity between each pair of spike trains for each afferent at each temporal resolution, we then assessed whether spike distance could linearly predict perceived dissimilarity (Johnson et al., 2002) using a multiple regression design, with one slope parameter per afferent type. SA1 afferents were excluded from this analysis as their responses to the subset of stimuli used were near zero.
We found that the temporal resolution that best predicted perceived dissimilarity was 4 ms for RA and 0.5 ms for PC afferents (Fig. 6). At these resolutions, our (small) population of RA and PC afferents could account for 94% of the variance in the dissimilarity ratings (standardized coefficients βRA and βPC were 0.55 and 0.72, respectively). In contrast, a rate-based code accounted for 5% of the variance in the psychophysical data (with βRA and βPC = 0.12). Not surprisingly, predictions based on the timing-based code were significantly better than those from the rate code (F(9,9) = 15.71, p < 0.01). Thus, not only does precise spike timing convey information (as shown in our metric space analyses), but it seems to shape the evoked tactile percept. While our results do not reveal a direct causal link, they suggest that RA and PC signals are decoded at their optimal resolutions.
Figure 6.

Relating neural responses to psychophysical judgments. A, Proportion of variance in psychophysical data explained by neural dissimilarity model. The model performs considerably worse at coarse temporal resolutions than at fine resolutions. Perceived dissimilarity was most accurately predicted when spike timing was taken into consideration, with optimal resolutions at ∼4 ms for RA and 0.5 ms for PC afferents. Note that performance was near optimal over a range of resolutions that overlapped largely with those found in the analyses described in Figure 3. B, Perceived versus predicted dissimilarities for a rate code (blue) and at the optimal temporal resolution (red). The temporal mechanism accounts for 94% of the variance in dissimilarity ratings whereas the rate-based one fails to capture most of it (5%). Error bars indicate SEM.
Discussion
When we interact with objects, vibrations are elicited in the skin and these vibrations have been shown to carry stimulus information. For example, the detection of slip (Johansson and Westling, 1987; Srinivasan et al., 1990), the surface properties of objects explored using a handheld tool (Klatzky and Lederman, 1999; Hollins et al., 2006; Yoshioka et al., 2007), and the discrimination of texture (Hollins and Risner, 2000; Hollins et al., 2001, 2002; Bensmaia and Hollins, 2003, 2005; Hollins and Bensmaia, 2007) all involve the processing of skin oscillations. Our results suggest that spike timing with millisecond precision plays an important role in shaping how skin vibrations are perceived. We extend previous findings that spike timing in afferent responses mediates the perception of sinusoidal frequency in the flutter range (<50 Hz) (Talbot et al., 1968) to include a broader and more naturalistic range of stimuli, thereby demonstrating that temporal coding is a general principle of tactile processing at the somatosensory periphery. Furthermore, we establish for the first time the resolution at which tactile signals convey information and are decoded to ultimately culminate in a tactile percept.
Differential importance of spike timing across afferent types
The three types of afferents convey vibratory information at different temporal resolutions. While we found spike timing to be important for all three afferent classes at a single-neuron level, results from our analyses of neuronal and psychophysical data suggest that the timing of spikes in SA1 afferents does not seem to play a major role in how vibrations are processed or perceived, whereas that of RA and PC afferents does. That spike timing in SA1 afferents is irrelevant in the tactile perception of stimulus frequency is compatible with intraneural microstimulation results in humans showing that increasing the frequency of electrical pulses applied to these afferents (and thus, presumably, decreasing the modal interspike interval) does not result in an increase in perceived stimulus frequency but rather produces an increase in perceived pressure (Ochoa and Torebjork, 1983). In contrast, increasing the frequency of electrical pulses applied to PC fibers elicits percepts of increasing frequency, as might be expected given our results. Finally, increasing the pulse rate applied to RA fibers produces percepts of increasing frequency up to a point, beyond which increases in subjective magnitude are elicited.
The differential importance of spike timing across mechanoreceptive afferent types underscores the dual modes of operation of the somatosensory system. Indeed, signals from SA1 afferents have been shown to be processed spatially: Information about spatial form and texture is extracted from the spatial pattern of activation for these fibers (Phillips and Johnson, 1981; Connor et al., 1990; Connor and Johnson, 1992; Goodwin et al., 1995; Goodwin and Wheat, 1999; Wheat and Goodwin, 2000, 2001). In contrast, PC fibers innervate the skin too sparsely to convey spatially modulated signals, except at the very coarsest of resolutions (Johansson and Vallbo, 1979). Rather, stimulus information is conveyed in the strength and timing of the responses of these afferents. RA afferents seem to fall in between these two extremes. On the one hand, RA fibers convey spatial information, but do so at a coarser spatial resolution than do SA1 fibers (Bliss et al., 1967; Phillips and Johnson, 1981; Gardner and Palmer, 1989, 1990). On the other hand, these fibers also convey temporal information, as shown here and previously (Talbot et al., 1968; Whitsel et al., 2000). The spatial and temporal modes of operation likely cooperate in a variety of contexts. For example, behavioral studies suggest that the tactile perception of both texture (Cascio and Sathian, 2001; Hollins and Bensmaia, 2007) and form (Gamzu and Ahissar, 2001) involve both spatial and temporal processing. Along those lines, it has been shown that, for stimulation that mimics the forces encountered during grasping objects, first spike latencies in both RA and SA1 afferents provide information about object curvature and force direction (Johansson and Birznieks, 2004; Saal et al., 2009). In these studies, where the frequency of stimulation was low (1.5 Hz), temporal precision was found to be high in SA1 and RA but not in PC afferents. A spike latency code would be beneficial for adjusting grip forces, which has to happen rapidly to prevent object slip. Differences in spike latencies might be used to trigger corrective grip adjustments quickly, but the perceptual availability of this latency-based information remains to be demonstrated. In contrast, as our results show, spike patterning at higher stimulus frequencies shapes perceptual judgments.
That spike timing in afferent responses is behaviorally relevant may inform the development of approaches to convey sensory feedback in upper-limb neuroprostheses through peripheral nerve stimulation. Indeed, one approach consists of modulating the amplitude or frequency of electrical pulses applied to the nerve invoking simple rate-based models (Dhillon and Horch, 2005). Our results suggest that this approach can only be used to elicit a limited span of the tactile experience, to the extent that sensations are mediated by RA and PC fibers. Models have been developed that predict the timing of afferent responses to arbitrary time varying stimuli with millisecond accuracy (Kim et al., 2010, 2011). While these models are more complex than their rate-based counterparts, the ability to generate (and ultimately elicit) spike trains with verisimilar temporal patterning will allow for a broader range of sensations.
Spike timing in other sensory modalities
The importance of spike timing in the processing of cutaneous vibrations draws a strong analogy with the processing of vibrissal vibrations and of acoustic stimuli. While recent work has revealed temporal coding in the visual system (e.g., relative onset latencies; Gollisch and Meister, 2008), millisecond-precision spike timing typically conveys information about spatial rather than temporal stimulus features, given the low temporal frequency of natural visual stimuli. In contrast, in auditory and whisker systems, neurons exhibit precisely timed firing patterns that encode the temporal features of rapidly changing stimuli.
In the rodent vibrissal system, spike timing has been shown to convey information about surface texture and stimulus location (Ghazanfar et al., 2000; Panzeri et al., 2001; Foffani et al., 2004, 2008; Arabzadeh et al., 2006). While the mechanism by which precisely timed spikes are decoded is the subject of intense debate (Abeles et al., 1993; Montemurro et al., 2007), the optimal temporal resolution of neurons in subcortical structures of this system has consistently been reported to be at a submillisecond or millisecond timescale (Deschênes et al., 2003; Jones et al., 2004; Montemurro et al., 2007). Precise spike timing has also been implicated in location discrimination in the rat forepaw cortex (Foffani et al., 2004; Blanc and Coq, 2007), which suggests temporal coding may be a more general principle of tactile information processing in the rodent somatosensory system (Aguilar et al., 2008).
Spike timing also plays an important role in auditory processing. In the auditory nerve, the spectral content of periodic stimuli is reflected in the interspike interval structure of afferent responses (Kiang et al., 1965; Horst et al., 1986; Cariani and Delgutte, 1996). Mammalian auditory afferents can entrain to acoustic stimuli at frequencies up to 3–5 kHz (Oertel, 1999), and this entrainment appears to be behaviorally relevant; indeed, pitch, the perceptual correlate of stimulus frequency, is well predicted by the discharge periodicities in auditory nerve fibers (Cariani and Delgutte, 1996; Cedolin and Delgutte, 2005). Neurons in the cochlear nucleus, where spectral information is extracted from afferent responses (Eggermont, 2001), exhibit highly entrained responses to stimuli <1 kHz, and in some cases, phase locking up to 2 kHz (Blackburn and Sachs, 1989); these neurons transmit information optimally at single-millisecond resolutions (Gai and Carney, 2008).
Thus, peripheral responses in the tactile, vibrissal and auditory systems convey information about time-varying stimuli through temporal patterning at millisecond resolutions. Furthermore, all three sensory modalities process spectrally complex oscillations (of the skin, the whiskers, or the ear drum). It is therefore likely that similar neural mechanisms have evolved across these sensory modalities to extract information from these oscillations. Our analogy with the auditory and vibrissal systems constitutes a departure in conceptions of the primate somatosensory system, which has been generally thought of as a spatial sense and likened to the visual system (Phillips et al., 1983; Bensmaia et al., 2008; Pei et al., 2008).
Footnotes
This work was funded by NIH Grant NS18787 and NSF Grant 1150209. We thank Daniel Meliza, Nicolas Heess, and Stephanie Palmer for helpful comments on the manuscript and Frank Dammann for technical assistance in data collection.
References
- Abeles M, Bergman H, Margalit E, Vaadia E. Spatiotemporal firing patterns in the frontal cortex of behaving monkeys. J Neurophysiol. 1993;70:1629–1638. doi: 10.1152/jn.1993.70.4.1629. [DOI] [PubMed] [Google Scholar]
- Aguilar J, Morales-Botello ML, Foffani G. Tactile responses of hindpaw, forepaw and whisker neurons in the thalamic ventrobasal complex of anesthetized rats. Eur J Neurosci. 2008;27:378–387. doi: 10.1111/j.1460-9568.2008.06025.x. [DOI] [PMC free article] [PubMed] [Google Scholar]
- Arabzadeh E, Panzeri S, Diamond ME. Deciphering the spike train of a sensory neuron: counts and temporal patterns in the rat whisker pathway. J Neurosci. 2006;26:9216–9226. doi: 10.1523/JNEUROSCI.1491-06.2006. [DOI] [PMC free article] [PubMed] [Google Scholar]
- Aronov D, Reich DS, Mechler F, Victor JD. Neural coding of spatial phase in V1 of the macaque monkey. J Neurophysiol. 2003;89:3304–3327. doi: 10.1152/jn.00826.2002. [DOI] [PubMed] [Google Scholar]
- Bensmaia S, Hollins M. Pacinian representations of fine surface texture. Percept Psychophys. 2005;67:842–854. doi: 10.3758/bf03193537. [DOI] [PubMed] [Google Scholar]
- Bensmaia SJ, Hollins M. The vibrations of texture. Somatosens Mot Res. 2003;20:33–43. doi: 10.1080/0899022031000083825. [DOI] [PMC free article] [PubMed] [Google Scholar]
- Bensmaïa SJ, Leung YY, Hsiao SS, Johnson KO. Vibratory adaptation of cutaneous mechanoreceptive afferents. J Neurophysiol. 2005;94:3023–3036. doi: 10.1152/jn.00002.2005. [DOI] [PMC free article] [PubMed] [Google Scholar]
- Bensmaia SJ, Denchev PV, Dammann JF, 3rd, Craig JC, Hsiao SS. The representation of stimulus orientation in the early stages of somatosensory processing. J Neurosci. 2008;28:776–786. doi: 10.1523/JNEUROSCI.4162-07.2008. [DOI] [PMC free article] [PubMed] [Google Scholar]
- Blackburn CC, Sachs MB. Classification of unit types in the anteroventral cochlear nucleus: PST histograms and regularity analysis. J Neurophysiol. 1989;62:1303–1329. doi: 10.1152/jn.1989.62.6.1303. [DOI] [PubMed] [Google Scholar]
- Blanc JL, Coq JO. Coding processes involved in the cortical representation of complex tactile stimuli. J Physiol Paris. 2007;101:22–31. doi: 10.1016/j.jphysparis.2007.10.004. [DOI] [PubMed] [Google Scholar]
- Bliss JC, Crane HD, Link SW, Townsend JT. Tactile perception of sequentially presented spatial patterns. NASA CR-623. NASA contractor report NASA CR United States National Aeronautics and Space Administration. 1967:29–41. [PubMed] [Google Scholar]
- Bolanowski SJ, Jr, Gescheider GA, Verrillo RT, Checkosky CM. Four channels mediate the mechanical aspects of touch. J Acoust Soc Am. 1988;84:1680–1694. doi: 10.1121/1.397184. [DOI] [PubMed] [Google Scholar]
- Cariani PA, Delgutte B. Neural correlates of the pitch of complex tones. I. Pitch and pitch salience. J Neurophysiol. 1996;76:1698–1716. doi: 10.1152/jn.1996.76.3.1698. [DOI] [PubMed] [Google Scholar]
- Cascio CJ, Sathian K. Temporal cues contribute to tactile perception of roughness. J Neurosci. 2001;21:5289–5296. doi: 10.1523/JNEUROSCI.21-14-05289.2001. [DOI] [PMC free article] [PubMed] [Google Scholar]
- Cedolin L, Delgutte B. Pitch of complex tones: rate-place and interspike interval representations in the auditory nerve. J Neurophysiol. 2005;94:347–362. doi: 10.1152/jn.01114.2004. [DOI] [PMC free article] [PubMed] [Google Scholar]
- Chubbuck JG. Small motion biological stimulator. Johns Hopkins APL Tech Digest. 1966 May-Jun;:18–23. [Google Scholar]
- Connor CE, Johnson KO. Neural coding of tactile texture: comparison of spatial and temporal mechanisms for roughness perception. J Neurosci. 1992;12:3414–3426. doi: 10.1523/JNEUROSCI.12-09-03414.1992. [DOI] [PMC free article] [PubMed] [Google Scholar]
- Connor CE, Hsiao SS, Phillips JR, Johnson KO. Tactile roughness: neural codes that account for psychophysical magnitude estimates. J Neurosci. 1990;10:3823–3836. doi: 10.1523/JNEUROSCI.10-12-03823.1990. [DOI] [PMC free article] [PubMed] [Google Scholar]
- Deschênes M, Timofeeva E, Lavallée P. The relay of high-frequency sensory signals in the Whisker-to-barreloid pathway. J Neurosci. 2003;23:6778–6787. doi: 10.1523/JNEUROSCI.23-17-06778.2003. [DOI] [PMC free article] [PubMed] [Google Scholar]
- Dhillon GS, Horch KW. Direct neural sensory feedback and control of a prosthetic arm. IEEE Trans Neural Syst Rehabil Eng. 2005;13:468–472. doi: 10.1109/TNSRE.2005.856072. [DOI] [PubMed] [Google Scholar]
- Eggermont JJ. Between sound and perception: reviewing the search for a neural code. Hear Res. 2001;157:1–42. doi: 10.1016/s0378-5955(01)00259-3. [DOI] [PubMed] [Google Scholar]
- Foffani G, Tutunculer B, Moxon KA. Role of spike timing in the forelimb somatosensory cortex of the rat. J Neurosci. 2004;24:7266–7271. doi: 10.1523/JNEUROSCI.2523-04.2004. [DOI] [PMC free article] [PubMed] [Google Scholar]
- Foffani G, Chapin JK, Moxon KA. Computational role of large receptive fields in the primary somatosensory cortex. J Neurophysiol. 2008;100:268–280. doi: 10.1152/jn.01015.2007. [DOI] [PMC free article] [PubMed] [Google Scholar]
- Freeman AW, Johnson KO. A model accounting for effects of vibratory amplitude on responses of cutaneous mechanoreceptors in macaque monkey. J Physiol. 1982;323:43–64. doi: 10.1113/jphysiol.1982.sp014060. [DOI] [PMC free article] [PubMed] [Google Scholar]
- Gai Y, Carney LH. Statistical analyses of temporal information in auditory brainstem responses to tones in noise: correlation index and spike-distance metric. J Assoc Res Otolaryngol. 2008;9:373–387. doi: 10.1007/s10162-008-0129-8. [DOI] [PMC free article] [PubMed] [Google Scholar]
- Gamzu E, Ahissar E. Importance of temporal cues for tactile spatial-frequency discrimination. J Neurosci. 2001;21:7416–7427. doi: 10.1523/JNEUROSCI.21-18-07416.2001. [DOI] [PMC free article] [PubMed] [Google Scholar]
- Gardner EP, Palmer CI. Simulation of motion on the skin. II. Cutaneous mechanoreceptor coding of the width and texture of bar patterns displaced across the OPTACON. J Neurophysiol. 1989;62:1437–1460. doi: 10.1152/jn.1989.62.6.1437. [DOI] [PubMed] [Google Scholar]
- Gardner EP, Palmer CI. Simulation of motion on the skin. III. Mechanisms used by rapidly adapting cutaneous mechanoreceptors in the primate hand for spatiotemporal resolution and two-point discrimination. J Neurophysiol. 1990;63:841–859. doi: 10.1152/jn.1990.63.4.841. [DOI] [PubMed] [Google Scholar]
- Ghazanfar AA, Stambaugh CR, Nicolelis MA. Encoding of tactile stimulus location by somatosensory thalamocortical ensembles. J Neurosci. 2000;20:3761–3775. doi: 10.1523/JNEUROSCI.20-10-03761.2000. [DOI] [PMC free article] [PubMed] [Google Scholar]
- Gollisch T, Meister M. Rapid neural coding in the retina with relative spike latencies. Science. 2008;319:1108–1111. doi: 10.1126/science.1149639. [DOI] [PubMed] [Google Scholar]
- Goodwin AW, Wheat HE. Effects of nonuniform fiber sensitivity, innervation geometry, and noise on information relayed by a population of slowly adapting type I primary afferents from the fingerpad. J Neurosci. 1999;19:8057–8070. doi: 10.1523/JNEUROSCI.19-18-08057.1999. [DOI] [PMC free article] [PubMed] [Google Scholar]
- Goodwin AW, Browning AS, Wheat HE. Representation of curved surfaces in responses of mechanoreceptive afferent fibers innervating the monkey's fingerpad. J Neurosci. 1995;15:798–810. doi: 10.1523/JNEUROSCI.15-01-00798.1995. [DOI] [PMC free article] [PubMed] [Google Scholar]
- Hernández A, Salinas E, Garciá R, Romo R. Discrimination in the sense of flutter: new psychophysical measurements in monkeys. J Neurosci. 1997;17:6391–6400. doi: 10.1523/JNEUROSCI.17-16-06391.1997. [DOI] [PMC free article] [PubMed] [Google Scholar]
- Hollins M, Bensmaia SJ. The coding of roughness. Can J Exp Psychol. 2007;61:184–195. doi: 10.1037/cjep2007020. [DOI] [PubMed] [Google Scholar]
- Hollins M, Risner SR. Evidence for the duplex theory of tactile texture perception. Percept Psychophys. 2000;62:695–705. doi: 10.3758/bf03206916. [DOI] [PubMed] [Google Scholar]
- Hollins M, Bensmaia SJ, Washburn S. Vibrotactile adaptation impairs discrimination of fine, but not coarse, textures. Somatosens Mot Res. 2001;18:253–262. doi: 10.1080/01421590120089640. [DOI] [PubMed] [Google Scholar]
- Hollins M, Bensmaïa SJ, Roy EA. Vibrotaction and texture perception. Behav Brain Res. 2002;135:51–56. doi: 10.1016/s0166-4328(02)00154-7. [DOI] [PubMed] [Google Scholar]
- Hollins M, Lorenz F, Harper D. Somatosensory coding of roughness: the effect of texture adaptation in direct and indirect touch. J Neurosci. 2006;26:5582–5588. doi: 10.1523/JNEUROSCI.0028-06.2006. [DOI] [PMC free article] [PubMed] [Google Scholar]
- Horst JW, Javel E, Farley GR. Coding of spectral fine structure in the auditory nerve. I. Fourier analysis of period and interspike interval histograms. J Acoust Soc Am. 1986;79:398–416. doi: 10.1121/1.393528. [DOI] [PubMed] [Google Scholar]
- Jacobs AL, Fridman G, Douglas RM, Alam NM, Latham PE, Prusky GT, Nirenberg S. Ruling out and ruling in neural codes. Proc Natl Acad Sci U S A. 2009;106:5936–5941. doi: 10.1073/pnas.0900573106. [DOI] [PMC free article] [PubMed] [Google Scholar]
- Johansson RS, Birznieks I. First spikes in ensembles of human tactile afferents code complex spatial fingertip events. Nat Neurosci. 2004;7:170–177. doi: 10.1038/nn1177. [DOI] [PubMed] [Google Scholar]
- Johansson RS, Vallbo AB. Tactile sensibility in the human hand: relative and absolute densities of four types of mechanoreceptive units in glabrous skin. J Physiol. 1979;286:283–300. doi: 10.1113/jphysiol.1979.sp012619. [DOI] [PMC free article] [PubMed] [Google Scholar]
- Johansson RS, Westling G. Signals in tactile afferents from the fingers eliciting adaptive motor responses during precision grip. Exp Brain Res. 1987;66:141–154. doi: 10.1007/BF00236210. [DOI] [PubMed] [Google Scholar]
- Johnson KO. Reconstruction of population response to a vibratory stimulus in quickly adapting mechanoreceptive afferent fiber population innervating glabrous skin of the monkey. J Neurophysiol. 1974;37:48–72. doi: 10.1152/jn.1974.37.1.48. [DOI] [PubMed] [Google Scholar]
- Johnson KO, Hsiao SS, Yoshioka T. Neural coding and the basic law of psychophysics. Neuroscientist. 2002;8:111–121. doi: 10.1177/107385840200800207. [DOI] [PMC free article] [PubMed] [Google Scholar]
- Jones LM, Lee S, Trageser JC, Simons DJ, Keller A. Precise temporal responses in whisker trigeminal neurons. J Neurophysiol. 2004;92:665–668. doi: 10.1152/jn.00031.2004. [DOI] [PMC free article] [PubMed] [Google Scholar]
- Kiang NY, Pfeiffer RR, Warr WB, Backus AS. Stimulus coding in the cochlear nucleus. Trans Am Otol Soc. 1965;53:35–58. [PubMed] [Google Scholar]
- Kim SS, Sripati AP, Bensmaia SJ. Predicting the timing of spikes evoked by tactile stimulation of the hand. J Neurophysiol. 2010;104:1484–1496. doi: 10.1152/jn.00187.2010. [DOI] [PMC free article] [PubMed] [Google Scholar]
- Kim SS, Mihalas S, Russell A, Dong Y, Bensmaia SJ. Does afferent heterogeneity matter in conveying tactile feedback through peripheral nerve stimulation? IEEE Trans Neural Syst Rehabil Eng. 2011;19:514–520. doi: 10.1109/TNSRE.2011.2160560. [DOI] [PubMed] [Google Scholar]
- Klatzky RL, Lederman SJ. Tactile roughness perception with a rigid link interposed between skin and surface. Percept Psychophys. 1999;61:591–607. doi: 10.3758/bf03205532. [DOI] [PubMed] [Google Scholar]
- LaMotte RH, Mountcastle VB. Capacities of humans and monkeys to discriminate vibratory stimuli of different frequency and amplitude: a correlation between neural events and psychological measurements. J Neurophysiol. 1975;38:539–559. doi: 10.1152/jn.1975.38.3.539. [DOI] [PubMed] [Google Scholar]
- Leung YY, Bensmaïa SJ, Hsiao SS, Johnson KO. Time-course of vibratory adaptation and recovery in cutaneous mechanoreceptive afferents. J Neurophysiol. 2005;94:3037–3045. doi: 10.1152/jn.00001.2005. [DOI] [PMC free article] [PubMed] [Google Scholar]
- Luna R, Hernández A, Brody CD, Romo R. Neural codes for perceptual discrimination in primary somatosensory cortex. Nat Neurosci. 2005;8:1210–1219. doi: 10.1038/nn1513. [DOI] [PubMed] [Google Scholar]
- Manfredi LR, Dammann JF, Zielinski MC, Polashock VS, Baker AT, Bensmaia SJ. The statistics of natural scenes in tactile texture perception. Soc Neurosci Abstr. 2011;37 704.713. [Google Scholar]
- Montemurro MA, Panzeri S, Maravall M, Alenda A, Bale MR, Brambilla M, Petersen RS. Role of precise spike timing in coding of dynamic vibrissa stimuli in somatosensory thalamus. J Neurophysiol. 2007;98:1871–1882. doi: 10.1152/jn.00593.2007. [DOI] [PubMed] [Google Scholar]
- Mountcastle VB, LaMotte RH, Carli G. Detection thresholds for stimuli in humans and monkeys: comparison with threshold events in mechanoreceptive afferent nerve fibers innervating the monkey hand. J Neurophysiol. 1972;35:122–136. doi: 10.1152/jn.1972.35.1.122. [DOI] [PubMed] [Google Scholar]
- Mountcastle VB, Steinmetz MA, Romo R. Frequency discrimination in the sense of flutter: psychophysical measurements correlated with postcentral events in behaving monkeys. J Neurosci. 1990;10:3032–3044. doi: 10.1523/JNEUROSCI.10-09-03032.1990. [DOI] [PMC free article] [PubMed] [Google Scholar]
- Muniak MA, Ray S, Hsiao SS, Dammann JF, Bensmaia SJ. The neural coding of stimulus intensity: linking the population response of mechanoreceptive afferents with psychophysical behavior. J Neurosci. 2007;27:11687–11699. doi: 10.1523/JNEUROSCI.1486-07.2007. [DOI] [PMC free article] [PubMed] [Google Scholar]
- Ochoa J, Torebjörk E. Sensations evoked by intraneural microstimulation of single mechanoreceptor units innervating the human hand. J Physiol. 1983;342:633–654. doi: 10.1113/jphysiol.1983.sp014873. [DOI] [PMC free article] [PubMed] [Google Scholar]
- Oertel D. The role of timing in the brain stem auditory nuclei of vertebrates. Annu Rev Physiol. 1999;61:497–519. doi: 10.1146/annurev.physiol.61.1.497. [DOI] [PubMed] [Google Scholar]
- Panzeri S, Petersen RS, Schultz SR, Lebedev M, Diamond ME. The role of spike timing in the coding of stimulus location in rat somatosensory cortex. Neuron. 2001;29:769–777. doi: 10.1016/s0896-6273(01)00251-3. [DOI] [PubMed] [Google Scholar]
- Panzeri S, Brunel N, Logothetis NK, Kayser C. Sensory neural codes using multiplexed temporal scales. Trends Neurosci. 2010;33:111–120. doi: 10.1016/j.tins.2009.12.001. [DOI] [PubMed] [Google Scholar]
- Pei YC, Hsiao SS, Bensmaia SJ. The tactile integration of local motion cues is analogous to its visual counterpart. Proc Natl Acad Sci U S A. 2008;105:8130–8135. doi: 10.1073/pnas.0800028105. [DOI] [PMC free article] [PubMed] [Google Scholar]
- Perkel DH, Bullock TH. Neural coding. In: Schmitt FO, Melnuchuk T, Quarton G, Adelman G, editors. Research symposium summaries. Cambridge: MIT; 1969. pp. 405–528. [Google Scholar]
- Phillips JR, Johnson KO. Tactile spatial resolution. II. Neural representation of bars, edges, and gratings in monkey primary afferents. J Neurophysiol. 1981;46:1192–1203. doi: 10.1152/jn.1981.46.6.1192. [DOI] [PubMed] [Google Scholar]
- Phillips JR, Johnson KO, Browne HM. A comparison of visual and two modes of tactual letter resolution. Percept Psychophys. 1983;34:243–249. doi: 10.3758/bf03202952. [DOI] [PubMed] [Google Scholar]
- Roy EA, Hollins M. A ratio code for vibrotactile pitch. Somatosens Mot Res. 1998;15:134–145. doi: 10.1080/08990229870862. [DOI] [PubMed] [Google Scholar]
- Saal HP, Vijayakumar S, Johansson RS. Information about complex fingertip parameters in individual human tactile afferent neurons. J Neurosci. 2009;29:8022–8031. doi: 10.1523/JNEUROSCI.0665-09.2009. [DOI] [PMC free article] [PubMed] [Google Scholar]
- Salinas E, Hernandez A, Zainos A, Romo R. Periodicity and firing rate as candidate neural codes for the frequency of vibrotactile stimuli. J Neurosci. 2000;20:5503–5515. doi: 10.1523/JNEUROSCI.20-14-05503.2000. [DOI] [PMC free article] [PubMed] [Google Scholar]
- Srinivasan MA, Whitehouse JM, LaMotte RH. Tactile detection of slip: surface microgeometry and peripheral neural codes. J Neurophysiol. 1990;63:1323–1332. doi: 10.1152/jn.1990.63.6.1323. [DOI] [PubMed] [Google Scholar]
- Talbot WH, Darian-Smith I, Kornhuber HH, Mountcastle VB. The sense of flutter-vibration: comparison of the human capacity with response patterns of mechanoreceptive afferents from the monkey hand. J Neurophysiol. 1968;31:301–334. doi: 10.1152/jn.1968.31.2.301. [DOI] [PubMed] [Google Scholar]
- Uttal WR. Emerging principles of sensory coding. Perspect Biol Med. 1969;12:344–368. doi: 10.1353/pbm.1969.0027. [DOI] [PubMed] [Google Scholar]
- Victor J, Purpura K. Metric-space analysis of spike trains: theory, algorithms, and application. Network. 1997;8:127–164. [Google Scholar]
- Victor JD, Purpura KP. Nature and precision of temporal coding in visual cortex: a metric-space analysis. J Neurophysiol. 1996;76:1310–1326. doi: 10.1152/jn.1996.76.2.1310. [DOI] [PubMed] [Google Scholar]
- Wheat HE, Goodwin AW. Tactile discrimination of gaps by slowly adapting afferents: effects of population parameters and anisotropy in the fingerpad. J Neurophysiol. 2000;84:1430–1444. doi: 10.1152/jn.2000.84.3.1430. [DOI] [PubMed] [Google Scholar]
- Wheat HE, Goodwin AW. Tactile discrimination of edge shape: limits on spatial resolution imposed by parameters of the peripheral neural population. J Neurosci. 2001;21:7751–7763. doi: 10.1523/JNEUROSCI.21-19-07751.2001. [DOI] [PMC free article] [PubMed] [Google Scholar]
- Whitsel BL, Kelly EF, Delemos KA, Xu M, Quibrera PM. Stability of rapidly adapting afferent entrainment vs responsivity. Somatosens Mot Res. 2000;17:13–31. doi: 10.1080/08990220070265. [DOI] [PubMed] [Google Scholar]
- Yau JM, Olenczak JB, Dammann JF, Bensmaia SJ. Temporal frequency channels are linked across audition and touch. Curr Biol. 2009;19:561–566. doi: 10.1016/j.cub.2009.02.013. [DOI] [PMC free article] [PubMed] [Google Scholar]
- Yoshioka T, Bensmaia SJ, Craig JC, Hsiao SS. Texture perception through direct and indirect touch: an analysis of perceptual space for tactile textures in two modes of exploration. Somatosens Mot Res. 2007;24:53–70. doi: 10.1080/08990220701318163. [DOI] [PMC free article] [PubMed] [Google Scholar]