

Abstract
Deformability while remaining viable is an important mechanical property of cells. Red blood cells (RBCs) deform considerably while flowing through small capillaries. The RBC membrane can withstand a finite strain, beyond which it ruptures. The classical yield areal strain of 2–4% for RBCs is generally accepted for a quasi-static strain. It has been noted previously that this threshold strain may be much larger with shorter exposure duration. Here we employ an impulse-like forcing to quantify this yield strain of RBC membranes. In the experiments, RBCs are stretched within tens of microseconds by a strong shear flow generated from a laser-induced cavitation bubble. The deformation of the cells in the strongly confined geometry is captured with a high-speed camera and viability is successively monitored with fluorescence microscopy. We find that the probability of cell survival is strongly dependent on the maximum strain. Above a critical areal strain of ∼40%, permanent membrane damage is observed for 50% of the cells. Interestingly, many of the cells do not rupture immediately and exhibit ghosting, but slowly obtain a round shape before they burst. This observation is explained with structural membrane damage leading to subnanometer-sized pores. The cells finally lyse from the colloidal osmotic pressure imbalance.
Introduction
Deformability of red blood cells (RBCs) is an important mechanical property and continues to draw interest. The healthy biconcave RBCs can deform easily to traverse capillary vessels smaller than their own diameter to transport oxygen to various parts of the body (1,2). A degradation of this property will increase flow resistance in the microcirculation. Decreased deformability has been found for RBCs in storage (3) and in pathological conditions such as severe burns (4) and in RBCs infected by Plasmodium falciparum (malaria) (5). It has also been reported that mechanical properties of cells could potentially serve as bioindicators for human diseases (6).
So far, various methods have been demonstrated to measure the mechanical properties of RBCs, among which are micropipette aspiration (7,8), light scattering (9), flicker spectroscopy (10–12), twisting micromagnetic beads (13), atomic force microscopy (14), shear flow (15), optical tweezers (16), and optical stretchers (17), as well as a more recent technique termed “controlled cavitation rheology” (CCR) (18). The CCR method stretches a collection of RBCs by using a fast and transient flow that is created by a single laser-induced cavitation bubble in a microchannel geometry. It has advantages over other methods in that many cells can be tested simultaneously and with an impulse-like forcing. This allows one to obtain large initial deformations of the cells.
Many studies on the mechanical properties of RBC membranes have confirmed that RBC membranes can only withstand a finite strain before they rupture, as first proposed by Rand and Burton (7,8). A classic experimental result (19) shows that the RBC membrane will rupture beyond a critical areal strain of 2–4%. This was found in micropipette measurements of isotropic tension versus area expansion of pre-swollen single human RBCs. Rapid cell lysis above a critical areal strain of 2.6 ± 0.8% was reported later with the cell-poking method of osmotically swollen human erythrocytes (20). In that method, they detect the force required to indent cells attached to a glass coverslip and use a simplified mechanical model to obtain the elastic area compressibility modulus. This agrees reasonably with the classic result from Evans et al. (19). The work of Leverett et al. (21), using a rotational viscometer, shows that beyond a shear-stress threshold, extensive cell damage will occur. They summarized prior studies on hemolysis and found a correlation in which the threshold shear stress is inversely proportional to the exposure time. The results are consistent among the various studies using RBCs of different origins and flow fields.
This work is inspired by their result. We want to address the question of what is the maximum areal strain a RBC can sustain. Therefore, we will make use of the above-mentioned CCR technique in which a laser-induced cavitation bubble stretches cells in an impulse-like fashion, e.g., within ∼40–60 μs. Additionally, we supplement the CCR method with fluorescence microscopy to monitor the cell membrane integrity after the stretching.
Extensive cell membrane damage or membrane rupture beyond a critical stress or strain is due to membrane pores. It has been predicted (22) that a membrane may heal itself for sufficiently small pores (smaller than 1–10 nm) whereas a membrane may not heal for larger pores. Pores in the cell membrane allow the delivery of foreign and large molecules such as genes into the cells (23–25).
Therefore, in this work we will quantify the yield strain for RBC membrane rupture using the impulse-like stretching from a single laser-induced cavitation bubble (18). The dynamic bubble-cell interaction is recorded with high-speed photography and the resultant cell membrane integrity is assessed from the efflux of fluorophores from the cell’s cytoplasm into the extracellular space.
Materials and Methods
Experimental setup
To stretch the RBCs, we use the impulse-like forcing from a laser-induced cavitation bubble. The experimental technique is similar to previous studies (Quinto-Su et al. (18)). Fig. S1 in the Supporting Material depicts the experimental setup. A 532-nm, 6-ns duration laser pulse is focused with a 40×/0.8 NA water immersion objective into the cell solution inside a microchannel. An optical breakdown at the focus of the pulsed laser beam results into a rapidly expanding bubble (26). The bubbles created have a maximum radius of ∼150–200 μm with a lifetime from 40 to 60 μs. These relatively large bubbles are needed to probe the yield strength of cells. In Quinto-Su et al. (18), lower laser energy was used to probe the cell rigidity without membrane rupture.
A high-speed camera (model No. SA-1; Photron, San Diego, CA) is used to sequentially capture both the fast bubble dynamics and the following slower process of cell shape recovery. Therefore fast (500 frames with 10 μs time interval, 1 μs exposure time) and then slow (1999 frames with 5 ms time interval) recordings are performed. Fluorescence images of the same field of view are taken immediately after the high-speed camera recordings. The fluorescence images are captured with a cooled charge-coupled device camera (Sensicam QE; PCO, Kelheim, Germany) at 1.67 frames/s for up to 100 s. A mirror is switched to direct the light to either camera. All the timings are controlled precisely with trigger signals from a pulse delay generator (Model No. 575; Berkeley Nucleonics, San Rafael, CA). During experiments, we also take care that cells are only exposed once to a cavitation bubble.
Red blood cell preparations and fluorescence dye loading
Human erythrocytes were collected from a healthy donor using sodium citrate. They are washed three times with 1× phosphate-buffered saline (PBS) containing 0.1% bovine serum albumin. The washed RBCs are kept at 50% hematocrit in 1.0 mL Eppendorf tubes. Then 6 μL of these 50% washed RBCs are diluted in 200 μL PBS. A quantity of 10 μL of 100 μM calcein-AM (Biotium, Hayward, CA) is added for a final concentration of 5 μM. After 45-min incubation at 37°C, the cell solution is ready for use and applied immediately for experiments.
Microchannel geometry
The prepared cell solution is confined between two fastened No. 1 microscope cover slides with 15-μm-thick flattened aluminum foils as spacers (Quinto-Su et al. (18)).
Image processing for maximum strain of cells
After the bubble collapses, the cells recover their shape gradually. During that time, we extract the major length L (Fig. 1 B (b)) and the area S from the contours of the cells. This is done using image processing (see the Supporting Material). We have checked the error introduced by using a rather low pixel resolution in the high-speed recordings and found that the error in measuring the total cell area is ∼6%. As only the relative change of the area is used for the areal strain we expect that the error due to a coarse resolution is less, thus below this 6%. Lmax and Smax are the maximum length and area measured after the bubble collapses, and Leq and Seq when the cell has reached a constant shape. Hence, the maximum linear strain γlin and areal strain γarea are
Figure 1.
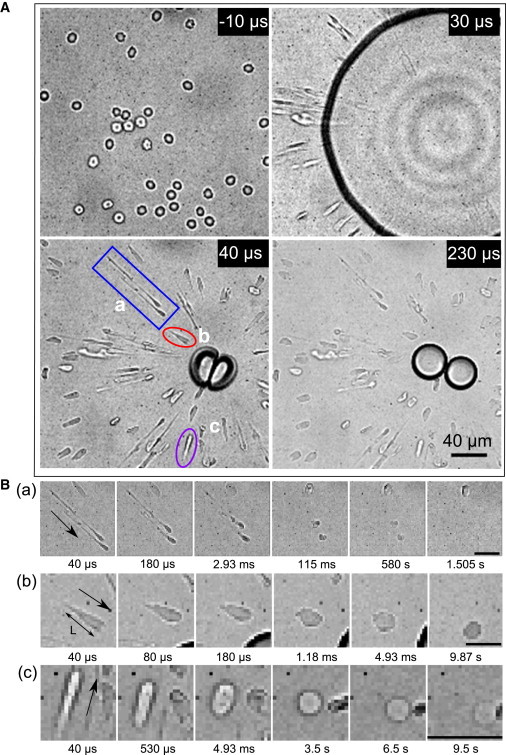
(A) RBCs imaged before (−10 μs), during (30 μs), and after the cavitation event (40 μs and 230 μs). Here time t = 0 is set as the time when the cavitation bubble is created. (B) (a–c) Enlarged areas demonstrating the shape recovery of the individual cells marked in panel A with a–c, respectively. The timings below indicate the elapsed time after the bubble is created. (a) The long tethered cells, which disappear gradually. In panel B (b), L is the major length used for calculating linear strain. Area of the cell contour is used to define the areal strain. (c) A cell that relaxes and then disappears at the end of high-speed recording. (In each case, arrows indicate the direction toward the bubble center.) All of the scale bars denote 20 μm.
Monitoring cell membrane integrity
To check thoroughly for membrane integrity, we combine the high-speed recording, which covers only 10 s, with a slower but more sensitive imaging modality. After this 10 s, the camera port is switched to the fluorescence camera (Sensicam QE; PCO), which records at 1.67 frames/s for up to 100 s (see Experimental Setup, above).
Cells that noticeably lose their bright-field contrast or fluorescence intensity (reach the background intensity) during the total observation time of 110 s are characterized as permanently porated cells. The remaining cells are characterized as viable (Fig. 2).
Figure 2.
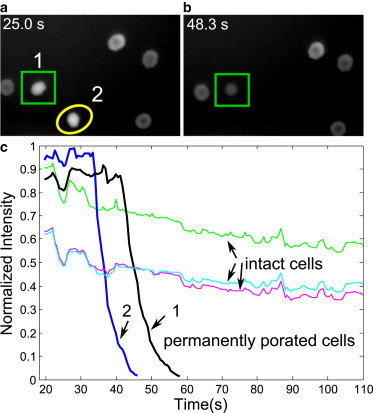
Monitoring the integrity of cell membrane with fluorescence imaging. (a and b) The fluorescence images taken for the same cells at 25 and 48.3 s after the bubble-induced stretching, respectively. The cells marked in panel a are disappearing (denoting permanently porated cells). (c) Variation of fluorescence intensity with time for permanently porated cells and intact cells from the same experiment shown in panel a. (The arrows labeled with 1 and 2 point toward the permanently porated cells marked by a rectangle and a circle in panel a, respectively.) (Right) Three cells showing a mild reduction of intensity due to fluorescence bleaching (intact cells). Here all the timings indicate the time elapsed after collapse of the bubble.
Statistics of cell viability as a function of maximum strain
We divide the maximum strains of all the analyzed cells into several bins and count the number of viable and lysed cells within each range. To plot the percentage of viable cells for each bin the average strain is calculated and the standard deviation from the average strain is plotted as error bars.
Results
Bubble-cell interaction
Fig. 1 A presents an overview of the dynamics of the bubble expansion and collapse as well as the cell deformation. At time t = −10 μs before the experiment, all the cells show the typical biconcave shape of unstretched RBCs. At t = 0 s, the cavitation bubble is created. Then at time t = 30 μs, we see the dark contour of the expanding bubble and the elongated cells around it. The short exposure time of 1 μs allows us to capture the cells with little motion blur. During bubble expansion the cells are already largely stretched. At time t = 40 μs, the bubble has collapsed and the cells are stretched even further. A bubble remains visible in the center. This is different compared to Quinto-Su et al. (18), and we attribute it to the higher laser energy. This remaining gas bubble dissolves slowly due to surface tension (27). At time t = 40 μs, the radial flow has ceased and the cells start to relax to their final shapes. At time t = 230 μs, the cells have already retracted to some extent.
Next, we present the relaxation of the cell shape in greater detail. Selected cells are marked with a–c (t = 40 μs) in Fig. 1 A, and enlarged in Fig. 1 B.
Fig. 1 B (b) illustrates a cell that recovers to its original shape and still survives at the end of high-speed recording (t = 9.87 s). Fig. 1 B (a) depicts the evolution of the cells that are stretched into long tethers (t = 40 μs). They complete relaxation within 115 ms; afterward their contrast is reducing (t = 580 ms) before they finally disappear (t = 1.505 s), indicating cell lysis. It is noticeable that these tethered cells are stretched longer and their disappearance is faster compared to cells without tethers. Fig. 1 B (c) shows a cell that seemingly first undergoes recovery (t = 0–3.5 s) yet disappears at a later time (t = 6.5–9.5 s). For more detail on the bubble dynamics and cell stretching, please refer to Movie S1 in the Supporting Material (bright-field recording).
The obvious leakage from dye-loaded red blood cells is an indicator of cell lysis. This leakage takes place on a longer timescale than the stretching and relaxation of the cells. Two exemplary frames from fluorescence microscopy are shown in Fig. 2, a and b, which are taken 25 and 48.3 s after the bubble-induced stretching, respectively. It is noticeable that two of the cells lose considerably their fluorescence (labeled 1 and 2 in Fig. 2 a), whereas neighboring cells seem unaffected. This strong difference in time-dependent fluorescence is depicted in Fig. 2 c: cells labeled 1 and 2 show a rapid decrease in intensity (within 7 s from 90% to 10%, labeled as permanently porated cells) whereas the three cells to their right (labeled as intact cells) show a mild reduction of intensity due to fluorescence bleaching (counted as viable cells).
A closer look at the leaking cells in Fig. 2 a reveals their distinct shape: leaking cells have irregular shapes and more uniform intensity distribution compared to intact cells. Additionally, leaking cells change shapes from irregular to spherical before the leakage. This behavior is demonstrated in Fig. 3 where three examples of the fast leaking cells are presented. The upper two rows are cells labeled 1 and 2 from Fig. 2 a and the bottom sequence is taken from another experiment. We always find a rounding of the cells before their fast leakage of dye.
Figure 3.
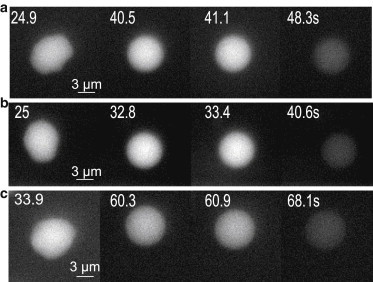
Change of the shape and fluorescence intensity for the individual fast leaking cells. (a and b) The cells marked by 1 and 2 in Fig. 2a, respectively. (c) Permanently porated cell from another experiment. Here all the timings indicate the time elapsed after collapse of the bubble.
Threshold strain for RBC membrane rupture
To obtain a threshold strain for RBC membrane rupture from this impulsive stretching, we correlate the membrane integrity of cells with their maximum strains.
The data from 93 cells through 12 measurements has been analyzed. Among these, there are 48 viable cells and 45 nonviable cells. We obtain the statistics of viable cells (in percentage) as a function of the maximum linear/areal strain, shown in Fig. 4. The circle and square symbols denote the viability versus the mean value of linear and areal strain within each strain range, respectively. It can be seen that at small strain range, all cells survive. With strain increasing, the viability decreases gradually. Above a certain strain, no cells remain viable, i.e., they become permanently porated. The data for the linear and area strain follow similar trends. We get a 50% viability of 105% for linear and 40% for areal strain. These thresholds have been obtained through interpolation of the hyperbolic tangent functions (solid lines) that are fitted to the experimental data.
Figure 4.
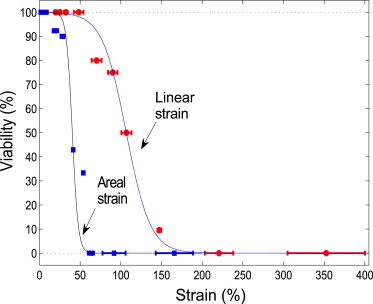
Viable cells (in percentage) as a function of the linear (circle) and/or areal (square) strain. The data has been collected from 93 cells through 12 measurements. (Circles and squares) Experimental data, demonstrating the viability versus the mean value of each strain range; error bars denote standard deviation. (Solid lines) Fits to a tanh function.
For the areal strain, some error may be involved in the neglect of a potential cell thinning during stretching. Nevertheless, we expect only a minor contribution because the flow is essentially planar and, therefore, stretching should occur only in the lateral direction.
Generally speaking, the impulsive forcing of cavitation bubble results in much larger critical areal strain for permanent pore formation as compared to the classic results in micropipette aspiration, which is 2–3% (19).
Leakage dynamics for cell rupture
It is interesting to note that cells do not rupture during or immediately after the impulsive stretching, but change to a spherical shape and rupture on a longer timescale. When the cell ruptures, it leaks out the loaded dye to the environment. Therefore, next we will discuss the detailed process of the efflux of fluorescence from the fast leaking cells to gain some insight into the rupture process.
A time-lapse sequence of the exemplary cell in Fig. 3 b is depicted in Fig. 5 a. Please note that time t = 0 is now the time just after the leakage starts. The intensity within the cell declines gradually and seemingly homogeneously from t = 0 to t = 7.2 s. Upon closer inspection of the camera pictures, we note that the intensity distribution has a dramatic change at time t = 0, which is hardly visible in the linearly scaled image. However, the 12-bit intensity resolution of the camera allows us to detect minute changes in the fluorescence surrounding the cell. Therefore, we plot in Fig. 5 b the contour levels indicating the magnitude of fluorescence. Interestingly, at t = −0.6 s the background shows no fluorescent signal, whereas at time t = 0 the cell becomes embedded in a nonuniform fluorescent medium. Here a nonlinear mapping of the grayscale levels is used to emphasize the small changes of intensity outside the cell. From t = 0 to t = 0.6 s the fluorescence in the liquid medium increases slightly, and decays gradually from t = 0.6 s onwards to almost no fluorescent signal. It is noticeable that the fluorescence is inhomogeneous, being stronger at the bottom left of the frames. This may be explained by a localized outflux through the plasma membrane, e.g., through single or multiple permanent pores.
Figure 5.
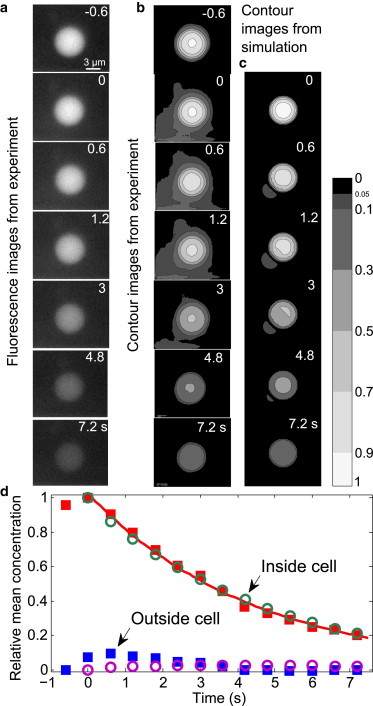
Illustration of the detailed process for the leakage of fluorescence dye from the permanently porated cells shown in Fig. 2. The exemplary cell shown here is the one labeled by 2 in Fig. 2a. (a) Fluorescence images from experiment for the time from t = −0.6 to t = 7.2 s. The moment t = 0 is defined as the time just after the leakage starts. (b) Contour images of the experimental column in panel a with a color bar indicating the contour levels for intensity/concentration (brighter color indicates higher fluorescence intensity/concentration). The contour levels are set as 0, 0.05, 0.1, 0.3, 0.5, 0.7, 0.9, and 1. (c) Contour images from the three-dimensional diffusion simulation with an effective pore diameter of 1.6 μm. The same color coding is used as in panel b. (d) The relative mean fluorescence intensity/concentration as a function of time inside and outside the cell from the experiment (solid squares) and the simulation (open circles). (Solid line) Fit of the experimental data inside the cell to an exponential decay c = 1.028 × exp(−0.2278 × t), where c is the relative mean concentration and t is the time (s). The pore size for simulation is of 1.6 μm diameter.
Before discussing simulation results, we detail the measured dynamics of the fluorescence intensity inside and surrounding the cell: the time-dependent relative mean intensity inside and outside the cell is depicted in Fig. 5 d. Here the summed intensity within the cell is normalized (at t = 0) and plotted with squares; the emission surrounding the cell is summed over the area shown in Fig. 5 b. We find the summed intensity within the cell follows an exponential decay over the time span from t = 0 to t = 7.2 s (Fig. 5 d, solid line). In contrast, the intensity outside the cell (squares) is 0 before t = 0, reaches a maximum at ∼t = 0.6 s, and then decreases gradually. The intensity may be related linearly to the dye concentration, which allows us to compare the images with a diffusion model. To cater for this we have corrected all presented intensities for fluorescence bleaching (Fig. 2 c).
It is also noticeable that from t = −0.6 s to t = 0 there is a rapid increase of fluorescence intensity surrounding the cell. This burst-like change is much faster than that from t = 0 to t = 7.2 s (Fig. 5, a, b, and d, and see Movie S2). The spatial and temporal change in fluorescence intensity from t = 0 to t = 7.2 s seems to follow diffusion transport.
This transport is now tested with a simple diffusion model,
| (1) |
where c(r,t) is the dye concentration given in mol/m3 and D is the diffusion coefficient. For simplicity we assume a constant diffusion coefficient, and fix it to D = 2.2 × 10⁻¹¹ m2/s; this value is reported for calcein in PBS (28).
The diffusion transport of membrane-impermeable dye calcein from the cell must occur through an opening in the plasma membrane. It has been reported that laser-induced cavitation bubbles generate pores of nanometer to micrometer size (29). Once single or multiple permanent pores in the plasma membrane are formed, the calcein dye can diffuse into the extracellular medium. Therefore, the above equation is solved with a finite-element solver (COMSOL Multiphysics 3.4; COMSOL, Palo Alto, CA) in three dimensions where a single pore is modeled with a variable circular opening in the spherical cell membrane.
Previously, a simple spherical diffusion model has been reported where a homogeneous leakiness of the membrane is assumed (28). The numerical integration gives, as expected, a similar result. Here the finite-element method allows us to include the confined geometry of the microchannel and test different pore sizes and distributions.
We study the effect of the circular pore diameter on the rate of the diffusion to compare with experiments. We understand that this approach is largely simplifying the dynamic process, i.e., the diffusion constant D may not be homogeneous in space or constant in time (30) and the pore may change location and size. The area of the simulated circular pore has to be understood as an effective area for the diffusion through multiple pores in the plasma membrane. (For more details about the simulation, please refer to the Supporting Material.)
Simulation results with an effective pore of 1.6 μm in diameter are presented in Fig. 5, c and d (circles), for comparison with the experimental data from t = 0 to t = 7.2 s. Assuming that the pore is formed after time t = 0, the internal concentration should follow the simulation. Indeed, the good agreements within the cells both in contour images and intensity change indicate that the dye leakage during this period is driven by diffusion. The change of the concentration outside the cell follows similar trends as the experiment during this time span. However, The absolute magnitudes and distributions of concentration surrounding the cell in the simulation are much smaller than seen in the experiment (from t = 0 to t = 1.2 s; Fig. 5, b–d). This is because initially there is a rapid increase of dye outside the cell (burst-like efflux) in the experiment (from t = −0.6 s to t = 0). Therefore, the whole leakage dynamics cannot be explained with a diffusion-limited process. We assume that another mechanism is responsible for the initial dye transport whereas diffusion dominates the later slower transport (see Discussion).
Discussion
During the fast event of bubble expansion and collapse in the microfluidic channel, a radial stretching of the RBCs is observed. Many of the stretched cells relax back to their original biconcave shapes, yet some of the cells form large tethers (Fig. 1 B (a)). We explain this observation with some unspecific adhesion of the cell to glass surface or largely uneven shear stress. The latter may occur when some part of the cell is beneath the bubble, whereas the part just outside the bubble experiences a high shear stress.
Permanent poration or lysis of the cell is detected by ghosting and leakage of dye. All tethered cells ghost within a few seconds, and do not relax to their initial size and shape. A detailed analysis of >90 cells shows that >50% can withstand a linear strain of 105%, and an areal strain of 40%. These cells neither ghost nor release the fluorescent load within 110 s. These critical strains are considerably larger than classic results from micropipette aspiration, of 2–3% areal strain.
The much larger yield strength of cells in our experiments may be explained with the brief exposure time (21). This short exposure time does not allow the cell to respond through a biochemical pathway during the stretching. It tests the purely mechanical properties of the plasma membrane and the underlying spectrin network.
Interestingly, when cells lyse, they do not rupture immediately after the cavitation exposure, but become spherical before they leak and gradually disappear (Fig. 1 B (c), high-speed recording; and Fig. 3, fluorescence imaging). We find that the leakage occurs anytime between a few and tens of seconds after the stretching. Thus, pores large enough for calcein to be released can only be formed that much later. Also, the fluorescence pattern surrounding a leaking cell occurs within <1 s, which is much faster than the diffusion (Fig. 5). This burst-like efflux together with the later slower process of diffusion may explain the observed leakage dynamics. The cell shape rounding and subsequent burst-like efflux may be the result of a pressure buildup inside the cell followed by a rupturing of the membrane.
Therefore, we assume that another mechanism is responsible for the initial dye transport, and suggest that after the cavitation exposure, small pores are generated and remain. The details are presented as follows: Although the PBS solution is isotonic, the higher concentration of some of the cytoplasmic macromolecules, e.g., proteins such as hemoglobin molecules, leads to an osmotic pressure imbalance. Through pores with radii smaller than the Stokes radius of calcein (0.6–0.7 nm (31,32)), water molecules or ions may diffuse into the cell leading to the swelling of the cell whereas the fluorescence dye calcein cannot diffuse out. Once the cell volume exceeds the plasma membrane’s capacity the cell bursts, i.e., cellular content is accelerated through the burst site. This rapid outflux is visible as a rapid increase in the calcein concentration outside the cell (Fig. 5). Large pore(s) is/are formed at this burst site and then the slower diffusion process through the large pore(s) takes place. An effective diameter of 1.6 μm for this large pore is estimated from the diffusion model. The diffusion model only captures the transport of dye sufficiently after a cell bursts and after the velocity of the fluid leaving the pore(s) is sufficiently low.
For this hypothesis, the small pores must remain for a sufficient time. Long-lived nanopores have been reported experimentally and theoretically for polymersomes (33,34). There the pores are stabilized by molecular brushes; a similar mechanism has been proposed for erythrocytes membranes where the glycocalyx may contribute to a steric stabilization of nanopores.
This mechanism of swelling and lysis is well known from electroporation of RBCs. There the electric field creates pores in the membrane and large cytoplasmic colloidal proteins cause swelling (35), eventually leading to colloidal osmotic lysis (36). In our experiments, only mechanical forces acting on the cell cause membrane poration. In contrast, in electroporation electric field gradients lead to a complex scenario for which the exact mechanisms causing pores are still in debate (37).
Interestingly, cells that round up and burst show some irregular, nonbiconcave shapes. It is known that connections between the bilayer and the spectrin network, and the proteins binding the two-dimensional spectrin network, are responsible for the biconcave morphology of the healthy RBCs (38). Thus, the irregular shape indicates that this underlying spectrin network has been mechanically violated, e.g., there has been mechanical rupture of the spectrin dimer and/or anchor points of the spectrin with the plasma membrane.
Applying tension through micropipette aspiration or adhesion (Hategan et al. (39)) leads to a sustained static tension on the cells. These results typically probe the long timescale for membrane rupture. A failure model as proposed by Evans and Ludwig (40) is not directly applicable to our experiments because the rupture event is not occurring during the stretching.
Nevertheless, failure models are frequently used to predict hemolysis, particularly when RBCs are exposed to high shear stress while passing through prosthetic heart valves. Yoganathan et al. (41) and Deutsch et al. (42) reported on the hemolysis of RBCs from artificial heart valves, within ventricular assist devices, and blood pumps. Contemporary computational fluid dynamics simulations (Arora et al. (43)) combine failure models with empirical power laws to predict the shear stress and exposure duration leading to immediate hemolysis. Our results agree with their computational fluid dynamics analysis that blood cells in a rapidly fluctuating shear flow can sustain high shear stress levels for very short exposure time without hemolyzing significantly. This provides insight for the design of these medical devices.
In summary, the impulsive forcing of a single laser-induced cavitation bubble is used to quantify the yield strain for cell membrane rupture. We used a microfluidic confinement to obtain an impulse-like and sufficiently strong shear flow. The probability of cell survival is a function of the maximum strain. We find a critical areal strain of ∼40% where 50% of the cells show membrane rupture. This areal strain is much larger than the classic result of 2–3% found in micropipette aspiration (19). Membrane poration and lysis is observed after cavitation exposure by detecting the efflux of the cytosol fluorophore calcein. We find that cells do not rupture during or immediately after the cavitation event, but turn to a spherical shape gradually before their burst-like efflux and the later slower diffusive leakage. These observations suggest that lysis of RBCs under mechanical forces constitutes a two-step process:
-
1.
The membrane is violated during stretching by formation of subnanometer-sized pores that are smaller than the Stokes radius of calcein; and
-
2.
Colloidal osmotic swelling then sets in and continues until the cell bursts, thereby releasing the calcein load via diffusion.
Acknowledgments
We acknowledge financial support through Nanyang Technological University and The Ministry of Education, Singapore.
Supporting Material
References
- 1.Jay A.W.L. Viscoelastic properties of the human red blood cell membrane. I. Deformation, volume loss, and rupture of red cells in micropipettes. Biophys. J. 1973;13:1166–1182. doi: 10.1016/S0006-3495(73)86053-9. [DOI] [PMC free article] [PubMed] [Google Scholar]
- 2.Jay A.W.L., Rowlands S., Skibo L. The resistance to blood flow in the capillaries. Can. J. Physiol. Pharmacol. 1972;50:1007–1013. doi: 10.1139/y72-145. [DOI] [PubMed] [Google Scholar]
- 3.La Celle P.L. Alteration of deformability of the erythrocyte membrane in stored blood. Transfusion. 1969;9:238–245. doi: 10.1111/j.1537-2995.1969.tb04930.x. [DOI] [PubMed] [Google Scholar]
- 4.Schachar N.S., Jay A.W., Tyler F.H. Decreased red cell deformability in burn patients. Can. J. Surg. 1974;17:239–243. [PubMed] [Google Scholar]
- 5.Nash G.B., O’Brien E., Dormandy J.A. Abnormalities in the mechanical properties of red blood cells caused by Plasmodium falciparum. Blood. 1989;74:855–861. [PubMed] [Google Scholar]
- 6.Lee G.Y., Lim C.T. Biomechanics approaches to studying human diseases. Trends Biotechnol. 2007;25:111–118. doi: 10.1016/j.tibtech.2007.01.005. [DOI] [PubMed] [Google Scholar]
- 7.Rand R.P., Burton A.C. Mechanical properties of the red cell membrane: I. Membrane stiffness and intracellular pressure. Biophys. J. 1964;4:115–135. doi: 10.1016/s0006-3495(64)86773-4. [DOI] [PMC free article] [PubMed] [Google Scholar]
- 8.Rand R.P. Mechanical properties of the red cell membrane: II. Viscoelastic breakdown of the membrane. Biophys. J. 1964;4:303–316. doi: 10.1016/s0006-3495(64)86784-9. [DOI] [PMC free article] [PubMed] [Google Scholar]
- 9.Gandjbakhche A.H., Mills P., Snabre P. Light-scattering technique for the study of orientation and deformation of red blood cells in a concentrated suspension. Appl. Opt. 1994;33:1070–1078. doi: 10.1364/AO.33.001070. [DOI] [PubMed] [Google Scholar]
- 10.Strey H., Peterson M., Sackmann E. Measurement of erythrocyte membrane elasticity by flicker Eigenmode decomposition. Biophys. J. 1995;69:478–488. doi: 10.1016/S0006-3495(95)79921-0. [DOI] [PMC free article] [PubMed] [Google Scholar]
- 11.Döbereiner H.G., Gompper G., Riske K.A. Advanced flicker spectroscopy of fluid membranes. Phys. Rev. Lett. 2003;91:048301. doi: 10.1103/PhysRevLett.91.048301. [DOI] [PubMed] [Google Scholar]
- 12.Evans J., Gratzer W., Sleep J. Fluctuations of the red blood cell membrane: relation to mechanical properties and lack of ATP dependence. Biophys. J. 2008;94:4134–4144. doi: 10.1529/biophysj.107.117952. [DOI] [PMC free article] [PubMed] [Google Scholar]
- 13.Puig-de-Morales-Marinkovic M., Turner K.T., Suresh S. Viscoelasticity of the human red blood cell. Am. J. Physiol. Cell Physiol. 2007;293:C597–C605. doi: 10.1152/ajpcell.00562.2006. [DOI] [PubMed] [Google Scholar]
- 14.Sen S., Subramanian S., Discher D.E. Indentation and adhesive probing of a cell membrane with AFM: theoretical model and experiments. Biophys. J. 2005;89:3203–3213. doi: 10.1529/biophysj.105.063826. [DOI] [PMC free article] [PubMed] [Google Scholar]
- 15.Watanabe N., Kataoka H., Takatani S. Dynamic deformation and recovery response of red blood cells to a cyclically reversing shear flow: effects of frequency of cyclically reversing shear flow and shear stress level. Biophys. J. 2006;91:1984–1998. doi: 10.1529/biophysj.105.060236. [DOI] [PMC free article] [PubMed] [Google Scholar]
- 16.Lim C., Dao M., Chew K. Large deformation of living cells using laser traps. Acta Mater. 2004;52:1837–1845. [Google Scholar]
- 17.Guck J., Ananthakrishnan R., Käs J. The optical stretcher: a novel laser tool to micromanipulate cells. Biophys. J. 2001;81:767–784. doi: 10.1016/S0006-3495(01)75740-2. [DOI] [PMC free article] [PubMed] [Google Scholar]
- 18.Quinto-Su P.A., Kuss C., Ohl C.D. Red blood cell rheology using single controlled laser-induced cavitation bubbles. Lab Chip. 2011;11:672–678. doi: 10.1039/c0lc00182a. [DOI] [PubMed] [Google Scholar]
- 19.Evans E.A., Waugh R., Melnik L. Elastic area compressibility modulus of red cell membrane. Biophys. J. 1976;16:585–595. doi: 10.1016/S0006-3495(76)85713-X. [DOI] [PMC free article] [PubMed] [Google Scholar]
- 20.Daily B., Elson E.L., Zahalak G.I. Cell poking. Determination of the elastic area compressibility modulus of the erythrocyte membrane. Biophys. J. 1984;45:671–682. doi: 10.1016/S0006-3495(84)84209-5. [DOI] [PMC free article] [PubMed] [Google Scholar]
- 21.Leverett L.B., Hellums J.D., Lynch E.C. Red blood cell damage by shear stress. Biophys. J. 1972;12:257–273. doi: 10.1016/S0006-3495(72)86085-5. [DOI] [PMC free article] [PubMed] [Google Scholar]
- 22.Litster J. Stability of lipid bilayers and red blood cell membranes. Phys. Lett. A. 1975;53:193–194. [Google Scholar]
- 23.Neumann E., Schaefer-Ridder M., Hofschneider P.H. Gene transfer into mouse lyoma cells by electroporation in high electric fields. EMBO J. 1982;1:841–845. doi: 10.1002/j.1460-2075.1982.tb01257.x. [DOI] [PMC free article] [PubMed] [Google Scholar]
- 24.Ferrara K., Pollard R., Borden M. Ultrasound microbubble contrast agents: fundamentals and application to gene and drug delivery. Annu. Rev. Biomed. Eng. 2007;9:415–447. doi: 10.1146/annurev.bioeng.8.061505.095852. [DOI] [PubMed] [Google Scholar]
- 25.Ohl C.-D., Arora M., Lohse D. Sonoporation from jetting cavitation bubbles. Biophys. J. 2006;91:4285–4295. doi: 10.1529/biophysj.105.075366. [DOI] [PMC free article] [PubMed] [Google Scholar]
- 26.Venugopalan V., Guerra A., 3rd, Vogel A. Role of laser-induced plasma formation in pulsed cellular microsurgery and micromanipulation. Phys. Rev. Lett. 2002;88:078103. doi: 10.1103/PhysRevLett.88.078103. [DOI] [PubMed] [Google Scholar]
- 27.Gac S.L., Zwaan E., Ohl C.D. Sonoporation of suspension cells with a single cavitation bubble in a microfluidic confinement. Lab Chip. 2007;7:1666–1672. doi: 10.1039/b712897p. [DOI] [PubMed] [Google Scholar]
- 28.Lee S., Anderson T., Doukas A.G. Alteration of cell membrane by stress waves in vitro. Ultrasound Med. Biol. 1996;22:1285–1293. doi: 10.1016/s0301-5629(96)00149-4. [DOI] [PubMed] [Google Scholar]
- 29.Sankin G.N., Yuan F., Zhong P. Pulsating tandem microbubble for localized and directional single-cell membrane poration. Phys. Rev. Lett. 2010;105:078101. doi: 10.1103/PhysRevLett.105.078101. [DOI] [PMC free article] [PubMed] [Google Scholar]
- 30.Brown E.B., Wu E.S., Webb W.W. Measurement of molecular diffusion in solution by multiphoton fluorescence photobleaching recovery. Biophys. J. 1999;77:2837–2849. doi: 10.1016/S0006-3495(99)77115-8. [DOI] [PMC free article] [PubMed] [Google Scholar]
- 31.Edwards D.A., Prausnitz M.R., Weaver J.C. Analysis of enhanced transdermal transport by skin electroporation. J. Control. Release. 1995;34:211–221. [Google Scholar]
- 32.Wu T.-H., Kalim S., Chiou P.-Y. Image patterned molecular delivery into live cells using gold particle coated substrates. Opt. Express. 2010;18:938–946. doi: 10.1364/OE.18.000938. [DOI] [PMC free article] [PubMed] [Google Scholar]
- 33.Photos P.J., Bermudez H., Discher D.E. Nuclear pores and membrane holes: generic models for confined chains and entropic barriers in pore stabilization. Soft Matter. 2007;3:364–371. doi: 10.1039/b611412c. [DOI] [PubMed] [Google Scholar]
- 34.Bermudez H., Aranda-Espinoza H., Discher D. Pore stability and dynamics in polymer membranes. Europhys. Lett. 2003;64:550–556. [Google Scholar]
- 35.Chang D.C., Chassy B.M., Sowers A.E. Academic Press; New York: 1992. Guide to Electroporation and Electrofusion. [Google Scholar]
- 36.Kinosita K., Jr., Tsong T.Y. Formation and resealing of pores of controlled sizes in human erythrocyte membrane. Nature. 1977;268:438–441. doi: 10.1038/268438a0. [DOI] [PubMed] [Google Scholar]
- 37.Teissie J., Golzio M., Rols M.P. Mechanisms of cell membrane electropermeabilization: a minireview of our present (lack of?) knowledge. Biochim. Biophys. Acta. 2005;1724:270–280. doi: 10.1016/j.bbagen.2005.05.006. [DOI] [PubMed] [Google Scholar]
- 38.Diez-Silva M., Dao M., Suresh S. Shape and biomechanical characteristics of human red blood cells in health and disease. MRS Bull. 2010;35:382–388. doi: 10.1557/mrs2010.571. [DOI] [PMC free article] [PubMed] [Google Scholar]
- 39.Hategan A., Law R., Discher D.E. Adhesively-tensed cell membranes: lysis kinetics and atomic force microscopy probing. Biophys. J. 2003;85:2746–2759. doi: 10.1016/s0006-3495(03)74697-9. [DOI] [PMC free article] [PubMed] [Google Scholar]
- 40.Evans E., Ludwig F. Dynamic strengths of molecular anchoring and material cohesion in fluid biomembranes. J. Phys. Condens. Matter. 2000;12:A315. [Google Scholar]
- 41.Yoganathan A.P., He Z., Casey Jones S. Fluid mechanics of heart valves. Annu. Rev. Biomed. Eng. 2004;6:331–362. doi: 10.1146/annurev.bioeng.6.040803.140111. [DOI] [PubMed] [Google Scholar]
- 42.Deutsch S., Tarbell J., Fontaine A. Experimental fluid mechanics of pulsatile artificial blood pumps. Annu. Rev. Fluid Mech. 2006;38:65–86. [Google Scholar]
- 43.Arora D., Behr M., Pasquali M. A tensor-based measure for estimating blood damage. Artif. Organs. 2004;28:1002–1015. doi: 10.1111/j.1525-1594.2004.00072.x. [DOI] [PubMed] [Google Scholar]
- 44.Xu C., Prince J.L. Snakes, shapes, and gradient vector flow. IEEE Trans. Image Process. 1998;7:359–369. doi: 10.1109/83.661186. [DOI] [PubMed] [Google Scholar]
Associated Data
This section collects any data citations, data availability statements, or supplementary materials included in this article.