Abstract
GABAergic inhibition plays a critical role in shaping neuronal activity in the neocortex. Numerous experimental investigations have examined perisomatic inhibitory synapses, which control action potential output from pyramidal neurons. However, most inhibitory synapses in the neocortex are formed onto pyramidal cell dendrites, where theoretical studies suggest they may focally regulate cellular activity. The precision of GABAergic control over dendritic electrical and biochemical signaling is unknown. Using cell type-specific optical stimulation in combination with 2-photon calcium (Ca(2+)) imaging, we show that somatostatin-expressing interneurons exert compartmentalized control over postsynaptic Ca(2+) signals within individual dendritic spines. This highly focal inhibitory action is mediated by a subset of GABAergic synapses that directly target spine heads. GABAergic inhibition thus participates in localized control of dendritic electrical and biochemical signaling.
A challenge to elucidating the function of synaptic inhibition is the diversity of GABAergic interneurons found in cortical circuits (1–3). Several interneuron classes, including those that express somatostatin (SOM-INs), target the dendrites of excitatory, glutamatergic pyramidal cells (3–5). SOM-INs regulate the initiation of action potential bursts generated via active currents in postsynaptic dendrites (6–8). We hypothesized that these inputs might also exert focal influence over dendritic signaling. Here, we utilized electrophysiological, optical, and computational approaches to investigate the localized actions of GABAergic inhibition in pyramidal cell dendrites.
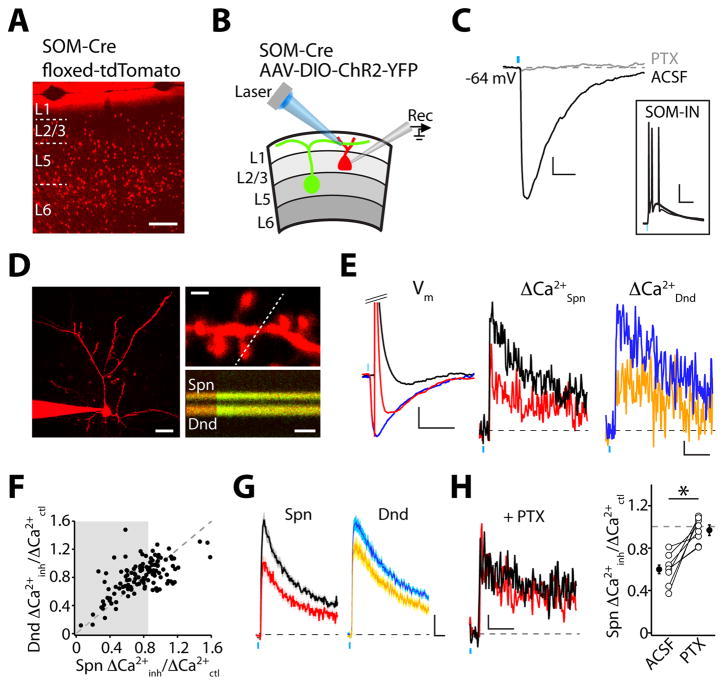
To activate dendritic GABAergic synapses, we used a somatostatin-Cre mouse line (9) (Fig. 1A, Fig. S1A) to conditionally express Channelrhodopsin-2 (ChR2) (10) in SOM-INs of the prefrontal cortex (Fig. S1B–C). In acute brain slices prepared 2–3 weeks after viral injection, pulses of light (5 ms, 473 nm) delivered through the microscope objective evoked action potentials (APs) in fluorescently identified SOM-INs (Fig. S2A–C). Whole-cell recordings in layer 2/3 pyramidal neurons revealed corresponding inhibitory postsynaptic potentials (IPSPs) (Fig. 1B–C, Fig. S2D–F). For subsequent experiments, GABAA-mediated IPSPs were isolated by including the selective GABAB antagonist CGP-55845 in the perfusate (Fig. 1C). IPSPs exhibited a reversal potential of −69.9±1.5 mV (n=5) that did not differ significantly from the value recorded via gramicidin-based perforated patch (−72.4±1.7, n=6, p=0.3, Fig. S2G–H).
Fig. 1.
SOM-INs mediate inhibition of dendritic Ca(2+) signals. (A) td-Tomato expression in the prefrontal cortex of SOM-Cre;Ai9 mice. Scale bar: 200 μm. (B) Recording configuration. (C) Light-evoked IPSPs (ACSF) are abolished by picrotoxin (PTX). Scale bars: 1 mV, 50 ms. Inset: Light-evoked APs in a SOM-IN. Scale bars: 20 mV, 50 ms. (D) Left, 2PLSM image of a layer 2/3 pyramidal neuron. Scale bar: 25 μm. Right, AP-evoked ΔCa(2+) in the spine and dendritic shaft indicated by the dashed line. Scale bars: 1 μm, 50 ms. (E) Left, Vm during AP (black), IPSP (blue), and IPSP-AP (red). Scale bars: 2 mV, 100 ms. Middle and right, ΔCa(2+) (Spn, Dnd) in response to AP (black, blue) or IPSP-AP (red, orange). Scale bars: 1% ΔG/Gsat, 100 ms. (F) Ca(2+) inhibition for dendritic shafts versus spines. Gray region indicates significant spine inhibition. (G) Average Ca(2+) signals (±SEM) evoked by AP or IPSP-AP for locations showing significant inhibition. Scale bars: 1% ΔG/Gsat, 50 ms. (H) Left, Ca(2+) transients from spine in (E), recorded in picrotoxin. Scale bars: 1% ΔG/Gsat, 100 ms. Right, Average Ca(2+) inhibition before (ACSF) and after GABAA block (PTX). * indicates p<0.05 (paired Student’s t-test).
To determine how inhibition influences dendritic activity in pyramidal neurons, we used 2-photon laser scanning microscopy (2PLSM) to image calcium (Ca(2+)) in apical dendritic spines and shafts. Ca(2+) transients (ΔCa(2+)) were evoked by somatic APs (Fig. 1D–E, Fig. S3A–B) and were mediated by voltage-gated Ca(2+) channels (VGCCs) (Fig. S3C). We compared AP-evoked Ca(2+) signals under control conditions (ΔCa(2+)ctl) and when preceded by an IPSP (ΔCa(2+)inh) (15 ms interval) evoked by a light pulse targeting the imaged region (Fig. 1E). In 57% (73/127) of randomly imaged spines, optical activation of SOM-INs produced a significant reduction (>15%, see Methods and Fig. S3D–F) in the AP-evoked ΔCa(2+). At these locations, the average Ca(2+) inhibition (ΔCa(2+)inh/ΔCa(2+)ctl) was significantly greater for spines than for neighboring dendritic shafts (0.60±0.02 vs. 0.78±0.03, p<0.001, Fig. 1F–G). The inhibition of ΔCa(2+) was abolished by application of the GABAA antagonist picrotoxin (n=8, p<0.05, Fig. 1H). Similar Ca(2+) inhibition was seen in basal dendrites (23/49 spines, 0.73±0.02 vs. 0.87±0.02 for spines and shafts, respectively, p<0.01, Fig. S4).
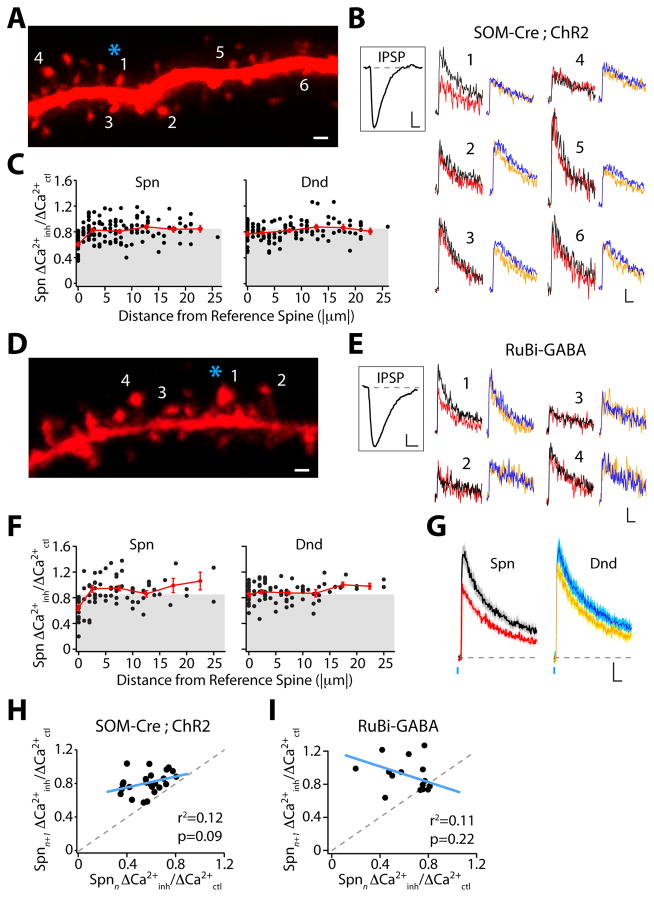
We frequently observed inhibited and uninhibited spines in close proximity, suggesting compartmentalized GABAergic control of Ca(2+) signaling. We therefore imaged Ca(2+) inhibition within a small dendritic region. Spines adjacent to an inhibited “reference spine” typically showed little modulation despite the presence of a somatic IPSP (Fig. 2A–B, Fig. S5A–B). We generated “maps” demonstrating heterogeneous inhibition over short distances (Fig. 2C). There was significantly greater inhibition for each reference spine than its adjacent neighbor (0.58 ± 0.03 vs. 0.82 ± 0.03, p<0.001, n=22 maps), and inhibition between neighbors was not correlated (Pearson r2=0.12, p=0.09, Fig. 2H). Inhibition in individual spines was not correlated to the magnitude of ΔCa(2+)ctl (Fig. S5C) and was unchanged for experiments conducted at near-physiological temperature or with GABAB receptor function intact (Fig. S5D).
Fig. 2.
GABAergic dendritic inhibition is highly compartmentalized. (A) Inhibition mapping utilizing ChR2 stimulation (asterisk) of SOM-INs. Scale bar: 1 μm. (B) ΔCa(2+) evoked by AP and IPSP-AP for spines (black and red, respectively) and dendritic shafts (blue and orange, respectively) indicated in (A). Scale bars: 2% ΔG/Gsat, 50 ms. Inset: somatic IPSP. Scale bars: 1 mV, 100 ms. (C) Population data for Ca(2+) inhibition versus distance from the reference spine. Average binned (5 μm) data shown in red. Gray region indicates significant inhibition. (D) Inhibition mapping utilizing GABA uncaging. Scale bar: 1 μm. (E) ΔCa(2+) evoked by AP and IPSP-AP. Scale bars: 2% ΔG/Gsat, 50 ms. Inset: somatic IPSP. Scale bar: 1 mV, 100 ms. (F) As in (C) for GABA uncaging. (G) Average Ca(2+) signal (± SEM) for GABA uncaging experiments. Scale bars: 2% ΔG/Gsat, 50 ms. (H) Lack of correlation between ChR2-evoked inhibition for reference (n) and adjacent (n+1) spines. (I) As in (H) for GABA uncaging.
We further characterized inhibitory compartmentalization using photoactivation of the caged compound RuBi-GABA (11). Brief light pulses (2 ms, 473 nm) evoked IPSPs in pyramidal neurons bathed in RuBi-GABA (10.8 μM) with much smaller amplitude but similar kinetics as those produced by stimulation of SOM-INs (Fig. S6A–C). Using GABA uncaging, 51% (44/87) of randomly imaged apical spines showed significant inhibition of ΔCa(2+). Inhibition was stronger in spines than in dendritic shafts (0.65±0.02 vs. 0.79±0.03, p<0.0001, n=59, Fig. 2F–G, Fig. S6D) and was blocked by picrotoxin (Fig. S6E–F). Inhibitory compartmentalization was similar to that seen using optical stimulation of SOM-INs (Fig. 2D–F). Ca(2+) inhibition for the reference spine was significantly greater than for the adjacent neighbor (0.64 ± 0.05 vs. 0.90 ± 0.06, p<0.01, n=15 maps) and these values were uncorrelated (Pearson r2=0.11, p=0.22, Fig. 2I).
Increasing intracellular chloride caused IPSPs to be depolarizing from a Vm of −60 mV and largely eliminated inhibition of ΔCa(2+) (n=24, p<0.0001 vs. control, Fig. S7A–B), suggesting that local membrane hyperpolarization contributes to reduced Ca(2+) influx. VGCCs with more depolarized activation thresholds should therefore exhibit greater sensitivity to GABAergic inhibition. Indeed, blockade of high-threshold (L- and N/P/Q-type) but not lower-threshold (T- and R-type) channels significantly reduced the amount of Ca(2+) inhibition evoked by GABA uncaging (Fig. S7C).
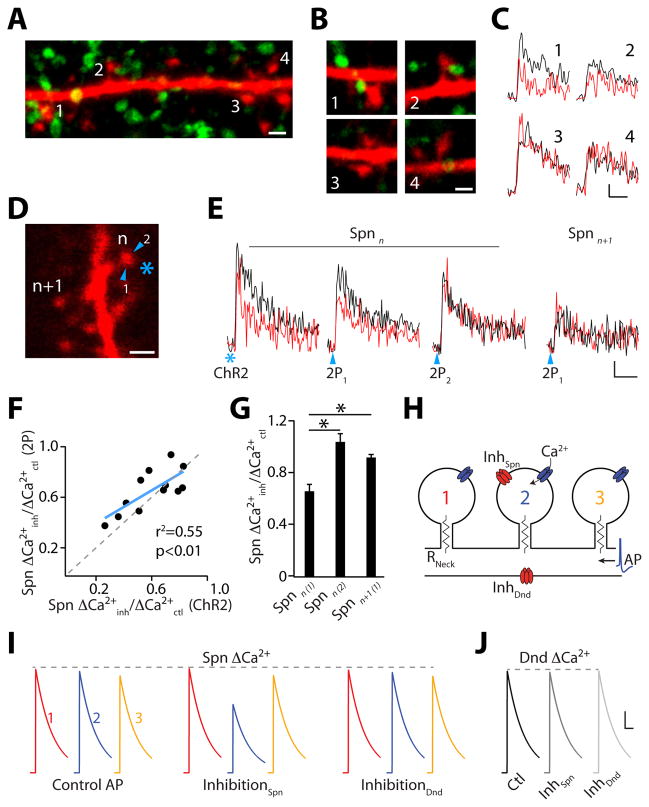
Many spines receive direct GABAergic input (5, 12, 13), and we wondered whether SOM-INs might contribute to this pool of synapses. We reconstructed apical dendrites of recorded neurons from ChR2 experiments and found 18.5% of spines (n=1185 spines, 4 cells) expressed the inhibitory synaptic protein gephyrin while 43.5% (n=3058 spines, 9 cells) appeared to be contacted by a presynaptic bouton originating from a SOM-IN (Fig. S8A-B, see Methods). For a subset of cells (n=3), we recovered spines with corresponding Ca(2+) imaging. In all cases, Ca(2+) inhibition was only observed for spines with an apposed SOM-IN terminal (Fig. 3A–C, Fig. S8C–H).
Fig. 3.
GABAergic synapses on spines mediate local Ca(2+) inhibition. (A) Confocal projection of a dendrite (red) and ChR2-EYFP-positive boutons (green). Scale bar: 1 μm. (B) Single section images of spines from (A). Scale bar: 1 μm. (C) ΔCa(2+) measured in spines from (B) for AP (black) and IPSP-AP (red). Scale bars: 1% ΔG/Gsat, 50 ms. (D) Inhibition mapping utilizing ChR2 (asterisk) or 2PLUGABA (arrowheads). Scale bar: 1 μm. (E) ΔCa(2+) in reference spine (n) and neighbor (n+1) for AP (black) and IPSP-AP (red). Scale bars: 2% ΔG/Gsat, 50 ms. (F) Correlation between ChR2- and 2PLUGABA-evoked inhibition. (G) Average Ca(2+) inhibition (±SEM) evoked by 2PLUGABA. (H) Computational model of dendritic inhibition. (I) Simulated GABAergic input selectively inhibits ΔCa(2+) in spine 2. GABAergic input onto dendritic shaft has minimal effect on ΔCa(2+). (J) GABAergic input does not inhibit Ca(2+) in the dendritic shaft. Scale bars (I and J): 100 nM, 100 ms. * indicates p<0.05 (paired Student’s t-test).
We next confirmed the spatial precision of GABAergic inhibition using diffraction-limited 2-photon laser uncaging (2PLU) of CDNI-GABA (14, see Methods). 2PLUGABA resulted in Ca(2+) inhibition that was similar in magnitude to that produced by ChR2 activation, highly sensitive to the precise location of the uncaging spot around the spine perimeter, and isolated from neighboring spines (Fig. 3D–G).
To see if GABAergic synapses onto spines are necessary for compartmentalized inhibition, we simulated AP-evoked Ca(2+) influx into dendritic spines and shafts (Fig. 3H, Fig. S9, see Methods). GABAergic input to a single spine head inhibited ΔCa(2+) only in the targeted spine, whereas inhibition targeting the dendritic shaft had minimal effect on nearby spines (Fig. 3I). Moreover, ΔCa(2+) in the dendritic shaft was unaffected by GABAergic input to either the spine head or shaft (Fig. 3J). Ca(2+) inhibition was mediated by a compartmentalized reduction in input impedance, reducing AP amplitude in the targeted spine (Fig. S9A–D). The magnitude of inhibition was influenced by spine neck resistance, chloride reversal potential, and VGCC activation threshold, but was independent of VGCC density (Fig. S9E–G). Inhibition (>15%) of dendritic ΔCa(2+) could only be obtained by increasing the dendritic GABAergic conductance 10-fold (Fig. S9H). A current-based inhibitory synapse that generated a similar IPSP in the absence of a conductance change produced minimal Ca(2+) inhibition (Fig. S9I).
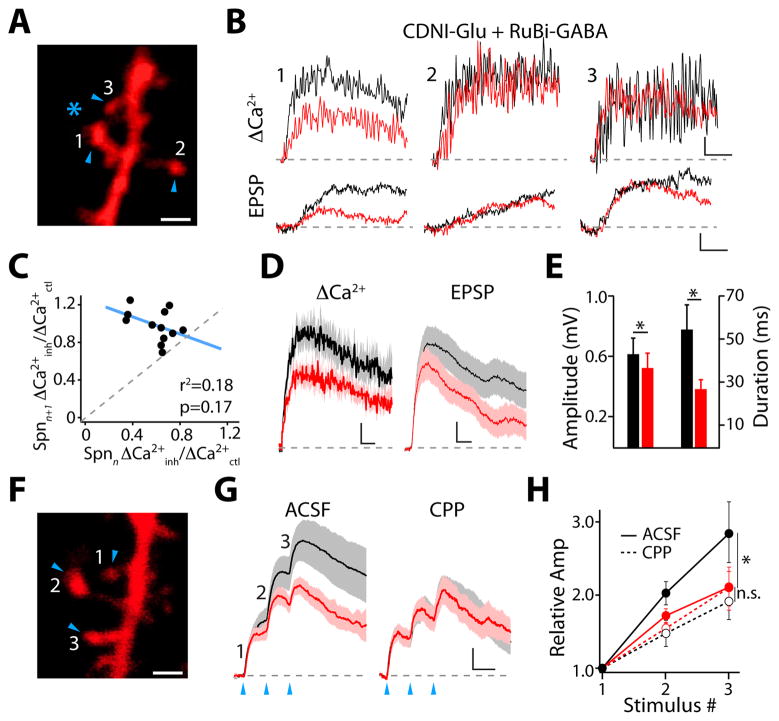
Finally, we asked whether localized inhibition occurred for synaptic Ca(2+) transients and excitatory postsynaptic potentials (EPSPs). We combined 1-photon RuBi-GABA uncaging with 2PLU of CDNI-Glutamate (2PLUGlu, 15, see Methods) and imaged ΔCa(2+) in spines (Fig. 4A–D). Inhibition of synaptic ΔCa(2+) was strongly compartmentalized with no correlation between neighboring spines (0.60±0.05 vs. 0.98±05 for reference spine and adjacent neighbor, respectively, p<0.01, n=12, Pearson r2=0.18, p=0.17, Fig. 4A–D). 2PLUGlu-evoked EPSPs were similarly inhibited (Fig. 4B,D), exhibiting reductions in both amplitude and duration (Fig. 4D–E) that suggested inhibition might influence synaptic integration. GABAergic input significantly reduced the summation of responses evoked by glutamate uncaging on neighboring spines (p<0.05, n=11, Fig. 4F–H). The effect on summation was eliminated after blocking NMDA-type glutamate receptors (NMDARs, n=7, Fig. 4G–H). Furthermore, summation was not reduced for cases where local GABAAR activation evoked an IPSP but did not inhibit spine ΔCa(2+) (n=8, Fig. S10).
Fig. 4.
Dendritic inhibition regulates synaptic integration. (A) Inhibition of responses evoked by 2PLUGlu (arrowheads) utilizing 1-photon GABA uncaging (asterisk). Scale bar: 1 μm. (B) ΔCa(2+) and voltage transients for EPSP (black) and IPSP-EPSP (red) for spines indicated in (A). Scale bars: 4% ΔG/Gsat, 50 ms (upper), 0.1 mV, 5 ms (lower). (C) Ca(2+) inhibition is not correlated between neighboring spines. (D) Average ΔCa(2+) and somatic voltage transients (± SEM) for EPSP alone (black) and IPSP-EPSP (red) pairing. Scale bars: 2% ΔG/Gsat, 50 ms (left), 0.1 mV, 10 ms (right). (E) Average amplitude and duration (±SEM) of voltage transients for EPSP (black) and IPSP-EPSP pairing (red). (F) Integration of responses evoked by 2PLUGlu (arrowheads). Scale bar: 1 μm. (G) Average voltage transients (± SEM) for EPSP (black) and IPSP-EPSP (red) evoked by 2PLUGlu on three neighboring spines, recorded in control ACSF (left) or with NMDARs blocked by CPP (right). Scale bars: 0.25 mV, 20 ms. (H) Relative summation of EPSPs (black) or IPSP-EPSPs (red), recorded in control ACSF or with CPP. * indicates p<0.05 (Wilcoxon matched pairs test).
Our results indicate that dendritic spines compartmentalize GABAergic inhibition, limiting both AP- and synaptically-evoked Ca(2+) influx and regulating NMDAR-dependent synaptic integration. These findings establish a new mechanism for the synapse-specific control of Ca(2+) signaling and downstream cellular processes such as synaptic plasticity.
Theoretical studies suggested that inhibition might regulate dendritic signaling near synaptic contacts (16–18, but see 19). Subsequent experimental data demonstrated that GABA receptors can inhibit regenerative voltage-dependent dendritic spikes, controlling the production of AP bursts at the soma (6–8, 20). These findings were mediated in part by GABAB-dependent modulation of VGCCs and NMDARs (8, 21) and suggested that inhibition acts with lower spatial resolution than glutamatergic excitation, which exhibits compartmentalization of electrical and biochemical signals within single spines (22, 23). However, our data indicate that the spine head similarly restricts GABAA-mediated inhibition. The model further suggests that, in addition to the chloride reversal potential, spine neck resistance influences the efficacy of GABAergic synapses onto spine heads as occurs for glutamatergic inputs (24, 25, 26). Notably, our experimental data was closely modeled using a neck resistance of 520 MΩ, similar to the value reported for hippocampal pyramidal neurons (26). Both neck resistance and chloride reversal are modulated by development and experience (27, 28), suggesting the impact of dendritic inhibition may be similarly regulated.
Dendritic Ca(2+) influx plays a key role in the induction of plasticity at glutamatergic synapses (29), and inhibition can serve as a negative regulator of plasticity (30–32). Our results suggest that this control occurs at a previously unappreciated spatial scale, enabling dendrite-targeting interneurons to influence individual glutamatergic inputs. This observation is particularly relevant given the growing attention on links between perturbed GABAergic inhibition, alterations in developing neuronal circuits, and neuropsychiatric disorders such as schizophrenia and autism (33, 34).
Why do certain spines receive GABAergic inputs? One possibility is that GABA receptors are recruited by the presence of specific glutamatergic afferents, as proposed for thalamo-recipient spines in frontal or visual cortex (35, 36). Additionally, recruitment of GABAA receptors might be activity-dependent (37). This hypothesis is supported by evidence that spine-targeting GABAergic inputs exhibit distinctly high rates of turnover in vivo (12, 36). Future experiments are necessary to determine the existence of feedback loops between dendritic Ca(2+) signals and the formation and stabilization of GABAergic synapses.
Supplementary Material
Acknowledgments
The authors thank Gordon M. Shepherd for discussions of spine function. We thank Pietro DeCamilli, Susumu Tomita, Jess Cardin, and members of the Higley Laboratory for comments during the preparation of this manuscript. ChR2 plasmids were a gift from Karl Deisseroth, Stanford University; TTA-A2 was a gift from Bruce Bean, Harvard Medical School; SOM-Cre mice were provided by Josh Huang, Cold Spring Harbor Laboratory. The work was funded by grants from the Epilepsy Foundation (CQC, MJH), the Yale Brown-Coxe Memorial Fund (GL), the Klingenstein Foundation (MJH), the Sloan Foundation (MJH), the Human Frontier Science Project (GED), and awards from the NIH: NS011613 (NTC), DC009977 (NTC, TMM), MH099045 (MJH), GM053395 and NS069720 (GED).
References and Notes
- 1.Gupta A, Wang Y, Markram H. Science. 2000;287:273. doi: 10.1126/science.287.5451.273. [DOI] [PubMed] [Google Scholar]
- 2.Fishell G, Rudy B. Annual review of neuroscience. 2011;34:535. doi: 10.1146/annurev-neuro-061010-113717. [DOI] [PMC free article] [PubMed] [Google Scholar]
- 3.Dumitriu D, Cossart R, Huang J, Yuste R. Cerebral cortex. 2007;17:81. doi: 10.1093/cercor/bhj126. [DOI] [PubMed] [Google Scholar]
- 4.Somogyi P, Tamas G, Lujan R, Buhl EH. Brain research reviews. 1998;26:113. doi: 10.1016/s0165-0173(97)00061-1. [DOI] [PubMed] [Google Scholar]
- 5.Wang Y, et al. The Journal of physiology. 2004;561:65. doi: 10.1113/jphysiol.2004.073353. [DOI] [PMC free article] [PubMed] [Google Scholar]
- 6.Miles R, Toth K, Gulyas AI, Hajos N, Freund TF. Neuron. 1996;16:815. doi: 10.1016/s0896-6273(00)80101-4. [DOI] [PubMed] [Google Scholar]
- 7.Tsubokawa H, Ross WN. Journal of neurophysiology. 1996;76:2896. doi: 10.1152/jn.1996.76.5.2896. [DOI] [PubMed] [Google Scholar]
- 8.Perez-Garci E, Gassmann M, Bettler B, Larkum ME. Neuron. 2006;50:603. doi: 10.1016/j.neuron.2006.04.019. [DOI] [PubMed] [Google Scholar]
- 9.Taniguchi H, et al. Neuron. 2011;71:995. doi: 10.1016/j.neuron.2011.07.026. [DOI] [PMC free article] [PubMed] [Google Scholar]
- 10.Zhang F, Wang LP, Boyden ES, Deisseroth K. Nature methods. 2006;3:785. doi: 10.1038/nmeth936. [DOI] [PubMed] [Google Scholar]
- 11.Rial Verde EM, Zayat L, Etchenique R, Yuste R. Frontiers in neural circuits. 2008;2:2. doi: 10.3389/neuro.04.002.2008. [DOI] [PMC free article] [PubMed] [Google Scholar]
- 12.Chen JL, et al. Neuron. 2012;74:361. doi: 10.1016/j.neuron.2012.02.030. [DOI] [PMC free article] [PubMed] [Google Scholar]
- 13.Tamas G, Buhl EH, Somogyi P. The Journal of physiology. 1997;500(Pt 3):715. doi: 10.1113/jphysiol.1997.sp022054. [DOI] [PMC free article] [PubMed] [Google Scholar]
- 14.Ellis-Davies GC, Matsuzaki M, Paukert M, Kasai H, Bergles DE. The Journal of neuroscience. 2007;27:6601. doi: 10.1523/JNEUROSCI.1519-07.2007. [DOI] [PMC free article] [PubMed] [Google Scholar]
- 15.Matsuzaki M, Hayama T, Kasai H, Ellis-Davies GC. Nature chemical biology. 2010;6:255. doi: 10.1038/nchembio.321. [DOI] [PMC free article] [PubMed] [Google Scholar]
- 16.Koch C, Poggio T. Proceedings of the royal society of London: B. 1983;218:455. doi: 10.1098/rspb.1983.0051. [DOI] [PubMed] [Google Scholar]
- 17.Koch C, Poggio T, Torre V. Proceedings of the National Academy of Sciences of the United States of America. 1983;80:2799. doi: 10.1073/pnas.80.9.2799. [DOI] [PMC free article] [PubMed] [Google Scholar]
- 18.Segev I, Rall W. Journal of neurophysiology. 1988;60:499. doi: 10.1152/jn.1988.60.2.499. [DOI] [PubMed] [Google Scholar]
- 19.Qian N, Sejnowski TJ. Proceedings of the National Academy of Sciences of the United States of America. 1990;87:8145. doi: 10.1073/pnas.87.20.8145. [DOI] [PMC free article] [PubMed] [Google Scholar]
- 20.Jadi M, Polsky A, Schiller J, Mel BW. PLoS computational biology. 2012;8:e1002550. doi: 10.1371/journal.pcbi.1002550. [DOI] [PMC free article] [PubMed] [Google Scholar]
- 21.Chalifoux JR, Carter AG. Neuron. 2010;66:101. doi: 10.1016/j.neuron.2010.03.012. [DOI] [PMC free article] [PubMed] [Google Scholar]
- 22.Alvarez VA, Sabatini BL. Annual review of neuroscience. 2007;30:79. doi: 10.1146/annurev.neuro.30.051606.094222. [DOI] [PubMed] [Google Scholar]
- 23.Matsuzaki M, Honkura N, Ellis-Davies GC, Kasai H. Nature. 2004;429:761. doi: 10.1038/nature02617. [DOI] [PMC free article] [PubMed] [Google Scholar]
- 24.Bloodgood BL, Giessel AJ, Sabatini BL. PLoS biology. 2009;7:e1000190. doi: 10.1371/journal.pbio.1000190. [DOI] [PMC free article] [PubMed] [Google Scholar]
- 25.Grunditz A, Holbro N, Tian L, Zuo Y, Oertner TG. The Journal of neuroscience. 2008;28:13457. doi: 10.1523/JNEUROSCI.2702-08.2008. [DOI] [PMC free article] [PubMed] [Google Scholar]
- 26.Harnett MT, Makara JK, Spruston N, Kath WL, Magee JC. Nature. 2012;491:599. doi: 10.1038/nature11554. [DOI] [PMC free article] [PubMed] [Google Scholar]
- 27.Bloodgood BL, Sabatini BL. Science. 2005;310:866. doi: 10.1126/science.1114816. [DOI] [PubMed] [Google Scholar]
- 28.Fiumelli H, Woodin MA. Current opinion in neurobiology. 2007;17:81. doi: 10.1016/j.conb.2007.01.002. [DOI] [PubMed] [Google Scholar]
- 29.Sjostrom PJ, Nelson SB. Current opinion in neurobiology. 2002;12:305. doi: 10.1016/s0959-4388(02)00325-2. [DOI] [PubMed] [Google Scholar]
- 30.Couey JJ, et al. Neuron. 2007;54:73. doi: 10.1016/j.neuron.2007.03.006. [DOI] [PubMed] [Google Scholar]
- 31.Lu H, Cheng PL, Lim BK, Khoshnevisrad N, Poo MM. Neuron. 2010;67:821. doi: 10.1016/j.neuron.2010.08.012. [DOI] [PMC free article] [PubMed] [Google Scholar]
- 32.Wigstrom H, Gustafsson B. Nature. 1983;301:603. doi: 10.1038/301603a0. [DOI] [PubMed] [Google Scholar]
- 33.Gonzalez-Burgos G, Hashimoto T, Lewis DA. Current psychiatry reports. 2010;12:335. doi: 10.1007/s11920-010-0124-8. [DOI] [PMC free article] [PubMed] [Google Scholar]
- 34.Rubenstein JL, Merzenich MM. Genes, brain, and behavior. 2003;2:255. doi: 10.1034/j.1601-183x.2003.00037.x. [DOI] [PMC free article] [PubMed] [Google Scholar]
- 35.Kubota Y, Hatada S, Kondo S, Karube F, Kawaguchi Y. The Journal of neuroscience. 2007;27:1139. doi: 10.1523/JNEUROSCI.3846-06.2007. [DOI] [PMC free article] [PubMed] [Google Scholar]
- 36.van Versendaal D, et al. Neuron. 2012;74:374. doi: 10.1016/j.neuron.2012.03.015. [DOI] [PubMed] [Google Scholar]
- 37.Baho E, Di Cristo G. The Journal of neuroscience. 2012;32:911. doi: 10.1523/JNEUROSCI.4352-11.2012. [DOI] [PMC free article] [PubMed] [Google Scholar]
- 38.Sabatini BL, Svoboda K. Nature. 2000;408:589. doi: 10.1038/35046076. [DOI] [PubMed] [Google Scholar]
- 39.Atasoy D, Aponte Y, Su HH, Sternson SM. The Journal of neuroscience. 2008;28:7025. doi: 10.1523/JNEUROSCI.1954-08.2008. [DOI] [PMC free article] [PubMed] [Google Scholar]
- 40.Madisen L, et al. Nature neuroscience. 2010;13:133. doi: 10.1038/nn.2467. [DOI] [PMC free article] [PubMed] [Google Scholar]
- 41.Hines ML, Carnevale NT. Neural computation. 1997;9:1179. doi: 10.1162/neco.1997.9.6.1179. [DOI] [PubMed] [Google Scholar]
- 42.Mainen ZF, Sejnowski TJ. Nature. 1996;382:363. doi: 10.1038/382363a0. [DOI] [PubMed] [Google Scholar]
Associated Data
This section collects any data citations, data availability statements, or supplementary materials included in this article.


