Abstract
It has been shown that some dynamic features hidden in the time series of complex systems can be uncovered if we analyze them in a time domain called natural time χ. The order parameter of seismicity introduced in this time domain is the variance of χ weighted for normalized energy of each earthquake. Here, we analyze the Japan seismic catalog in natural time from January 1, 1984 to March 11, 2011, the day of the M9 Tohoku earthquake, by considering a sliding natural time window of fixed length comprised of the number of events that would occur in a few months. We find that the fluctuations of the order parameter of seismicity exhibit distinct minima a few months before all of the shallow earthquakes of magnitude 7.6 or larger that occurred during this 27-y period in the Japanese area. Among the minima, the minimum before the M9 Tohoku earthquake was the deepest. It appears that there are two kinds of minima, namely precursory and nonprecursory, to large earthquakes.
Keywords: criticality, seismic electric signals
For a time series comprised of N events, we define the natural time for the occurrence of the kth event by  (1), which means that we ignore the time intervals between consecutive events, but preserve their order. We also preserve their energy
  . We then study the evolution of the pair
 , where
  is the normalized energy. We postulated that the approach of a dynamical system to criticality can be identified by the variance
  of natural time χ weighted for
 , namely,
 |
Earthquakes (EQs hereafter) exhibit complex correlations in time, space, and magnitude, and the opinion prevails (e.g., ref. 2 and references therein) that the EQs are critical phenomena. In natural time analysis of seismicity, the quantity  calculated from seismic catalogs serves as an order parameter (3, 4). Experiences have shown that the mainshock occurs in a few days to 1 wk after the
  value in the candidate epicentral area approaches 0.070 (5). This was found useful in narrowing the lead time of EQ prediction. However, to trace the time evolution of
  value, one needs to start the analysis of the seismic catalog at some time before the yet-to-occur mainshock. We chose, for the starting time for analysis, the initiation time of seismic electric signal (SES) activity. SESs are low-frequency (
 1 Hz) electric signals that precede EQs (6). The reason for this choice was based on the consideration that SESs are emitted when the focal zone enters the critical stage (7). In the case of the lack of SES data, as in the Tohoku EQ, we cannot adopt this approach. In this study, therefore, we instead examine the fluctuations of
  near criticality, i.e., near the EQ occurrence. To compute the fluctuations, we apply the following procedure.
First, take an excerpt comprised of W (≥100) successive EQs from the seismic catalog. We then form its subexcerpts consisting of the nth to (n + 5)th EQs, (n = 1, 2,…,W-5) and compute  for each of them. In so doing, we assign
  and the normalized energy
  , k = 1, 2,…,6 to the kth member of the subexcerpt. Note that at least 6 EQs are needed for obtaining reliable
  (3). We iterate the same process for new subexcerpts consisting of 7 members, 8 members, …, and finally W members. Then, we compute the average
  and the SD
  of the thus-obtained ensemble of (W − 4)(W − 5)/2
  values. The variability (4, 8) of
  for this excerpt W (≥100) is defined to be
  and is assigned to the (W + 1)th EQ, the target EQ.
The time evolution of the  -value can be pursued by sliding the excerpt through the EQ catalog. Through the same process as explained above, the
  -values to be assigned to the (W + 2)th, (W + 3)th, EQs in the catalog will be obtained.
Data Analyzed
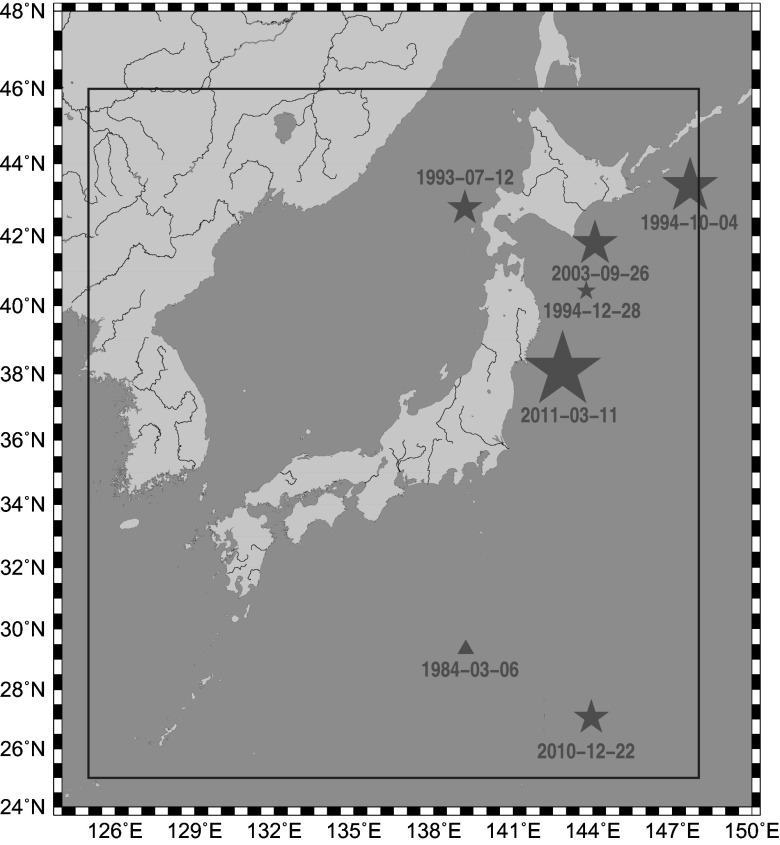
For our analysis, we used the Japan Meteorological Agency (JMA) seismic catalog and considered all of the EQs in the period from 1984 to the time of the M9 Tohoku EQ, within the area 25°–46°N, 125°–148°E, which covers the whole Japanese region (Fig. 1). The energy of EQs was obtained from MJMA after converting (9) to the moment magnitude Mw defined by Kanamori (10). Setting a threshold MJMA = 3.5 to assure the data completeness, we are left with 47,204 EQs in the concerned period of about 326 mo. Thus, we have on the average ∼102 EQs per month. We chose the values W = 200, 300, and 400, which would cover a period of a few months before each target EQ. This choice of a few months is based on the experience that the lead time of SES activities is of this order both in Japan (11) and Greece (5, 7, 12).
Fig. 1.
Epicenters (stars) of all major EQs with magnitude 7.6 or larger within the area  since January 1, 1984 until the M9 Tohoku EQ (Table 1). The deep EQ on March 6, 1984 is depicted by a triangle.
Minimum of the Variability  Before the M9 Tohoku EQ
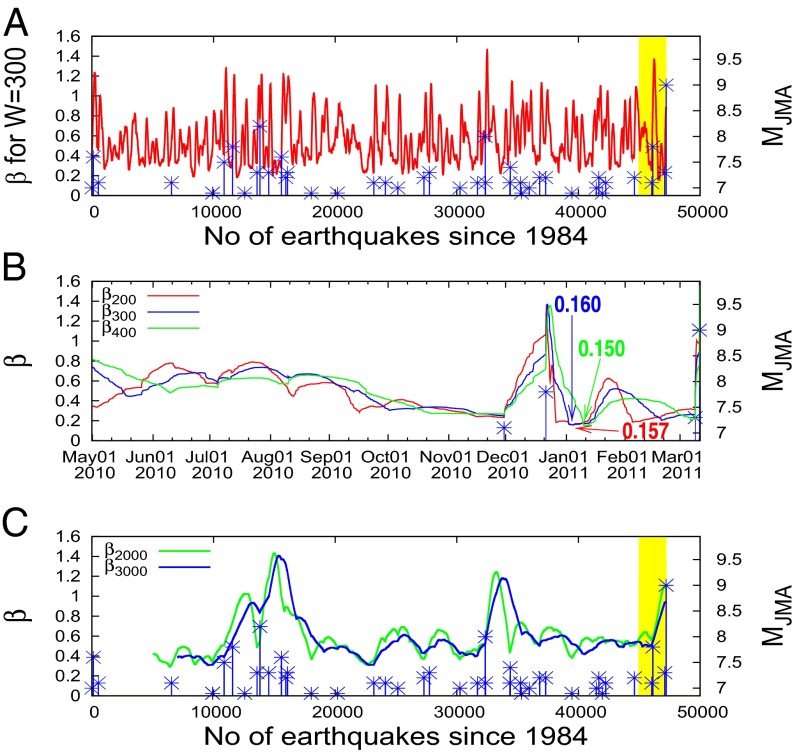
Fig. 2A depicts about 47,200  -values calculated for W = 300 versus the target EQ number from 1984 to the day of the Tohoku EQ, March 11, 2011. EQs with MJMA ≥ 6.9 (MJMA in the right scale) are shown by blue asterisks. One can see that
  -values fluctuate up and down so violently that it is hard to identify their correlations with EQs. However, one can notice that
  shows a deep minimum value just before the Tohoku EQ (rightmost side of Fig. 2A). This observation prompted us to investigate more about this
  minimum. Fig. 2B is an expanded version, in the conventional time, of the concerned part of Fig. 2A (the last 10-mo period shown in yellow). The red, blue, and green curves show what happened to
  for W = 200, 300, and 400. For brevity, we use hereafter the symbols
  and
and  as needed. Putting the details aside, we observe that after around September 1, 2010 a decrease of
  became evident and
  went down to a minimum (
 200,min ∼0.157,
  300,min ∼0.160, and
  400,min ∼0.150) in early January 2011, about 2 mo before the mainshock. (The abrupt increase of
  around December 22, 2010 was due to the M7.8 EQ on this date, e.g., ref. 3.)
Fig. 2.
Variability  of
of  (left scale) along with all MJMA ≥ 6.9 EQs (in blue, MJMA in the right scale). (A) Versus EQ number when a natural time window of length W = 300 events is sliding through the JMA catalog since 1984 until just before the M9 Tohoku EQ. (B) Versus the conventional time during the last 10-mo period (shown by yellow in A). Red for W = 200, blue for W = 300, and green for W = 400. Every tick is 10 d in the horizontal scale. (C) Variability
  for W = 2,000 (green) and W = 3,000 (blue).
Results of the computation on this minimum of  are summarized as follows (Fig. 2 A and B, and Table 1):
i) Minimum of
 with this depth was not observed at any other time during the whole period.
ii)
 300,min/
 200,min = 0.160/0.157 = 1.02, i.e., nearly unity.
iii) The dates of
 for W = 200, 300, and 400 are January 5, January 5, and January 10, 2011, respectively, i.e., the dates of
  were almost the same.
iv) The appearance of this minimum is less clear for greater W that would correspond to time intervals longer than a few months. It is almost invisible for W = 2,000 and 3,000. (Fig. 2C). The same applies to all other
 as seen in Fig. 2 A and C. In what follows, for the sake of brevity we shall restrict ourselves to the cases of W = 200 and W = 300.
Table 1.
All shallow EQs with magnitude 7.6 or larger since January 1, 1984 until M9 Tohoku EQ within the area 
| Label | EQ date | EQ name | Lat.,°N | Long., °E | M |  |
 |
 |
Δt200 |
| a | 1993-07-12 | Southwest-Off Hokkaido EQ | 42.78 | 139.18 | 7.8 | 0.293 (1993-05-23) | 0.278 (1993-06-07) | 0.95 | 2 |
| b | 1994-10-04 | East-Off Hokkaido EQ | 43.38 | 147.67 | 8.2 | 0.295 (1994-06-30) | 0.319 (1994-07-22) | 1.08 | 3 |
| c | 1994-12-28 | Far-Off Sanriku EQ | 40.43 | 143.75 | 7.6 | 0.196 (1994-10-15) | 0.197 (1994-10-19) | 1.01 | 2–3 |
| d | 2003-09-26 | Off Tokachi EQ | 41.78 | 144.08 | 8.0 | 0.289 (2003-07-03) | 0.306 (2003-07-14) | 1.06 | 3 |
| e | 2010-12-22 | Near Chichi-jima EQ | 27.05 | 143.94 | 7.8 | 0.232 (2010-11-30) | 0.248 (2010-11-30) | 1.07 | 1 |
| f | 2011-03-11 | Tohoku EQ | 38.10 | 142.86 | 9.0 | 0.157 (2011-01-05) | 0.160 (2011-01-05) | 1.02 | 2 |
The symbols  are the minima of the
  variability that preceded these EQs along with their dates. Δt200 is the difference in months between the dates of
  and EQ. Lat., latitude; Long., longitude.
Minima of the Variability  Before Other Major EQs in Japan
During the 27-y study period, we had six shallow EQs with MJMA 7.6 or larger (Fig. 1 and Table 1). They are
EQa 1993-07-12: 1993 Southwest-Off Hokkaido EQ (MJMA = 7.8)
EQb 1994-10-04: 1994 East-Off Hokkaido EQ (MJMA = 8.2)
EQc 1994-12-28: 1994 Far-Off Sanriku EQ (MJMA = 7.6)
EQd 2003-09-26: 2003 Off Tokachi EQ (MJMA = 8.0)
EQe 2010-12-22: 2010 Near Chichi-jima EQ (MJMA = 7.8)
EQf 2011-03-11: 2011 Tohoku EQ (Mw = 9.0)
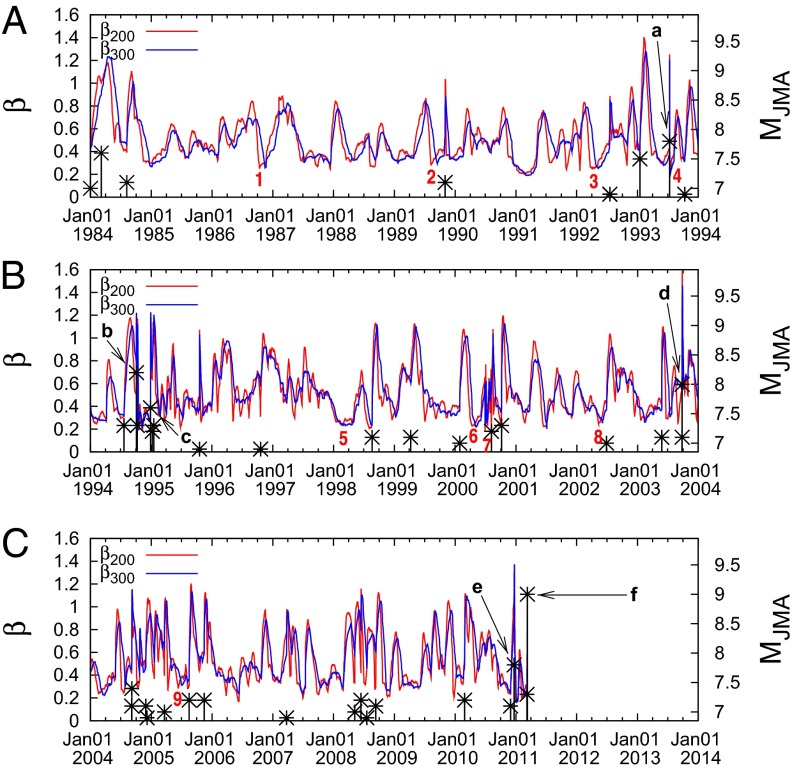
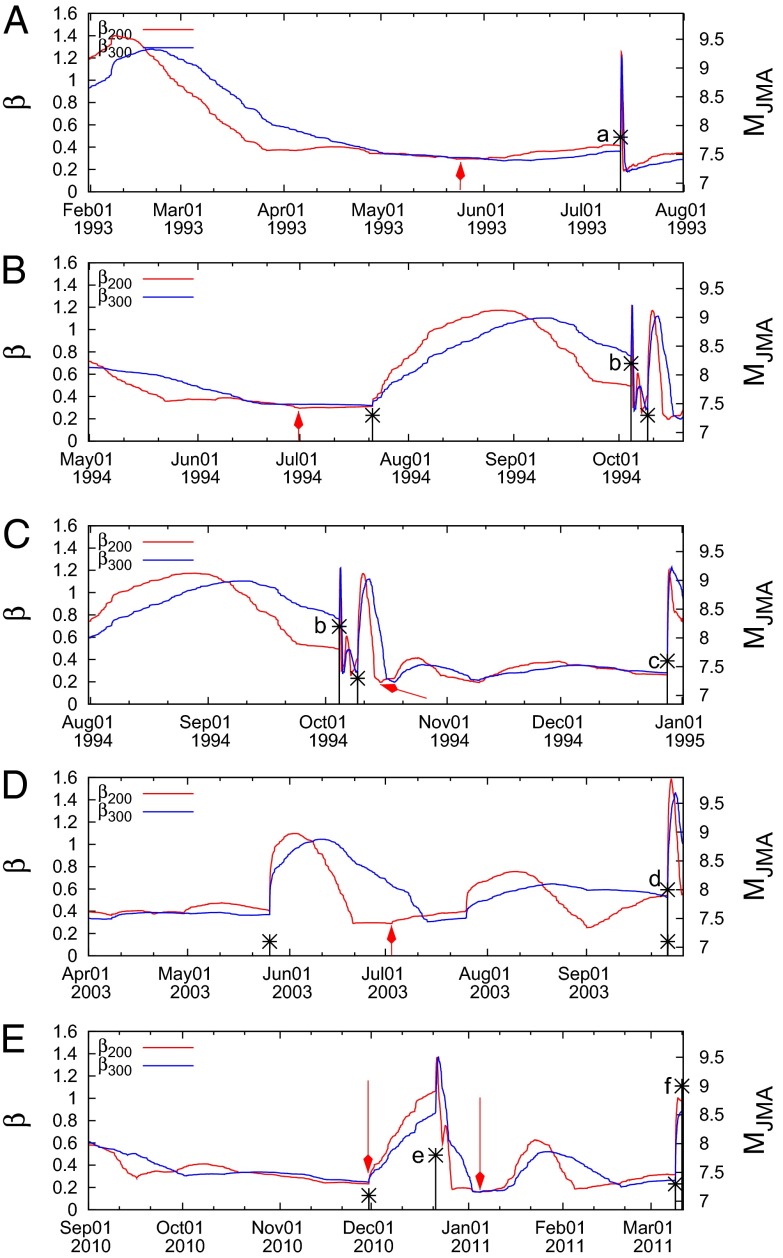
In the following, we examine if minimum of  exists before these EQs also. Fig. 3 A–C are the expanded versions of Fig. 2A in the conventional time in three 10-y periods. EQs are marked by a–f. Because these figures are still too small, we expanded the time axis for each EQ as shown in Fig. 4 A–E, just as we did for in Fig. 2B for the Tohoku EQ. We can see minima of
  within 1–3 mo before all of the six mainshocks. In Table 1, these minima are listed along with the time-correlated EQs. As seen in this table, the values of the
  ratio and Δt200 of minima of
  before all of these EQs were very similar to those observed before the Tohoku EQ, i.e., they were in the narrow range 0.95–1.08. From these, it was considered that these minima may be precursory to the time-correlated EQs.
Fig. 3.
Variability  versus the conventional time given in three consecutive 10-y periods in A, B, and C, respectively. No data are plotted in C after M9 Tohoku EQ. Every tick is 3 mo in the horizontal scale.
Fig. 4.
Excerpts of Fig. 3 plotted in expanded time scale. Every tick is 10 d in the horizontal scale. Red arrows show  along with EQs (in black a–f, MJMA in the right scale). The figures show what happened for the variability
  before the occurrence of (A) EQa, (B) EQb, (C) EQb and EQc, (D) EQd, and (E) EQe and EQf (the M9 Tohoku EQ).
During the 27-y period, beyond the above-mentioned minima of  before the six MJMA ≥7.6 EQs, there were many more minima as seen in Fig. 3. We therefore examined if they were also followed by EQs. For this purpose, we chose minima deeper than the shallowest one of the six
  in Table 1, which happened before EQb, the 1994 East-Off Hokkaido EQ (MJMA = 8.2), giving 0.295 for
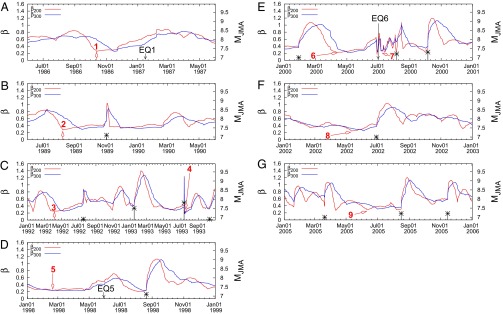
  . It was found that, out of thus chosen 31 minima, nine (numbered 1–9 in Fig. 3) also exhibited
  ratio (Fig. 5, Table 2) similar to those in Table 1, i.e., in the range 0.95–1.08. These nine minima were followed by MJMA ≥6.4 EQs within 3 mo (Fig. 5 and Δt200 in Table 2). Naturally, such correspondences are less certain because of greater number of EQs. In fact, during the 27-y period, there were 139 MJMA ≥6.4 EQs. The cases mentioned here, however, may have some reason to be reliable as explained below (Table 2). For example, the EQ that apparently followed
  No. 6 in April 2000 was the largest EQ of the volcano-seismic activity in the Izu Island area (11), the largest EQ swarm ever recorded in Japan. For a second example,
  No. 7 in July 2000 was followed by MJMA 7.3 Western Tottori EQ. The period after this EQ in the year 2000 was completely free from shallow EQ greater than MJMA 6. Other examples are the minima Nos. 9, 2, 8, 3, and 4 which were followed by EQs of MJMA 7.2, 7.1, 7.0, 6.9, and 6.9. For brevity, each case is not described here, but it was inferred that these
  might have also been precursory to sizable EQs. In fact, there were only 43 MJMA ≥6.9 EQs during the 27-y period. Likewise, the
  Nos. 1 and 5 seemed followed by EQs of MJMA 6.6 and MJMA 6.4, respectively, although their correlations are even less certain. After handling these, we are still left with 22 minima unnumbered or unmarked in Fig. 3. We have checked the
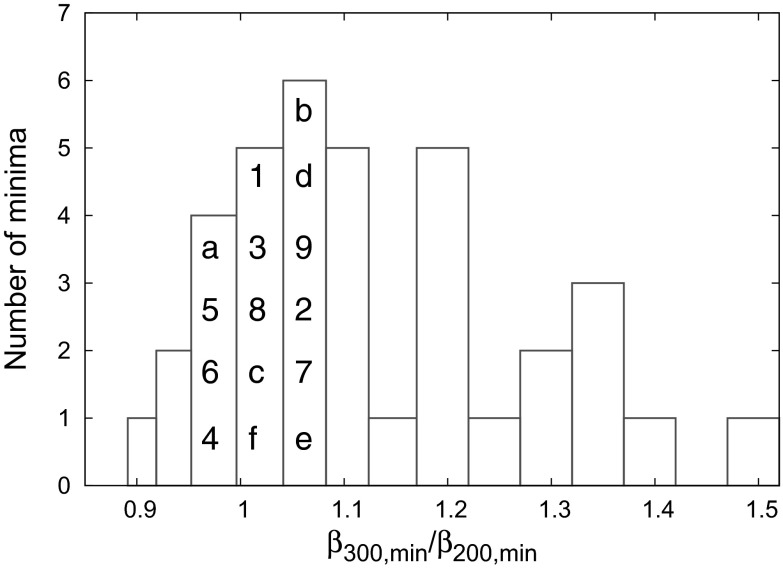
  ratio of each of them. For example,
  (
( 0.213 and
  0.259) observed on December 4, 2008 (Fig. 3C) exhibited a ratio
  (=1.22), which lies outside the range 0.95–1.08. Fig. 6 is the histogram of the
  ratio for all of the 37 minima examined so far, consisting of the 6 in Table 1 marked a–f, 9 in Table 2 marked 1–9, and the 22 additionally chosen minima. From this figure, interestingly, none of the additional 22 minima exhibits the ratio within the range 0.95–1.08.
Fig. 5.
Excerpts of Fig. 3 but corresponding to each of the nine cases of  given in Table 2: (A) 1, (B) 2, (C) 3 and 4, (D) 5, (E) 6 and 7, (F) 8, and (G) 9. Every tick is 10 d in the horizontal scale. Numbers 1–9 correspond to
  in Fig. 3 and Table 2. EQs time-correlated to minima 1, 5, and 6 are shown with the vertical black arrows.
Table 2.
Nine  of the
  variability not included in Table 1 but chosen by the procedure described in the text
| No. |  |
 |
 |
EQ date | Lat., °N | Long., °E | M | Δt200, mo |
| 1 | 0.254 (1986-10-13) | 0.257 (1986-11-15) | 1.01 | 1987-01-14 | 42.45 | 142.93 | 6.6 | 3 |
| 2 | 0.278 (1989-08-08) | 0.292 (1989-09-15) | 1.05 | 1989-11-02 | 39.86 | 143.05 | 7.1 | 3 |
| 3 | 0.250 (1992-04-05) | 0.253 (1992-05-10) | 1.01 | 1992-07-18 | 39.37 | 143.67 | 6.9 | 3 |
| 4 | 0.188 (1993-07-13) | 0.182 (1993-07-15) | 0.97 | 1993-10-12 | 32.03 | 138.24 | 6.9 | 3 |
| 5 | 0.237 (1998-02-17) | 0.233 (1998-03-12) | 0.98 | 1998-05-31 | 39.03 | 143.85 | 6.4 | 3 |
| 6 | 0.229 (2000-04-12) | 0.219 (2000-05-06) | 0.96 | 2000-07-01 | 34.19 | 139.19 | 6.5 | 3 |
| 7 | 0.243 (2000-07-09) | 0.258 (2000-07-09) | 1.06 | 2000-10-06 | 35.27 | 133.35 | 7.3 | 3 |
| 8 | 0.244 (2002-05-12) | 0.252 (2002-06-03) | 1.03 | 2002-06-29 | 43.50 | 131.39 | 7.0 | 2 |
| 9 | 0.286 (2005-06-11) | 0.309 (2005-07-01) | 1.08 | 2005-08-16 | 38.15 | 142.28 | 7.2 | 2 |
The  exhibit
  deeper than 0.295, which corresponds to the shallowest
  in Table 1. EQs are time-correlated to the
  .
.
Fig. 6.
Histogram of the  ratio for the 37 minima in Fig. 3 which are deeper than the shallowest
  of Table 1. The minima marked a–f or numbered 1–9 in Fig. 3 are placed vertically in the corresponding column according to their
  values.
Summary and Conclusions
Analyzing in natural time the seismicity of Japan from January 1, 1984 to March 11 2011 (the time of M9 Tohoku EQ occurrence), using sliding natural time window of lengths W consisting of the number of events that would occur in a few months, the following results were obtained:
Almost 2 mo before the M9 Tohoku EQ, a minimum in the variability  of the order parameter of seismicity
  is observed which is the deepest in the whole study period. Distinct minima of
  , but of shallower depth, were found also one month to a few months before the occurrence of all other Japanese major EQs (MJMA ≥ 7.6, depth <400 km) during 1984–2011. With less certitude, nine other minima of
  may have also been precursory to large EQs. The minima of
  which seem to be precursory to sizable EQ commonly show the
  ratio close to unity in the range of 0.95–1.08, whereas the other minima show the ratio outside this range. Thus, the phenomenon of minimum in the
  -value may play some role as a precursor in the EQ prediction in the future.
The approximate coincidence of the lead time of minima of  with that of the SES activities may help in understanding the physics of both phenomena.
Footnotes
The authors declare no conflict of interest.
References
- 1.Varotsos P, Sarlis NV, Skordas ES, Uyeda S, Kamogawa M. Natural time analysis of critical phenomena. Proc Natl Acad Sci USA. 2011;108(28):11361–11364. doi: 10.1073/pnas.1108138108. [DOI] [PMC free article] [PubMed] [Google Scholar]
- 2.Holliday JR, et al. Space-time clustering and correlations of major earthquakes. Phys Rev Lett. 2006;97(23):238501. doi: 10.1103/PhysRevLett.97.238501. [DOI] [PubMed] [Google Scholar]
- 3.Varotsos PA, Sarlis NV, Tanaka HK, Skordas ES. Similarity of fluctuations in correlated systems: The case of seismicity. Phys Rev E Stat Nonlin Soft Matter Phys. 2005;72(4 Pt 1):041103. doi: 10.1103/PhysRevE.72.041103. [DOI] [PubMed] [Google Scholar]
- 4.Varotsos PA, Sarlis NV, Skordas ES. Natural Time Analysis: The New View of Time. Precursory Seismic Electric Signals, Earthquakes and other Complex Time-Series. Berlin: Springer; 2011. 476 pp. [Google Scholar]
- 5.Sarlis NV, Skordas ES, Lazaridou MS, Varotsos PA. Investigation of seismicity after the initiation of a Seismic Electric Signal activity until the mainshock. Proc. Japan Acad. Ser. B. 2008;84(8):331–343. doi: 10.2183/pjab/84.331. [DOI] [PMC free article] [PubMed] [Google Scholar]
- 6.Varotsos P, Alexopoulos K. Physical properties of the variations of the electric field of the earth preceding earthquakes, I. Tectonophysics. 1984;110(1-2):73–98. [Google Scholar]
- 7.Varotsos P, Alexopoulos K, Lazaridou M. Latest aspects of earthquake prediction in Greece based on Seismic Electric Signals, II. Tectonophysics. 1993;224(1-3):1–37. [Google Scholar]
- 8.Sarlis NV, Skordas ES, Varotsos PA. Order parameter fluctuations of seismicity in natural time before and after mainshocks. EPL. 2010;91(5):59001. [Google Scholar]
- 9.Tanaka H, Varotsos P, Sarlis N, Skordas E. 2004. A plausible universal behavior of earthquakes in the natural time-domain. Proc Japan Acad, Ser B 80(6):283–289.
- 10.Kanamori H. Quantification of earthquakes. Nature. 1978;271(5644):411–414. [Google Scholar]
- 11.Uyeda S, Kamogawa M, Tanaka H. Analysis of electrical activity and seismicity in the natural time domain for the volcanic-seismic swarm activity in 2000 in the Izu Island region, Japan. J Geophys Res. 2009;114(B2):B02310. [Google Scholar]
- 12.Varotsos P, Lazaridou M. Latest aspects of earthquake prediction in Greece based on Seismic Electric Signals. Tectonophysics. 1991;188(3-4):321–347. [Google Scholar]


