

Abstract
Erythrocytes appear to be ideal sensors for regulating microvascular O2 supply since they release the potent vasodilator adenosine 5′-triphosphate (ATP) in an O2 saturation dependent manner. Whether erythrocytes play a significant role in regulating O2 supply in the complex environment of diffusional O2 exchange among capillaries, arterioles and venules, depends on the efficiency with which erythrocytes signal the vascular endothelium. If one assumes that the distribution of purinergic receptors is uniform throughout the microvasculature, then the most efficient site for signaling should occur in capillaries, where the erythrocyte membrane is in close proximity to the endothelium. ATP released from erythrocytes would diffuse a short distance to P2y receptors inducing an increase in blood flow possibly the result of endothelial hyperpolarization. We hypothesize that this hyperpolarization varies across the capillary bed dependent upon erythrocyte supply rate and the flux of O2 from these erythrocytes to support O2 metabolism. This would suggest that the capillary bed would be the most effective site for erythrocytes to communicate tissue oxygen needs. Electrically coupled endothelial cells conduct the integrated signal upstream where arterioles adjust vascular resistance, thus enabling ATP released from erythrocytes to regulate the magnitude and distribution of O2 supply to individual capillary networks.
Keywords: Microvascular regulation, O2 supply, O2 dependent ATP release, erythrocyte, capillary
Introduction
The ability of the microvasculature to supply the appropriate amount of O2 to every cell in an organ is a remarkable example of an effective biological control system. Depending on mitochondrial density and hence the capacity for O2 consumption, every skeletal muscle cell needs to be less than ~25 μm from a source of O2 and the supply of O2 must adjust to match the cells’ O2 requirements (48). Krogh (32) was the first to recognize this biophysical limitation and proposed the active regulation of capillary density in skeletal muscle to efficiently accommodate a wide range of O2 consumption rates. Our understanding of blood flow regulation has shifted from regulating flow to individual capillaries to regulating the magnitude and distribution of erythrocyte supply to capillary networks via the arteriolar tree (14, 16, 42). The functional increase in capillary density envisioned by Krogh is accomplished by passive rheology redistributing a heterogeneous erythrocyte supply to the capillary bed at rest to a more uniform distribution of erythrocyte supply as flow increases (15). At rest approximately 90% of capillaries have some degree of erythrocyte flow, from a fraction of an erythrocyte per second in a few vessels up to a maximum as high as forty erythrocytes per second with an overall mean of ten erythrocytes per second (4, 12, 39). As demand increases blood flow is recruited to individual microvascular units, consisting of the terminal arteriole and its associated capillaries (42), resulting in a higher, more uniformly distributed erythrocyte supply among capillaries that were already perfused. Most research on blood flow regulation in recent years has focused on mechanisms for integrating the flow response across multiple generations of arterioles to achieve the magnitude of flow increase that is needed. Although integration of the flow response across the arteriolar tree is likely critical for O2 supply regulation (42), it does not address how the system senses O2 levels and hence distributes O2 supply appropriately. In a previous review (16) we outlined the complexity of O2 supply to tissue that requires a local control mechanism “that is capable of sensing O2 need and adjusting flow within the small arterioles feeding the capillary network.” Regulatory mechanisms that rely solely on sensing flow (wall shear stress) or changes in vascular resistance (wall tension) do not directly sense O2 levels and hence are insufficient to precisely regulate O2 supply. This is further complicated by the rheology of erythrocyte flow within the arteriolar tree and by the diffusion of O2 from arterioles. Rheology and O2 flux from arterioles produce radial profiles of erythrocyte concentration and O2 saturation across the vessel lumen (26, 38). The impact of lower erythrocyte concentration and O2 saturation near the wall occurs as the flow stream is divided at bifurcations. A branch with a higher proportion of the flow will have a catchment area that includes the center of the lumen and thus will receive a higher concentration of erythrocytes (with relatively high O2 saturation), while the branch with a lower proportion of the flow will draw flow more from the edges thus receiving a lower concentration of erythrocytes (with relatively low O2 saturation). Since O2 supply is the product of velocity, erythrocyte concentration and O2 saturation, the potential exists for large changes in O2 supply to result from small changes in vascular resistance. From a control perspective, the O2 regulatory system should sense and respond not simply to flow or O2 levels, but to the O2 needs of the tissue relative to the O2 supply.
The radial flux of O2 from arterioles creates a separate challenge for the O2 regulatory system. Although some of the flux goes to support the metabolic needs of the vessel wall and tissue in the immediate neighborhood of the vessel (23), the remainder is either lost by a diffusion shunt directly to paired venules (46) or diffuses to nearby capillaries where it reoxygenates passing erythrocytes (19). This latter “sink” for oxygen confounds the simple Krogh model of a monotonic decrease in O2 saturation along individual capillaries (17). O2 diffusing from capillaries near the arteriole to less well-oxygenated capillaries spreads the impact of the arteriole further, thus increasing the radial flux and amplifying the bifurcation effect.
Reoxygenation of erythrocytes in capillaries by arterioles (and deoxygenation by venules) creates an additional complication for a regulatory system. For example consider the situation in Figure 1a where X mL of O2 per second destined for delivery by convection to capillary network C2 (capillary network supplied by a single terminal arteriole, “A2”) are shunted by diffusion to capillary network C1, and Y mL of O2 per second are shunted from network C3 to the crossing collecting venule, “V2” (see (19)). The result is higher O2 levels in network C1, lower levels than normal in network C2 and much lower levels in network C3 downstream of the venule. Venous outflow O2 levels would also be very heterogeneous. Given the three-dimensional geometry of the skeletal muscle microvascular bed it is likely that networks C1, C2 and C3 are supplied by different arterioles. To compensate for these diffusion “shunts” and produce more homogeneous O2 levels in the tissue and venous outflow from these networks, the O2 supply would need to be adjusted in all three terminal arterioles. Ideally, vascular resistance in A2 and A3 should be reduced to increase convective O2 supply by X mL/sec to network C2 and by Y mL/sec to network C3 while increasing vascular resistance in A1 to reduce O2 supply to network C1 by X mL/sec (Figure 1b). A regulatory system, sensing O2 levels solely in the arteriolar tree, should be able to adjust for the diffusional loss of O2 in A2, but it would not be able to make the needed adjustment in A1 or A3 because the changes in O2 supply occur downstream of the terminal arterioles. The example presented may seem complex but in a three-dimensional microvascular bed this is likely an over-simplification of what occurs commonly throughout the tissue. Furthermore there will be diffusional exchange among capillary networks (adjacent or overlapping above or below) that to varying degrees will transfer O2 among these networks (17) as they work together to maintain tissue oxygenation. Again, an O2 regulatory system based solely in the arteriolar tree cannot “sense” the complex O2 environment in the capillary bed.
Figure 1.
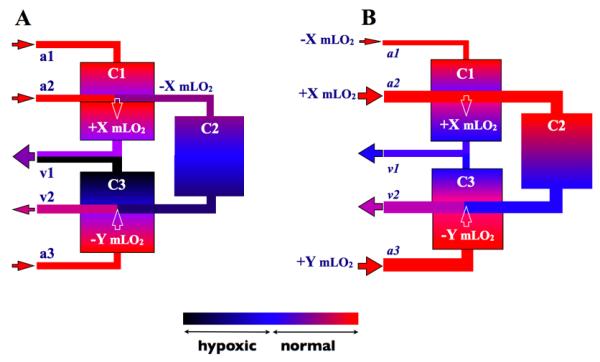
Schematic of three capillary beds (rectangles labeled C1, C2 and C3) supplied by three terminal arterioles (A1, A2 and A3) and draining into two collecting venules (V1 and V2). Color coding of vessels and capillary beds represents O2 levels as indicated in colorbar. The label hypoxia in this context means any O2 level below the normal range. Solid arrowheads indicate the direction of blood flow. White arrowheads indicate the direction of diffusive O2 transport either adding X ml O2/sec to capillary network C1 from A2 or removing Y ml O2/sec from capillary network C3 by V2. Panel A illustrates the wide range of the distribution of O2 among these vessels and capillary beds without regulation of O2 supply. All of capillary network C2 is shown as hypoxic while only the venular region of network C3 is hypoxic. C1 has higher than normal O2 levels. Panel 2 shows the ideal situation with regulation of O2 supply ensuring the appropriate distribution of O2 supply to each of the terminal arterioles resulting in normal O2 levels in all three capillary beds.
To handle these situations, would the microvasculature rely on a metabolic regulatory pathway, or in some way directly sense O2 levels in the tissue or capillary bed? If metabolism is changing because of a change in energy requirements in the tissue then one would expect that metabolism would trigger a vascular response. However, the case we wish to consider is where O2 demand is unchanged and flow is being adjusted to establish or maintain the appropriate distribution of O2 supply. It is unlikely that a regulatory system controlling O2 supply would delay its response until the tissue has become hypoxic enough to trigger a metabolic regulatory pathway.
O2 Response of the Microcirculation
It has been recognized for many years that the skeletal muscle microvasculature responds directly to changing O2 levels. It is standard practice for those using a superfusion solution to test the viability of a preparation by increasing O2 levels of the superfusion fluid to verify that arterioles vasoconstrict and flow is reduced (26). Switching back to a superfusion solution equilibrated with near zero O2 levels causes a rapid increase in flow to a stable “normal” level of perfusion. These responses are a direct effect of either adding additional O2 to (high superfusion O2) or removing O2 from (low superfusion O2) the tissue, not to altered O2 consumption or metabolism. In most of these thin microvascular preparations, with the arteriolar tree exposed at the tissue surface, one may assume that the altered O2 levels are acting directly on individual arterioles (27). However, in thicker tissues such as the extensor digitorum longus (EDL) muscle where the arteriolar tree is deep within the tissue, a response to a changing surface O2 environment cannot be due to a direct effect on the arteriolar tree since only terminal arterioles and capillaries are exposed at the muscle surface.
Figure 2 shows the results of two separate experiments where the surface O2 levels of rat EDL muscle were manipulated using a gas exchange chamber inserted into the stage of an inverted microscope. Gas of varying O2 levels with fixed CO2 (5%) and temperature (32°C) was passed through the chamber causing rapid changes in the surface O2 environment across the entire bottom surface of the muscle. The chamber O2 levels were measured using a fiber-optic pO2 sensor (Ocean Optics) in the gas outlet and erythrocyte O2 saturation and supply rate (SR) in individual capillaries at the muscle surface were measured using a dual wavelength intravital video microscopy system (30). The SR response was clearly associated with a change in O2 levels at the muscle surface since other factors which might affect blood flow such as temperature and CO2 were controlled. Although the O2 level in the chamber was reduced from a PO2 of 150 mmHg to ~10 mmHg, the erythrocyte O2 saturations in the two capillaries represented in this figure never fell below 40% before increased O2 supply from the upstream arteriolar tree offset the O2 lost to the exchange chamber. Note: the capillary PO2 never fell below 32 mmHg based on the Hill equation with p50 of 37 mmHg (rat) and Hill coefficient of 2.8 for an O2 saturation of 40%. In panel A, exposure to low O2 (~10 mmHg) in the chamber for two minutes required a SR of ~15 erythrocytes/sec to maintain a stable erythrocyte O2 saturation of 65%. The delay from the onset of the drop in chamber O2 affecting the tissue, as indicated by the drop in O2 saturation, until the microvascular response was ~14 seconds. If we assume the steady state O2 saturation of 65% was the apparent “set-point” for this capillary and we assume the microvascular response was triggered when the O2 saturation fell below this value, the response delay is ~10 seconds. Panel B shows a similar response time for each of five 30 second exposures to low O2. In this capillary each period of low O2 resulted in an overshoot in SR of well oxygenated erythrocytes from the upstream arteriolar tree causing erythrocyte O2 saturation in this capillary to briefly increase to 70-80%. Despite still being exposed to the low O2 environment, in each case, SR rapidly declined reducing the O2 supply and the O2 saturation. These data imply that the O2 regulatory system was repeatedly attempting to adjust O2 saturation levels to some apparent set-point. The increase in chamber O2 caused an increase in erythrocyte O2 saturation and further rapid drop in SR.
Figure 2.

Measured change in erythrocyte (RBC) oxygen saturation (SO2) and supply rate (SR) in two different capillaries near bottom surface of rat EDL muscle in response to step changes in oxygen level in gas exchange chamber (Chamber %O2) inserted into the microscope stage under the muscle. CO2 fixed at 5%, temperature maintained at 32°C. Panel A shows 60 seconds of baseline data at high chamber %O2 followed by a 2 minute period of low chamber %O2 level. Panel B shows a sequence of cycles of chamber %O2 levels, each with 30 sec of high %O2 and 30 sec of low %O2. Note: different scaling of axes between the two panels. In panel A, O2 saturation varies between 40 and 100% (left Y axis) as compared to 0 to 100% in panel B. Supply rate or chamber %O2 (right Y axis) varies between 0 to 25 in panel A and 0 to 50 in panel B.
In 1995, Ellsworth et al. (18) proposed that oxygen dependent release of ATP from erythrocytes could provide the signal for regulating O2 supply. Our most up-to-date understanding of the mechanism for O2 dependent ATP release is presented in the companion paper by Sprague and Ellsworth in the current edition. The erythrocyte as a carrier and sensor of O2 that is able to signal the vessel wall to adjust blood flow would appear to be an ideal system for regulating O2 supply and would explain the data shown in Figure 2.
ATP is released from erythrocytes in response to increased shear stress (44, 47), mechanical deformation (44, 47) and a drop in O2 saturation (18). This released ATP would diffuse to P2y receptors on the vascular endothelium inducing the synthesis and release of nitric oxide (NO), prostacyclin (PGI2) and/or endothelial derived hyperpolarizing factor (EDHF) which cause local vasodilation. For the vasodilation to evoke an effective increase in blood flow, the signal must be conducted to upstream sites (33). It is generally accepted that the conduction of the vasodilatory signal in the arteriolar tree and capillary bed occurs via the spread of a hyperpolarization via gap junctions from endothelial cell to endothelial cell, thus integrating the ATP signal from the capillary bed across the arteriolar tree (10, 41, 42, 49). However, an important question to ask is whether the erythrocyte as an O2 sensor is able to effectively respond to the complexities of microvascular blood flow and the diffusional exchange of O2 among multiple levels of the microvasculature and thus appropriately distribute O2 supply to match the O2 needs of the tissue?
How efficient is the ATP communication from the erythrocyte to the vascular endothelium? Factors determining this efficiency include:
How rapidly ATP is released from erythrocyte after a change in O2 saturation.
Once ATP is in the plasma, how far it travels before reaching a P2y receptor.
How rapidly ATP is degraded by ecto-ATPase.
The efficiency of ATP signaling likely determines whether ATP release from erythrocytes can be an effective regulator of tissue oxygenation and to what level the distribution of O2 supply can be regulated-- i.e., one capillary network supplied by a single terminal arteriole or multiple capillary networks supplied by a higher order arteriole. The efficiency of ATP signaling will also determine at what point a decrease in microvascular hematocrit causes this form of regulation to fail.
ATP Flux from Erythrocytes
One of the critical factors in erythrocyte signaling to the endothelium is how rapidly the ATP flux from the erythrocyte (denoted R) can be increased, because this will determine how far downstream an erythrocyte travels before it releases additional ATP in response to a drop in saturation. Experiments on isolated arterioles in vitro originally suggested that flux must increase within 500 ms of a decrease in O2 saturation (8). However, recent measurements of shear-dependent changes in R (47), which are thought to involve the same signaling pathway as saturation-dependent ATP release, give a timescale of ~30 ms for changes in R and 100-150 ms for peak values of R to be attained. This latest result still implies that in arterioles erythrocytes will travel a substantial distance downstream before increasing ATP flux in response to decreased saturation. In capillaries, timing may be less important because of longer transit times. Similarly in venules, the further downstream erythrocytes travel before ATP is released, the less specific the vascular response can be. These considerations highlight the need to fully characterize the dynamics of O2 saturation dependent ATP release for changing saturation.
From the data in Figure 2, the microvasculature of the EDL was able to increase SR and reverse the drop in erythrocyte O2 saturation in ~10 seconds following the drop in SO2 below a threshold value. If R is <500 msec what accounts for the 10 second delay in the response? Dietrich et al. (9) reported that application of ATP directly to the outer surface of isolated cerebral penetrating arterioles at high concentration resulted in hyperpolarization at a remote site 1.24 mm away from the stimulus within 0.6 sec. This means a conduction velocity for hyperpolarization of ~2 mm/sec. Depending on the path length from the capillary bed to the arterioles controlling their blood supply and how far up the arteriolar tree the signal is conducted, one might anticipate a delay in the arteriolar response on the order of 3-5 seconds. Although a change in arteriolar resistance would alter velocity immediately, delivery of erythrocytes with higher O2 saturation to the surface capillaries would require the additional transit time delay for these cells to travel from upstream bifurcations.
ATP Signaling: Function of Capillary Hematocrit
Once ATP has been released from the erythrocyte, the most straightforward approach would be to assume that the local plasma ATP concentration determines the level of signaling by P2y receptors on the vascular endothelium. Plasma ATP concentration ([ATP]) can be calculated from the flux of ATP from the erythrocytes into the plasma volume, making [ATP] dependent on the number of erythrocytes releasing ATP and the plasma volume, i.e., the local microvascular hematocrit. This relationship between the local hematocrit and the level of O2 regulatory signal from erythrocytes would have consequences for O2 regulation. The longitudinal gradient of O2 down the arteriolar tree would appear to make the arterioles a primary site of O2 regulation since ATP would have a direct vasodilatory effect on vascular smooth muscle as well as immediate conduction of the signal along the vascular endothelium to integrate the response over multiple generations of arterioles. However as one descends the arteriolar tree, tube (local) hematocrit decreases due to a combination of Fahraeus and network Fahraeus effects (preferential distribution of erythrocytes at bifurcations, plasma skimming). As a consequence, the efficiency of ATP signaling would fall as one descends the arteriolar tree, thus limiting the ability to regulate the distribution of O2 supply as one approaches the capillary bed. This conclusion was supported by the modeling results of Roy and Secomb (40) which showed that asymmetry in blood flow at arteriolar bifurcations could not be corrected by a signal originating from erythrocytes.
In contrast to arterioles, hematocrit in venules increases as blood flows from small collecting venules to larger venules. This increased hematocrit or efficiency of signaling plus low O2 saturations results in a strong signal being conducted upstream to regulate arteriolar diameter, which is likely why the model of Arciero et al. (2) selected the venules as the primary site for regulating O2 supply. Since the number of capillary beds contributing blood to the venous outflow increases when ascending the venular tree, one would anticipate that this type of regulation would increase regional flow but not effectively redistribute flow to individual capillary beds. Again the modeling results in (2) support this conclusion.
One would expect that a substantial signal should arise from erythrocytes as they pass through the capillary bed since capillaries are the primary site of tissue oxygenation. But capillaries have, on average, the lowest hematocrit in the microvasculature so their efficiency for signaling based on average plasma [ATP] would be the lowest. If the assumption that the average plasma [ATP] determines the level of O2 regulatory signaling is correct, then the erythrocyte as a sensor and regulator of O2 supply is limited to helping establish the magnitude of O2 supply to the microvascular bed, but not to the distribution of O2 supply to individual capillary networks.
ATP Signaling: Function of Erythrocyte Supply Rate
Capillary Bed
A more efficient mechanism for signaling would be for ATP released from the erythrocyte to signal directly to the P2y receptors on the endothelium rather than first being diluted by the plasma volume contained within the entire vessel lumen. Figure 3 shows individual erythrocytes at low hematocrit (high velocity) passing through a capillary. The erythrocytes are highly deformed with the majority of their membrane in very close contact with the vascular endothelium. This situation would approach that of neurotransmitters being released into a synaptic junction. ATP released from the membrane facing the endothelium would only be diluted in the small plasma “junction” between the endothelial and erythrocyte membranes, and the distance for diffusion for ATP would be < 1 μm meaning that ATP would only be convected downstream a very short distance, i.e., in the time required for ATP to diffuse to receptors on the vessel wall. In the smaller diameter capillaries, there may be almost a direct transfer of ATP from the erythrocyte pannexin 1 channel to the P2y receptor depending on the thickness of the endothelial surface coat. ATP released into the plasma gap between erythrocytes would be diluted in a much larger volume and hence have a minor impact on signaling.
Figure 3.
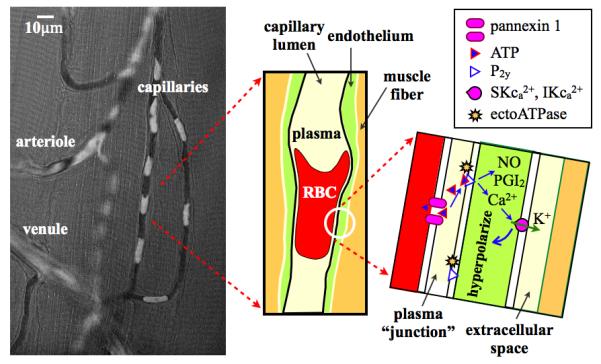
Figure illustrates the potential for direct transfer of ATP from the erythrocyte (RBC) to P2y receptors on the capillary endothelium. Left panel shows composite image of a single video frame (opacity 64%) superimposed on a functional (minimum) image from the same video. Video sequence captured at 40X with a 1-msec exposure using a Rolera XR digital video camera on an Olympus IX-81 inverted microscope using a 420-nm interference filter. The video frame has been processed as a pseudo-optical density image with low to high values scaled from black to white. The functional image (29) represents the minimum light intensity value at each pixel over the video sequence and hence shows the capillary lumen as defined by the passage of erythrocytes (glycocalyx not included). In the composite image, white erythrocytes are superimposed on the black capillary lumen. The middle panel shows a schematic of a single erythrocyte in the capillary and the right panel a schematic of a magnified view of the plasma junction between erythrocyte and endothelial membranes. ATP released from the erythrocyte via pannexin 1 channels diffuses across the narrow gap to P2y receptors on the capillary endothelium inducing the synthesis and release of nitric oxide (NO) and prostacyclin (PGI2) as well as Ca2+ signaling in the endothelium resulting in hyperpolarization of the endothelial cell via Ca2+ sensitive K+ channels.
Thus, rather than ATP signaling from the erythrocyte being determined by local hematocrit, the signal would be determined by the number of erythrocytes per second passing through the capillary, i.e., the erythrocyte supply rate. At an average supply rate of 10 erythrocytes/sec, P2y receptors at one location on an endothelial cell would experience a passing erythrocyte and ATP signal approximately every 100-msec. The duration of the ATP signal experienced by a single endothelial cell from a passing erythrocyte would be determined by the erythrocyte’s velocity and the length of the endothelial cell. For a capillary endothelial cell in muscle of 104-μm in length (50) and an erythrocyte velocity of 100-μm/sec, a single erythrocyte would stimulate P2y receptors on the endothelial cell for 1-sec. Clearly multiple erythrocytes would be stimulating simultaneously multiple receptors on the endothelial cell, each erythrocyte adding to Ca2 + signaling and hyperpolarization of the cell. As the erythrocyte travels downstream it would continue to contribute to hyperpolarization of additional endothelial cells.
A key aspect of this hypothesis is that capillary endothelial cells are electrically coupled and hence capable of sending a hyperpolarization signal from capillaries to the arteriolar tree (3). Several groups have demonstrated conducted signaling along capillaries in vivo (6, 7, 10, 43) or along capillary endothelial tubes in vitro (35). ATP has been shown to generate conducted vasodilation via hyperpolarization of the endothelium (9, 35).
With this scenario, the efficiency for ATP signaling would be very high since every erythrocyte passing through the capillary network would contribute to the conducted signal generated by all endothelial cells in the network. Since capillary endothelial cells lack surrounding electrically coupled smooth muscle cells, there may be less of a current “drain” on the conducted signal. With less current dissipation, the conduction length constant for capillaries may be greater than for arterioles further enhancing their efficiency of signaling. Integration of this hyperpolarization signal from capillaries supplied by a single terminal arteriole would provide the foundation for appropriate distribution of O2 supply to that microvascular unit and hence provide the mechanism for controlled O2 supply distribution across the entire capillary bed.
Arteriolar Tree
We expect that ATP signaling to the endothelium in arterioles will be less efficient than in capillaries but more efficient than one would estimate based on local hematocrit. The source of the longitudinal gradient, which provides the signal for regulating the distribution of O2 supply, is the metabolic requirements of the wall and surrounding tissue that causes a radial flux of O2 out of the arteriolar blood. Re-oxygenation of erythrocytes in nearby capillaries and diffusional shunting to venules also contributes to the radial flux (16). A recent theoretical paper (38) modeling O2 flux from arterioles into surrounding tissue predicts the magnitude of both the axial and radial gradient in O2 levels in the vessel lumen as a function of arteriolar diameter and axial distance down the vessel. The model demonstrates that the erythrocytes nearest the wall will have substantially lower O2 saturations than erythrocytes in the vessel centerline in all order of arterioles, and that the longitudinal O2 saturation gradient increases as the arteriolar diameter decreases. In the capillaries we proposed that all erythrocytes are able to signal the capillary wall due to the small separation between erythrocyte and endothelial membranes. But in arterioles only erythrocytes adjacent to the cell-free-plasma layer directly release their ATP into this plasma volume. ATP molecules released from erythrocytes closer to the centerline are less likely to reach the wall, or at a minimum will be convected far downstream before reaching the wall. Based on this argument there will be a spatial misalignment (and blurring) between the O2 saturation gradient along an arteriole and the ATP flux reaching P2y receptors on the endothelium. ATP may not be released from an erythrocyte until the erythrocyte has traveled one or more generations of arterioles downstream, and ATP released into the plasma may not reach the endothelium until the capillary bed.
Al-Khazraji et al. (1) measured the velocity profile in arterioles from 100-μm down to 20-μm diameter in the gluteus maximus muscle of rat. In the largest arterioles the velocity profile was parabolic but as diameter decreased the profile became more blunted with the velocity ratio (Vmax/Vmean) decreasing from 1.98 to 1.35. As a consequence, the velocity of erythrocytes adjacent to the cell free plasma layer approaches that of the centerline velocity in smaller arterioles. For example Al-Khazraji et al. reported the velocity adjacent to the plasma layer of ~5-mm/sec (maximum velocity ~7-mm/sec) in 30-μm diameter arterioles. With estimated release times following a change in O2 saturation of 30 to 500-msec, an erythrocyte near the plasma layer would have traveled 150 to 2500-μm before releasing ATP. ATP released on the endothelial side of the erythrocyte would enter the plasma layer and diffuse across the ~1.6-μm thick layer to the vessel wall while being carried further downstream a relatively short distance of ~25-μm (for diffusivity DATP = 5×10⁻⁶ cm2/sec). ATP released on the opposite side of the erythrocyte would enter a plasma volume traveling at a higher velocity with a greater distance to diffuse to the wall and hence the ATP would be carried further downstream. If we define the proportion of the erythrocyte supply rate able to signal the wall as one aspect of efficiency, the proportion increases from ~25% in 100-μm diameter to ~65% in 20-μm diameter arterioles, where we have assumed a parabolic profile in the erythrocyte column with a 7-μm outer signaling layer and an edge velocity ~13% of Vmax. Thus in this scenario, terminal arterioles would be able to play a significant role in regulating the distribution of flow to individual capillary networks.
Another aspect of ATP signaling is the magnitude of the hyperpolarization signal that would be generated in the arteriolar segment. Although 65% efficiency in terminal arterioles for an erythrocyte supply rate that supports 20-40 capillaries represents a substantial ATP efflux, there are fewer endothelial cells generating the hyperpolarization signal to be conducted upstream compared to the capillary bed. Thus, ultimately, the efficiency of erythrocyte signaling will be greatest in capillaries.
Venular Tree
The erythrocyte supply rate hypothesis, which considers near-wall erythrocyte ATP release of primary importance, suggests that venules will also have lower signaling efficiency than capillaries due to their relatively small surface area to volume ratio. In addition, since streams of erythrocytes from different capillary beds tend not to mix within venules (very low Schmidt number flow), there will be a heterogeneous ATP signal delivered to the venular wall which could result in inappropriate dilatory signals being propagated upstream. This would be another argument for decreased importance of venules in regulation of O2 supply to individual capillary networks. However, venular signaling may help set the overall magnitude of the O2 supply to larger regions of the microvascular bed, especially when one considers cross-talk between venules and their paired arterioles (25).
O2 Diffusional Exchange and Implications for ATP signaling
For the O2 regulatory system to work in the environment illustrated in Figure 1, ATP signaling from the erythrocyte must remain very local implying a close temporal link between local O2 environment, erythrocyte O2 saturation, the release of ATP and binding of ATP to P2y receptors. With estimated release times from a change in O2 saturation to receptor binding in the range of 50 to 500-msec, an erythrocyte could signal the capillary wall its current level of O2 saturation at a specific location within 5 to 50-μm further downstream at an erythrocyte velocity of 100-μm/sec. This possible spatial offset in reporting the erythrocyte’s O2 saturation under resting conditions would be less than the typical length of an endothelial cell in skeletal muscle. But under high flow conditions, e.g. 1000-μm/sec, the spatial offset would range from 50 to 500-μm depending on the release times. Experiments to determine the release times for O2 saturation dependent ATP release more precisely are clearly needed. Since it is the hyperpolarization of the endothelial cell that signals upstream arterioles, the length of the endothelial cell likely defines the highest resolution with which the vasculature could resolve erythrocyte O2 levels.
Highly localized signaling also implies that ATP must be rapidly degraded. The signal for the amount of convective transport of O2 required by a capillary or group of capillaries should reflect whether there is an additional diffusional source of O2 at some point along the path to the collecting venule, e.g., a nearby crossing arteriole as in Figure 1. ATP released in an upstream section with low O2 saturation should not be swept downstream masking the presence of an additional source of O2 from the arteriole. Clustering on the endothelium near purinergic receptors of ecto-ATPases (31, 37), which metabolize ATP to ADP, AMP and adenosine, has been suggested for ATP released from platelets and endothelium to modulate/regulate platelet adhesion and the coagulation pathway. It is likely that similar clustering of ecto-ATPases exists around P2y receptors such that ATP released into the gap between erythrocyte and endothelium can be rapidly degraded to ensure a very local O2 dependent response to ATP. Note: localization of the O2 signaling can only occur if the metabolic products of ATP degradation fail to produce a conducted vasodilation, that is a) they do not stimulate a conducted signal, b) they are themselves rapidly degraded or c) they are rapidly transported via nucleoside transporters back into the erythrocyte or endothelium (36). Hydrolysis of ATP to adenosine has been reported to cause a conducted signal in cremaster muscle (11) but not in rat penetrating arterioles by Dietrich et al (9). Clearly this is an area requiring further study to determine how localized O2 regulation can occur. Further study is also required to understand how the potential cross-talk between ATP signals from erythrocytes, platelets or endothelium via different signaling pathways is regulated.
If the O2 regulatory system functions as we have described in the previous paragraph, then plasma levels of ATP measured in the venous outflow of skeletal muscle would not necessarily reflect ATP levels in the microvascular bed. ATP concentrations may only reflect the local O2 saturations of the venous blood (28).
Alternative Dependence of R on O2 Saturation
It has been assumed, both in experiments and modeling, that the ATP flux from the erythrocyte R is simply a function of the absolute level of O2 saturation (denoted here by S). However the rapid change in hemoglobin conformation as the O2 saturation falls is the likely mechanisms by which the ATP signaling pathway is activated, i.e., R ~ dS/dt. The magnitude and rapidity of change in the conformation of hemoglobin bound to the erythrocyte membrane may deform the membrane much like shear stress triggering the signaling pathway for ATP release. Sridharan et al. have shown that reduced deformability attenuates ATP release (45) which supports the link between a biomechanical trigger and ATP release. R ~ dS/dt implies that as an erythrocyte traverses a given section of the microcirculation its total ATP release is proportional to its total change in saturation, independent of velocity. This can be seen by integrating R = k*dS/dt from time t = 0 to the time t = T = L/v that it takes an erythrocyte to travel a distance L down a vessel at velocity v. The total ATP released over L is then
where ΔS is the steady-state change in saturation over L. If ν (and hence T) changes but ΔS remains fixed then ATPtot will remain fixed, assuming R is able to change rapidly enough to keep pace with dS/dt. The above relation is consistent with the supply rate hypothesis We believe the dynamic dependence of R on saturation needs to be explored experimentally to examine the possible role of dS/dt (e.g., as a co-factor with saturation itself) in determining the ATP flux.
Range and Set-point for O2 Supply Regulation
Two key questions about the proposed O2 regulatory system are the range over which it functions and whether there is a specific set-point O2 saturation that the regulatory system is attempting to maintain. Jagger et. al. (28) reported that the ATP release was linearly dependent on the hemoglobin O2 saturation over the physiological range, i.e. ATP release increased as O2 saturation decreased. Ellsworth et al. have reported that there is a significant increase in ATP release at 50% saturation relative to the baseline release at high saturation supporting the concept that this mechanism regulates O2 supply over the physiological range. Data shown in Figure 2 supports the close link between O2 saturation and regulation of O2 supply over the physiological range. The early work by Jackson and Duling (27) studying the O2 sensitivity of hamster cheek pouch arterioles in vivo also shows a strong correlation between arteriolar diameter and O2 saturation (their Figure 9) over the range of O2 saturations they measured, 60 to 95%, which further supports this proposal that O2 saturation dependent ATP release from erythrocytes regulates O2 supply over the physiological range.
Is there an O2 saturation set-point? In the context of ATP release from the erythrocyte, a set-point would be the ATP signaling levels rather than a specific O2 saturation. For example, if dysfunctional erythrocytes released less ATP in the capillary bed at the apparent set-point saturation, the endothelium would sense this as a higher O2 saturation and “excess” O2 supply to the capillary bed. This would result in a decrease in the dilatory signal to the arteriolar tree and a fall in erythrocyte O2 saturation until a new balance between ATP release and O2 supply has been established. If this concept is correct then the apparent O2 saturation set-point would fall and the microvasculature would have less capacity to maintain tissue oxygenation unless some other release mechanism were able to compensate (20).
Is this the only mechanism for regulating O2 supply to tissue? No. At very low O2 levels, ATP release from endothelial cells likely plays a role (51). In exercise, other mechanisms likely account for the rapid onset of blood flow to increase O2 delivery but we would expect that O2 saturation dependent ATP release from erythrocytes would fine tune the distribution of increased flow to match the O2 needs. Simply increasing flow is not enough.
Approaches to Address O2 Regulatory Mechanisms
The data in Figure 2 generated in response to a perturbation of the O2 levels at the surface of the EDL muscle indicate that the signal derived from the terminal arterioles and capillary bed at the muscle surface is able to over-ride whatever control is being exerted by the arteriolar tree deeper in the muscle. This supports the hypothesis of ATP release as a function of SR rather than hematocrit although it does not definitively link regulation to the erythrocyte. The very close association of SR and erythrocyte O2 saturation levels shown in Figure 2, especially panel B, does support ATP signaling from the erythrocyte in the capillary bed as the source of the regulatory signal.
In the experiments used to produce the data in Figure 2, the entire bottom surface of the muscle was stimulated with varying O2 levels. One cannot determine from this approach whether the regulatory system is capable of responding to very local sources or sinks for O2 such as the crossing arterioles and venules in Figure 1. We have recently published a technique using an O2 permeable micro-outlet in a thin glass sheet for altering the surface O2 levels in a region of the EDL muscle as small as 100-μm in diameter (22). We have demonstrated that erythrocyte O2 saturation can be altered in a single capillary while limiting the impact of the O2 perturbation to the immediate vicinity of the micro-outlet. We are currently adapting this micro-fluidic approach to simulate arterioles or venules crossing a small group of capillaries to test the concepts we derived from Figure 1. Does increasing the O2 saturation of erythrocytes as depicted in capillary network DA (Figure 1) cause flow to be reduced to that group of capillaries? Similarly, does decreasing the O2 saturation of erythrocytes as depicted in capillary network CA3 cause flow to be increased to that group of capillaries? Is the response limited only to the capillaries supplied by the terminal arteriole associated with these stimulated capillaries? If the answer to these questions is yes, then we will have demonstrated that the O2 regulatory system is able to regulate the distribution of O2 supply to individual capillary networks with the signal originating from the capillary bed over-riding the signal originating in the arteriolar tree.
Thus we anticipate that the use of a microfluidic approach to explore the very local regulation of O2 supply combined with protocols for inhibiting/attenuating ATP release from the erythrocyte will enable us to directly address the O2 regulatory mechanisms proposed in this paper and help establish the link between the erythrocyte and O2 supply regulation in vivo.
Summary
We propose that the site where ATP release from the erythrocyte functions to regulate the distribution of O2 supply within the microvascular bed of skeletal muscle occurs primarily in the capillaries, where every erythrocyte is able to communicate directly to the endothelium through the thin plasma gap separating the membranes. Hyperpolarization of the capillary endothelium across the entire capillary bed is then conducted upstream into the arteriolar tree to direct the distribution of O2 supply to where it is needed. This hypothesis links O2 saturation dependent ATP signaling from the erythrocyte with erythrocyte supply rate rather than the local tube hematocrit, which means that the ATP signaling from the erythrocyte closely reflects microvascular O2 transport. For this system to regulate O2 supply in the O2 environment of the capillary bed with substantial diffusional exchange among capillaries, arterioles and venules, ATP release from the erythrocyte must be rapid (<500 msec) and, once signaling has occurred, ATP must be rapidly degraded to metabolic products that do not elicit a conducted vasodilatory signal.
If the arguments presented in this paper are supported by experimental evidence then there are a number of important consequences that need to be considered.
The density of the capillary bed may play a critical role in regulation of the distribution of O2 supply within the microvascular bed. Tissues such as skeletal muscle with a large range of metabolic demands from rest to exercise require a high capillary density to minimize diffusion distances and maximize surface area for O2 exchange during peak exercise. These tissues would also require a large endothelial source of stimulus to generate a sufficiently large signal to be conducted upstream into the arteriolar tree to ensure the proper distribution of O2 supply during periods of maximum O2 demand. Based on this scenario, tissues such as the mesentery which have lower O2 demand and fewer capillaries would be unlikely to be able to support a substantial increase in O2 demand because too few endothelial cells would be available to produce a signal for the necessary increase in flow.
Ultimately, the hypothesis we present in this position paper directly links the flux of O2 from the erythrocyte to support O2 metabolism with the flux of ATP from the erythrocyte to regulate the magnitude and distribution of O2 supply. As O2 metabolism increases, the flux of O2 from the erythrocytes increases leading to decreased O2 content in the blood and increased ATP signaling from the erythrocyte.
Perspectives
Failure of the proposed O2 regulatory system could occur at several levels such as attenuated ATP release from the erythrocyte, impaired conducted signaling along the vascular endothelium and/or loss of capillary density. High insulin levels as occur in prediabetes have been shown to attenuate ATP release for the same drop in O2 level (13, 24) with potentially adverse effects on tissue oxygenation (13). Human erythrocytes from patients with type 2 diabetes have decreased expression of Gi protein in the erythrocyte membrane which may contribute to peripheral vascular disease in type 2 diabetes patients.
Impaired endothelial conduction likely occurs in a variety of diseases due to endothelial damage or reduced electrical coupling between endothelial cells (5). Diabetes (21, 52) and sepsis (4, 34) are both associated with a loss of functional capillary density which may contribute to impaired signaling from the capillary bed. Understanding the role of the erythrocyte in regulating the distribution of O2 supply, independent of changes in metabolism, will give new insights into a variety of cardiovascular diseases and hence lead to novel therapeutic approaches to aid in the treatment of patients.
Acknowledgements
The authors would like to thank the editor(s) of this special addition for giving us the opportunity to write this review and our colleagues Mary Ellsworth, Randy Sprague and Alan Stephenson for insightful discussions.
This research was funded by National Heart, Lung, and Blood Institute Grant R33-HL-089125 and Canadian Institutes of Health Research Grant MOP-102504.
Nomenclature
- ATP
adenosine 5′-triphosphate
- O2
oxygen
- RBC
erythrocyte
- ta1, ta2 & ta3
terminal arterioles 1, 2 & 3
- cv1 & cv2
collecting venules 1 & 2
- C, DA & DV
capillary networks C, DA & DV
- Vmax/Vmean
velocity ratio of centerline (maximum) velocity divided by mean velocity in arteriole
- R
erythrocyte ATP flux
- DATP
Diffusivity of ATP in plasma
- dS/dt
Rate of change of hemoglobin O2 saturation with time
- L
distance erythrocyte has traveled
- ν
velocity of erythrocyte
- T
time to travel distance L at velocity ν, L/ν
- ΔS
steady-state change in saturation over L
- psODx,y
pseudo-OD at pixel location (x,y), psODx,y = log10[Imaxx,y/Ix,y]
- Imaxx,y
maximum light intensity over the length of the video sequence at pixel location (x,y)
- Ix,y
measured light intensity level in a single frame at pixel location (x,y)
References
- 1.Al-Khazraji BK, Novielli NM, Goldman D, Medeiros PJ, Jackson DN. A simple “streak length method” for quantifying and characterizing red blood cell velocity profiles and blood flow in rat skeletal muscle arterioles. Microcirculation. 2012;19:327–335. doi: 10.1111/j.1549-8719.2012.00165.x. [DOI] [PubMed] [Google Scholar]
- 2.Arciero JC, Carlson BE, Secomb TW. Theoretical model of metabolic blood flow regulation: roles of ATP release by red blood cells and conducted responses. American journal of physiology Heart and circulatory physiology. 2008;295:H1562–1571. doi: 10.1152/ajpheart.00261.2008. [DOI] [PMC free article] [PubMed] [Google Scholar]
- 3.Bagher P, Segal SS. Regulation of blood flow in the microcirculation: role of conducted vasodilation. Acta Physiol (Oxf) 2011;202:271–284. doi: 10.1111/j.1748-1716.2010.02244.x. [DOI] [PMC free article] [PubMed] [Google Scholar]
- 4.Bateman RM, Sharpe MD, Goldman D, Lidington D, Ellis CG. Inhibiting nitric oxide overproduction during hypotensive sepsis increases local oxygen consumption in rat skeletal muscle. Crit Care Med. 2008;36:225–231. doi: 10.1097/01.CCM.0000295307.92027.2F. [DOI] [PubMed] [Google Scholar]
- 5.Bolon ML, Kidder GM, Simon AM, Tyml K. Lipopolysaccharide reduces electrical coupling in microvascular endothelial cells by targeting connexin40 in a tyrosine-, ERK1/2-, PKA-, and PKC-dependent manner. J Cell Physiol. 2007;211:159–166. doi: 10.1002/jcp.20928. [DOI] [PubMed] [Google Scholar]
- 6.Collins DM, McCullough WT, Ellsworth ML. Conducted vascular responses: communication across the capillary bed. Microvasc Res. 1998;56:43–53. doi: 10.1006/mvre.1998.2076. [DOI] [PubMed] [Google Scholar]
- 7.Dietrich HH. Effect of locally applied epinephrine and norepinephrine on blood flow and diameter in capillaries of rat mesentery. Microvascular research. 1989;38:125–135. doi: 10.1016/0026-2862(89)90021-6. [DOI] [PubMed] [Google Scholar]
- 8.Dietrich HH, Ellsworth ML, Sprague RS, Dacey RG., Jr. Red blood cell regulation of microvascular tone through adenosine triphosphate. Am J Physiol Heart Circ Physiol. 2000;278:H1294–1298. doi: 10.1152/ajpheart.2000.278.4.H1294. [DOI] [PubMed] [Google Scholar]
- 9.Dietrich HH, Horiuchi T, Xiang C, Hongo K, Falck JR, Dacey RG., Jr. Mechanism of ATP-induced local and conducted vasomotor responses in isolated rat cerebral penetrating arterioles. Journal Of Vascular Research. 2009;46:253–264. doi: 10.1159/000167273. [DOI] [PMC free article] [PubMed] [Google Scholar]
- 10.Dietrich HH, Tyml K. Capillary as a communicating medium in the microvasculature. Microvascular research. 1992;43:87–99. doi: 10.1016/0026-2862(92)90008-d. [DOI] [PubMed] [Google Scholar]
- 11.Duza T, Sarelius IH. Conducted dilations initiated by purines in arterioles are endothelium dependent and require endothelial Ca2+ American journal of physiology Heart and circulatory physiology. 2003;285:H26–37. doi: 10.1152/ajpheart.00788.2002. [DOI] [PubMed] [Google Scholar]
- 12.Ellis CG, Bateman RM, Sharpe MD, Sibbald WJ, Gill R. Effect of a maldistribution of microvascular blood flow on capillary O2 extraction in sepsis. Am J Physiol Heart Circ Physiol. 2002;282:H156–164. doi: 10.1152/ajpheart.2002.282.1.H156. [DOI] [PubMed] [Google Scholar]
- 13.Ellis CG, Goldman D, Hanson M, Stephenson AH, Milkovich S, Benlamri A, Ellsworth ML, Sprague RS. Defects in oxygen supply to skeletal muscle of prediabetic ZDF rats. American journal of physiology Heart and circulatory physiology. 2010;298:H1661–1670. doi: 10.1152/ajpheart.01239.2009. [DOI] [PMC free article] [PubMed] [Google Scholar]
- 14.Ellis CG, Jagger J, Sharpe M. The microcirculation as a functional system. Crit Care. 2005;9(Suppl 4):S3–8. doi: 10.1186/cc3751. [DOI] [PMC free article] [PubMed] [Google Scholar]
- 15.Ellis CG, Wrigley SM, Groom AC. Heterogeneity of red blood cell perfusion in capillary networks supplied by a single arteriole in resting skeletal muscle. Circ Res. 1994;75:357–368. doi: 10.1161/01.res.75.2.357. [DOI] [PubMed] [Google Scholar]
- 16.Ellsworth ML, Ellis CG, Goldman D, Stephenson AH, Dietrich HH, Sprague RS. Erythrocytes: oxygen sensors and modulators of vascular tone. Physiology (Bethesda) 2009;24:107–116. doi: 10.1152/physiol.00038.2008. [DOI] [PMC free article] [PubMed] [Google Scholar]
- 17.Ellsworth ML, Ellis CG, Popel AS, Pittman RN. Role of microvessels in oxygen-suppy to tissue. News Physiol Sci. 1994;9:119–123. doi: 10.1152/physiologyonline.1994.9.3.119. [DOI] [PMC free article] [PubMed] [Google Scholar]
- 18.Ellsworth ML, Forrester T, Ellis CG, Dietrich HH. The erythrocyte as a regulator of vascular tone. Am J Physiol. 1995;269:H2155–2161. doi: 10.1152/ajpheart.1995.269.6.H2155. [DOI] [PubMed] [Google Scholar]
- 19.Ellsworth ML, Pittman RN. Arterioles supply oxygen to capillaries by diffusion as well as by convection. The American journal of physiology. 1990;258:H1240–1243. doi: 10.1152/ajpheart.1990.258.4.H1240. [DOI] [PubMed] [Google Scholar]
- 20.Ellsworth ML, Sprague RS. Regulation of blood flow distribution in skeletal muscle: role of erythrocyte-released ATP. J Physiol. 2012 doi: 10.1113/jphysiol.2012.233106. accepted. [DOI] [PMC free article] [PubMed] [Google Scholar]
- 21.Frisbee JC. Hypertension-independent microvascular rarefaction in the obese Zucker rat model of the metabolic syndrome. Microcirculation. 2005;12:383–392. doi: 10.1080/10739680590960241. [DOI] [PubMed] [Google Scholar]
- 22.Ghonaim NW, Lau LW, Goldman D, Ellis CG, Yang J. A Micro-Delivery Approach for Studying Microvascular Responses to Localized Oxygen Delivery. Microcirculation. 2011;18:646–654. doi: 10.1111/j.1549-8719.2011.00132.x. [DOI] [PMC free article] [PubMed] [Google Scholar]
- 23.Golub AS, Song BK, Pittman RN. The rate of O loss from mesenteric arterioles is not unusually high. American journal of physiology Heart and circulatory physiology. 2011;301:H737–745. doi: 10.1152/ajpheart.00353.2011. [DOI] [PMC free article] [PubMed] [Google Scholar]
- 24.Hanson MS, Ellsworth ML, Achilleus D, Stephenson AH, Bowles EA, Sridharan M, Adderley S, Sprague RS. Insulin inhibits low oxygen-induced ATP release from human erythrocytes: implication for vascular control. Microcirculation. 2009;16:424–433. doi: 10.1080/10739680902855218. [DOI] [PMC free article] [PubMed] [Google Scholar]
- 25.Hester RL, Hammer LW. Venular-arteriolar communication in the regulation of blood flow. American journal of physiology Regulatory, integrative and comparative physiology. 2002;282:R1280–1285. doi: 10.1152/ajpregu.00744.2001. [DOI] [PubMed] [Google Scholar]
- 26.Jackson DN, Moore AW, Segal SS. Blunting of rapid onset vasodilatation and blood flow restriction in arterioles of exercising skeletal muscle with ageing in male mice. The Journal of physiology. 2010;588:2269–2282. doi: 10.1113/jphysiol.2010.189811. [DOI] [PMC free article] [PubMed] [Google Scholar]
- 27.Jackson WF, Duling BR. The oxygen sensitivity of hamster cheek pouch arterioles. In vitro and in situ studies. Circulation research. 1983;53:515–525. doi: 10.1161/01.res.53.4.515. [DOI] [PubMed] [Google Scholar]
- 28.Jagger JE, Bateman RM, Ellsworth ML, Ellis CG. Role of erythrocyte in regulating local O2 delivery mediated by hemoglobin oxygenation. Am J Physiol Heart Circ Physiol. 2001;280:H2833–2839. doi: 10.1152/ajpheart.2001.280.6.H2833. [DOI] [PubMed] [Google Scholar]
- 29.Japee SA, Ellis CG, Pittman RN. Flow visualization tools for image analysis of capillary networks. Microcirculation. 2004;11:39–54. doi: 10.1080/10739680490266171. [DOI] [PubMed] [Google Scholar]
- 30.Japee SA, Pittman RN, Ellis CG. A new video image analysis system to study red blood cell dynamics and oxygenation in capillary networks. Microcirculation. 2005;12:489–506. doi: 10.1080/10739680591003332. [DOI] [PubMed] [Google Scholar]
- 31.Knowles AF. The GDA1_CD39 superfamily: NTPDases with diverse functions. Purinergic Signal. 2011;7:21–45. doi: 10.1007/s11302-010-9214-7. [DOI] [PMC free article] [PubMed] [Google Scholar]
- 32.Krogh A. The supply of oxygen to the tissues and the regulation of the capillary circulation. J Physiol. 1919;52:457–474. doi: 10.1113/jphysiol.1919.sp001844. [DOI] [PMC free article] [PubMed] [Google Scholar]
- 33.Kurjiaka DT, Segal SS. Conducted vasodilation elevates flow in arteriole networks of hamster striated muscle. The American journal of physiology. 1995;269:H1723–1728. doi: 10.1152/ajpheart.1995.269.5.H1723. [DOI] [PubMed] [Google Scholar]
- 34.Lam C, Tyml K, Martin C, Sibbald W. Microvascular perfusion is impaired in a rat model of normotensive sepsis. The Journal of clinical investigation. 1994;94:2077–2083. doi: 10.1172/JCI117562. [DOI] [PMC free article] [PubMed] [Google Scholar]
- 35.Lidington D, Ouellette Y, Tyml K. Communication of agonist-induced electrical responses along ‘capillaries’ in vitro can be modulated by lipopolysaccharide, but not nitric oxide. Journal Of Vascular Research. 2002;39:405–413. doi: 10.1159/000064519. [DOI] [PubMed] [Google Scholar]
- 36.Loffler M, Morote-Garcia JC, Eltzschig SA, Coe IR, Eltzschig HK. Physiological roles of vascular nucleoside transporters. Arterioscler Thromb Vasc Biol. 2007;27:1004–1013. doi: 10.1161/ATVBAHA.106.126714. [DOI] [PubMed] [Google Scholar]
- 37.Melani A, Corti F, Stephan H, Muller CE, Donati C, Bruni P, Vannucchi MG, Pedata F. Ecto-ATPase inhibition: ATP and adenosine release under physiological and ischemic in vivo conditions in the rat striatum. Exp Neurol. 2011 doi: 10.1016/j.expneurol.2011.09.036. [DOI] [PubMed] [Google Scholar]
- 38.Moschandreou TE, Ellis CG, Goldman D. Influence of tissue metabolism and capillary oxygen supply on arteriolar oxygen transport: a computational model. Mathematical biosciences. 2011;232:1–10. doi: 10.1016/j.mbs.2011.03.010. [DOI] [PMC free article] [PubMed] [Google Scholar]
- 39.Poole DC, Brown MD, Hudlicka O. Counterpoint: There is not capillary recruitment in active skeletal muscle during exercise. Journal of applied physiology. 104:891–893. doi: 10.1152/japplphysiol.00779.2007a. discussion 893-894, 2008. [DOI] [PubMed] [Google Scholar]
- 40.Roy TK, Pries AR, Secomb TW. Theoretical comparison of wall-derived and erythrocyte-derived mechanisms for metabolic flow regulation in heterogeneous microvascular networks. American journal of physiology Heart and circulatory physiology. 2012 doi: 10.1152/ajpheart.01176.2011. [DOI] [PMC free article] [PubMed] [Google Scholar]
- 41.Segal SS. Cell-to-cell communication coordinates blood flow control. Hypertension. 1994;23:1113–1120. doi: 10.1161/01.hyp.23.6.1113. [DOI] [PubMed] [Google Scholar]
- 42.Segal SS. Regulation of blood flow in the microcirculation. Microcirculation. 2005;12:33–45. doi: 10.1080/10739680590895028. [DOI] [PubMed] [Google Scholar]
- 43.Song H, Tyml K. Evidence for sensing and integration of biological signals by the capillary network. The American journal of physiology. 1993;265:H1235–1242. doi: 10.1152/ajpheart.1993.265.4.H1235. [DOI] [PubMed] [Google Scholar]
- 44.Sprague RS, Ellsworth ML, Stephenson AH, Kleinhenz ME, Lonigro AJ. Deformation-induced ATP release from red blood cells requires CFTR activity. Am J Physiol. 1998;275:H1726–1732. doi: 10.1152/ajpheart.1998.275.5.H1726. [DOI] [PubMed] [Google Scholar]
- 45.Sridharan M, Sprague RS, Adderley SP, Bowles EA, Ellsworth ML, Stephenson AH. Diamide decreases deformability of rabbit erythrocytes and attenuates low oxygen tension-induced ATP release. Experimental biology and medicine. 2010;235:1142–1148. doi: 10.1258/ebm.2010.010118. [DOI] [PMC free article] [PubMed] [Google Scholar]
- 46.Stein JC, Ellis CG, Ellsworth ML. Relationship between capillary and systemic venous PO2 during nonhypoxic and hypoxic ventilation. The American journal of physiology. 1993;265:H537–542. doi: 10.1152/ajpheart.1993.265.2.H537. [DOI] [PubMed] [Google Scholar]
- 47.Wan J, Ristenpart WD, Stone HA. Dynamics of shear-induced ATP release from red blood cells. Proceedings of the National Academy of Sciences of the United States of America. 2008;105:16432–16437. doi: 10.1073/pnas.0805779105. [DOI] [PMC free article] [PubMed] [Google Scholar]
- 48.Weibel ER. The pathway for oxygen. Harvard University Press; Cambridge, MA: 1984. [Google Scholar]
- 49.Welsh DG, Segal SS. Endothelial and smooth muscle cell conduction in arterioles controlling blood flow. The American journal of physiology. 1998;274:H178–186. doi: 10.1152/ajpheart.1998.274.1.H178. [DOI] [PubMed] [Google Scholar]
- 50.Wolfle SE, Chaston DJ, Goto K, Sandow SL, Edwards FR, Hill CE. Non-linear relationship between hyperpolarisation and relaxation enables long distance propagation of vasodilatation. The Journal of physiology. 2011;589:2607–2623. doi: 10.1113/jphysiol.2010.202580. [DOI] [PMC free article] [PubMed] [Google Scholar]
- 51.Woodward HN, Anwar A, Riddle S, Taraseviciene-Stewart L, Fragoso M, Stenmark KR, Gerasimovskaya EV. PI3K, Rho, and ROCK play a key role in hypoxia-induced ATP release and ATP-stimulated angiogenic responses in pulmonary artery vasa vasorum endothelial cells. Am J Physiol Lung Cell Mol Physiol. 2009;297:L954–964. doi: 10.1152/ajplung.00038.2009. [DOI] [PMC free article] [PubMed] [Google Scholar]
- 52.Yoon YS, Uchida S, Masuo O, Cejna M, Park JS, Gwon HC, Kirchmair R, Bahlman F, Walter D, Curry C, Hanley A, Isner JM, Losordo DW. Progressive attenuation of myocardial vascular endothelial growth factor expression is a seminal event in diabetic cardiomyopathy: restoration of microvascular homeostasis and recovery of cardiac function in diabetic cardiomyopathy after replenishment of local vascular endothelial growth factor. Circulation. 2005;111:2073–2085. doi: 10.1161/01.CIR.0000162472.52990.36. [DOI] [PubMed] [Google Scholar]