

Abstract
Purpose
The present study aimed to quantify retinal and choroidal blood flow (BF) during light, dark adaptation and flicker light stimulation using the microsphere technique.
Materials and Methods
Adult male Sprague–Dawley rats were anesthetized with isoflurane. Eyes were dark (Group I, n = 8), light (Group II, n = 8) adapted or stimulated with 10Hz flicker light (Group III, n = 10). Retinal and choroidal BF were measured by a previously established method, using a mixture of 8 μm yellow-green and 10 μm red fluorescent microspheres. The microspheres were counted ex vivo in the dissected retina and choroid and in the reference arterial blood under a fluorescent microscope.
Results
The choroidal BF was 64.8 ± 29 μl/min (mean ± SD) during dark adaptation, not significantly different from that during light adaptation (66.0 ± 17.8 μl/min). The retinal BF was 13.5 ± 3.2 μl/min during 10 Hz flickering light stimulation, significantly higher than that during dark adaptation in the control fellow eyes (9.9 ± 2.9 μl/min). The choroidal BF values were not statistically different between flicker stimulation and dark adaptation. Retinal BF was 11.6 ± 2.9 μl/min during light adaptation. Dark adaptation did not increase retinal BF (Group I, 8.2 ± 2.4 μl/min; Group II, 9.9 ± 2.9 μl/min).
Conclusions
These findings argue against a dark-induced or flicker-induced functional hyperemia in the choroid as a result of the demands of the outer retina. Retinal BF was not higher during dark adaptation. Our data support the conclusion that the inner retina has a higher energy demand in flicker conditions relative to dark.
Keywords: Blood flow, choroid, dark adaptation, flicker light stimulation, light adaptation, microspheres, rat, retina
Introduction
The retina is nourished by both the central retinal artery and the choroidal circulation in most mammals to maintain proper function and the metabolic needs of the retina. The blood flow (BF) and its regulation differ significantly between the two circulations. Basal choroidal BF is higher compared to retinal BF. The choroid is more responsive to neural and myogenic stimuli,1 while the retinal circulation is more responsive to retinal metabolism.2,3
The effects of flickering light stimulation (flicker), and dark and light adaptation on ocular BF have been studied using various techniques (see Riva et al.2 for review). Retinal BF responses to flicker have been studied in humans, monkeys and cats.2,4,5 There is a consensus that retinal BF increases during flicker2,4,5 and choroidal BF is unchanged.6 By contrast, BF responses to light and dark adaptation are controversial. Retinal BF has been reported to increase after the transition from light to dark in humans.7 Other studies showed human retinal BF transiently increased following the transition from dark to light,8 while the subfoveal choroidal BF decreased from light to dark.9,10 Retinal BF responses during light and dark adaptation have been reported to increase in some animals and decrease in others.11 Moreover, ocular BF responses to flicker, light and dark adaptation have not been previously assessed in rats, although rats have been widely used as models of retinal diseases.
We recently modified the traditional microsphere method by comparing various microsphere size and dose to enable reliable retinal and choroidal BF measurements specifically in rats.12 We demonstrated that microspheres smaller than the most commonly used size of 15 μm are required to reliably measure rat ocular BF. The optimal dose and size of the microspheres used in rats was 2.5 million and 8 μm diameter for the retina; and 0.5 million and 10 μm diameter for the choroid due to different capillary sizes between the two vascular beds. By using a mixture of the two different-sized fluorescent microspheres with two different colors, the retinal and choroidal BF can be measured in the same animals. This modified microsphere technique has been effectively used to detect retinal and choroidal BF changes induced by hypocapnia and hypercapnia in rats.13
The current study investigated retinal and choroidal BF in light and dark adaptation, and during flicker in rats using this modified approach.12
Methods
Animal Preparation
All animal experiments were performed with IACUC approval and in accordance with the ARVO Statement for the Use of Animals in Ophthalmic and Vision Research. The animal preparation was similar to that reported previously.14,15 Adult male Sprague–Dawley rats (n = 26, 250–300g) were anesthetized with 2% isoflurane, intubated and ventilated (Harvard apparatus, Model 683, South Natick, MA). The respiratory rate of the ventilator was set between 57 and 60 stroke/min. End-tidal CO2 was continuously monitored by a capnometer (Surgivet V9004, Waukesha, WI) and kept within normal range (3–3.5%). A regulated heating pad was used to maintain body temperature at 37°C. The right femoral artery was cannulated with PE50 tubing for mean arterial blood pressure (MABP) and blood-gas measurement. MABP was continuously monitored via the arterial line by a BIOPAC system (Acknowledge, Santa Barbara, CA) and was maintained between 90 and 110 mmHg as needed using hetastarch (0.5–1.5 ml/animal, i.v.). The left femoral artery was cannulated with a PE10 tubing for collecting the reference blood sample of circulating microspheres during the BF measurement. The right femoral vein was also catheterized for drug administration (e.g. heparin, pancuronium bromide and hetastarch). After surgery, the isoflurane level was reduced to 1.2–1.5% and the animal was then positioned in a custom-built head holder. Atropine (1%, topical, Bausch & Lomb, Tampa, FL) was applied to dilate the pupil. Pancuronium bromide (3 mg/kg, i.v.) was administered to paralyze the animals. Before the BF measurements, arterial PaCO2 was measured (IRMA, Series 2000, DiaMedic, St. Paul, MN) and maintained within normal physiological ranges by adjusting the tidal volume. Arterial PaO2 was not recorded. A previous study with similar ventilation parameters and identical anesthesia resulted in a PaO2 of 100–105 mmHg.15
Light, Dark Adaptation and Flicker Light Stimulation
In Group I, the rat head was placed into a custom-made cover for dark adaptation for at least 30 min (n = 8). In Group II, rats were light adapted for 30 min (n = 8) using calibrated LED achromatic light sources placed on the holder at a fixed distance from the eyes16,17 to ensure the same luminance exposure (17,500 cd/m2) across animals. Retinal and choroidal BF values from both eyes were averaged and compared between Groups I and II with an unpaired t-test. In Group III, 10Hz achromatic flicker (50 ms pulse width, flickering between dark and 35,000 cd/m2) was applied to one eye while the control fellow eye was covered and dark adapted (n = 10). In the flicker study, retinal and choroidal BF for the flicker-stimulated eye was compared with the dark-adapted fellow eye, which allowed the use of a paired t-test and minimized intrasubject variation.
Microsphere Experiments
The retinal and choroidal BF was measured using a previously optimized microsphere technique for the rat eye.12 The BF cannot be accurately measured without using optimized microsphere size and dose. A mixture of 2.5 million 8 μm yellow-green (absorption/emission: 505/515 nm) and 0.5 million 10 μm red (absorption/emission: 580/605nm) fluorescent microspheres (FluoSpheres, Molecular Probes, Eugene, OR) were used. The microspheres were suspended in a 350-550 μl solution of 0.15M NaCl and 0.05% Tween 20. The suspension was stored in a 37°C water bath and sonicated for 10–20 s immediately before injection. Our previous study showed that this technique is able to detect up to 80% increases in retinal BF under hypercapnic challenge (from PaCO2 of 35 mmHg to 45–50 mmHg) while the choroidal BF was not affected. A statistic power calculation based on our pilot data showed that at a probability of 5% and a power of 80% with unpaired t-test requires 12 and 18 animals to demonstrate a 25% difference in retinal and choroidal BF between two groups, respectively.
A 2 cm vertical incision was made along the midline of the abdomen below the xiphoid. The incision was kept open using an ocular speculum to allow the apex of the heart to be visualized through the diaphragm. Heparin (0.5–1 mg/kg, i.v.) was administered to prevent blood clotting. A 27-gauge needle, connected to 15 cm PE50 tubing, was inserted into the left ventricle through the diaphragm. Slight pressure toward the heart was applied to hold the needle position. A mixture of dual-size microspheres was then injected into the left ventricle. The injection duration was 35–40s. An arterial blood sample was collected for 1 min starting at the onset of microsphere injection. The animals were then euthanized by euthansol (0.2 ml, Delmarva Laboratories Inc. Fort Worth, TX)
Both eyes were enucleated. The anterior portion of the eye, ∼2mm behind the limbus, was removed (including cornea, iris, lens and ciliary body). The entire retina was dissected from the remaining eyecup and flat-mounted on a glass slide. The choroid together with the underlying sclera was flat-mounted with four tension-relief cuts. The tissue was sealed with fluorescence mounting medium (Vectashield, Vector Laboratories, Burlingame, CA) and cover slips. The microspheres were counted in the retina and the choroid under a fluorescent microscope with an image analysis system (Bioquant, R&M Biometrics Inc., Nashville, TN). The microspheres in the arterial reference blood samples were also counted after the blood was hypo-osmotic hemolyzed and analyzed in a hemocytometer counting chamber (Hausser Scientific, Horsham, PA). The BF per tissue was calculated using the following equation:
For Groups I and II, BF data from both eyes were averaged and comparison was made between light (Group I) versus dark (Group II) adaptation. For Group III, BF for the flicker-stimulated eye was compared with the dark-adapted fellow eye in the same animals. Statistical analysis was performed by unpaired (Group I and II) and paired (Group III) t-tests. A p<0.05 was set as the level for rejecting the null hypothesis.
Results
The arterial pCO2, pH and MABP values in dark adaptation, light adaptation and flicker light stimulation groups are summarized in Table 1. Arterial blood was sampled from the femoral artery. No significant differences (p>0.05) were observed between groups except the flicker group (Group III), which had a slightly higher baseline MABP compared with the other groups.
Table 1.
Arterial pCO2, pH and MABP (in mmHg) values in dark adaptation (n = 8), light adaptation (n = 8) and flicker light stimulation (n = 10) groups.
| Dark adaptation | Light adaptation | Flicker stimulation | |
|---|---|---|---|
| Arterial pCO2 | 37.6 ± 4.7 | 40.6 ± 2.1 | 39.2 ± 2.3 |
| Arterial pH | 7.46 ± 0.1 | 7.43 ± 0.1 | 7.47 ± 0.1 |
| MABP | 93.2 ± 10.7 | 94.6 ± 8.7 | 108 ± 9.8* |
Arterial blood was sampled from the femoral artery. Data were presented as mean ± SD.
p<0.05 compared with other groups.
The present study had two experimental goals: (i) compare retinal and choroidal BF during light and dark adaptation and (ii) compare retinal and choroidal BF during flicker. Figure 1 shows representative fluorescent images of the retina and choroid. The green (8 μm) microspheres were counted for the retina and the red (10 μm) microspheres were counted for the choroid. The retinal BF values measured during dark (Group I, n = 8) and light (Group II, n = 8) adaptation were 8.2 ± 2.4 (mean ± SD) and 11.6 ± 2.9 μl/min per tissue, respectively (Figure 2). In the choroid, the corresponding BF values were 64.8 ± 29 and 66.0 ± 17.8 μl/min per tissue, respectively. The BF values between dark and light adaptation were significantly different in the retina (p = 0.02), but not in the choroid (p = 0.92).
Figure 1.
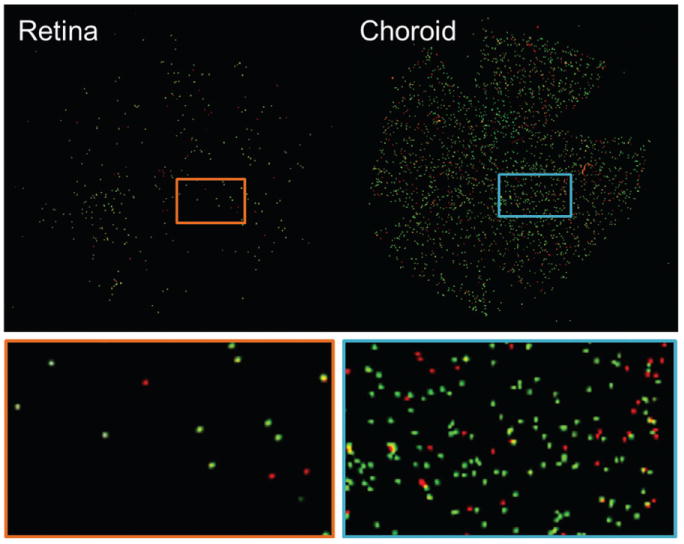
Representative fluorescent images of the retina and choroid. The retinal and choroidal BF values were determined by dividing the numbers of green (8 μm) microspheres in the retina and red (10 μm) microspheres in the choroid to the corresponding numbers in the arterial reference blood.
Figure 2.
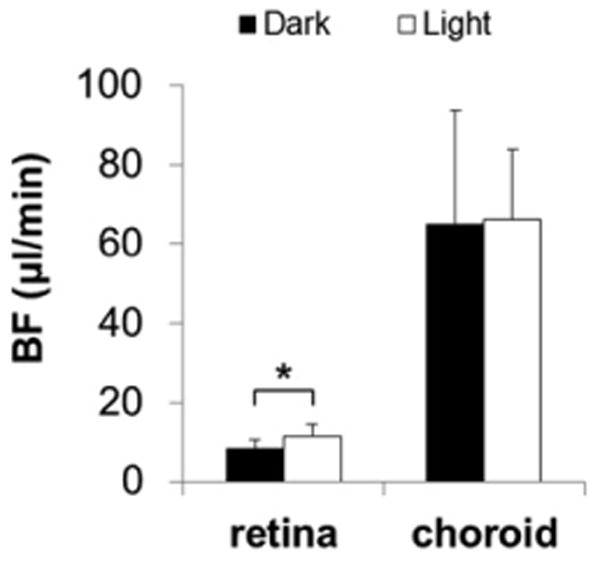
The retinal and choroidal BF measured during dark (Group I, n = 8) and light (Group II, n = 8) adaptation with dual-size and dual-dose mixed fluorescent microspheres. The luminance level for light adaptation was 17,500 cd/m2. The retinal BF was significantly higher during light adaptation compared with dark adaptation, while choroidal BF showed no change. *p<0.05, error bars are SD. Note that retinal BF showed no significant difference between Group II and the dark-adapted eye in Group III.
The retinal BF values in the flicker-stimulated and dark-adapted eyes (Group III, n = 10) were 9.9 ± 2.9 and 13.5 ± 3.2 μl/min per tissue, respectively (Figure 3). In the choroid, the corresponding BF values were 80.3 ±55.6 and 77.5 ± 58.8 μl/min per tissue, respectively. The mean BF values between dark-adapted and flicker-stimulated eyes were significantly different in the retina (p = 0.0002), but not in the choroid (p = 0.52, paired t-test).
Figure 3.
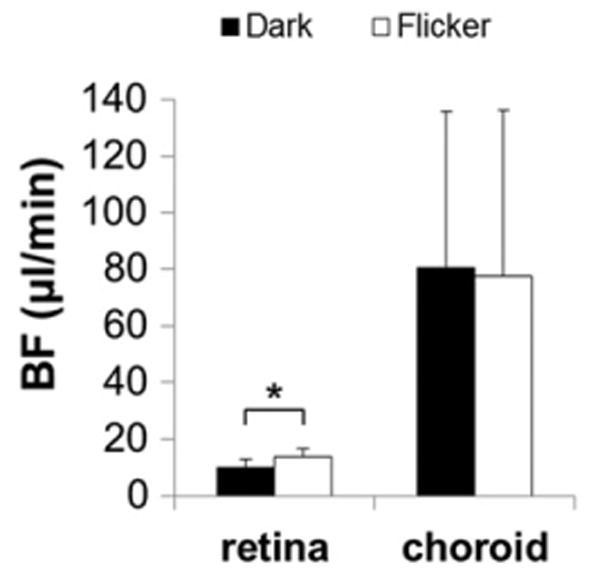
The retinal and choroidal BF measured during dark and flicker light stimulation (Group III, n = 10). Flicker light stimulation at 10Hz and 35,000 cd/m2 was applied to one eye (in pseudo-random order) by the LED light source while the other eye was covered and dark adapted. The retinal BF was significantly higher during flicker light stimulation compared with dark adaptation, while choroidal BF showed no change. *p<0.05, error bars are SD.
To further verify whether light adaptation increases retinal BF, comparison was made between (i) Group I and the dark-adapted eye in Group III and (ii) Group II and the dark-adapted eye in Group III. As expected, no significant difference was found between the dark adapted retinal BF values in Groups I and III. However, although there was a tendency for BF to be slightly higher in light, the difference between dark-adapted retinal BF in Group III and light-adapted retinal BF in Group II was not significant (p = 24). This result argues against the conclusion drawn from Figure 2.
Discussion
Light Versus Dark Adaptation
The metabolic energy demand to maintain the “dark current” during dark adaptation in the outer retina has been shown to be higher than during light adaptation.18,19 Light adaptation has been shown to reduce oxygen consumption by 40%, glucose consumption by 44% and lactate formation by 63% in the pig outer retina relative to dark adaptation.20 Similarly, light adaptation has been shown to reduce oxygen consumption by 18–50%,3,21 glucose consumption by 48% and lactate formation by 38% in the cat outer retina relative to dark adaptation.21 Outer retinal oxygen consumption has been shown to increase by 47.8% when dark-adapted compared with light-adapted.22 Dark adaptation has been shown to increase manganese uptake (which is associated with increased calcium activity) in the rat outer retina using MRI.23 To support the increased metabolic needs in dark relative to light, it is conceivable that both retinal and choroidal BF could increase (i.e. functional hyperemia).
Choroidal Circulation
The available evidence argues against a dark-induced functional hyperemia in the choroid. Laser Doppler flowmetry measurements in humans indicate a decrease in dark-adapted subfoveal choroidal BF of 18%9 and 8–12%.10 In the present study, we found no significant choroidal BF differences between light versus dark adaptation, similar to the data reported by using the hydrogen clearance method.24 By contrast, there is evidence for a light-activated neural vasodila-tory reflex in the choroid of birds.25 The discrepant findings could be due to the differences in species, anesthesia, BF measurement techniques or experimental conditions (e.g. light levels and adaptation duration), all of which warrant further investigation.
Most available evidence suggests that outer retinal oxygen/glucose consumption is increased when the retina is fully dark adapted, but the choroidal BF is unaltered. The neurovascular coupling between the outer retina and choroid is still unclear. We suspect that the choroid does not show a clear response to the outer retinal metabolism because a chemical signal generated from the photoreceptors would have to cross the retinal pigment epithelium, Bruch's membrane and the choriocapillaris to affect the regulatory system in the choroidal arterioles. The signal may become significantly weakened by enzymatic degredation, uptake systems and choriocapillaris washout over the long diffusion distance. To our knowledge, there is also no direct neural connection between the photoreceptors and choroidal arterioles. It is also possible that the high basal choroidal BF is sufficient to maintain adequate oxygen supplies irrespective of light or dark adaptation. The arteriovenous gradient of nutrients and waste products from the metabolism of the outer retina may also be low. Therefore, increased metabolic demand might be compensated by increasing extraction from the blood without the need for BF to increase.26
Retinal Circulation
The energy demand on the retinal circulation between light and dark adaptation is, by contrast, complicated. First, it is possible that the increased energy metabolism in the outer retina in the dark could induce functional hyperemia in the retinal circulation. Human retinal BF velocity increased 40–70% from light to dark as measured by laser Doppler velocimetry.7,19 The authors suggested that this is driven by increased oxygen consumption in the dark by the photoreceptor–RPE retinal pigment epithelium complex. In contrast, human retinal BF transiently increased (∼37%) following the transition from dark to light.8 Moreover, retinal BF was reported to increase in some animals and decrease in others from light to dark adaptation in cats.11 Our data from Group I (dark-adapted) and Group II (light-adapted) showed higher retinal BF in light. However, the retinal BF in the dark-adapted eye from Group III showed no significant difference from Group II. In short, our data argue against a dark-induced functional BF increases in the retina. This is perhaps not surprising because the choroid, not the retinal circulation, supports the outer retina.27 Since the retinal circulation predominantly supplies the energy demand from the inner retina,28 the retinal BF is expected to couple strongly to the energetic demands of inner retina. Previous studies using 3H-2-deoxyglucose autoradiography,29 oxygen microelectrodes30,31 and direct measurement of metabolites, 23,33 however, showed no difference in inner retinal metabolism between dark and light adaptation. A possible reason is that the neural activities of the ON and OFF bipolar cells could balance out the difference between light and dark adaptation, resulting in no net activity changes in the inner retina between light and dark. Though there are several studies showing no retinal metabolism changes in light, it has been reported that nitric oxide (a potent vasodilator that is released in increased neural activity) in the vitreous adjacent to the rat retina decreased during dark adaptation and increased in light.34 Our recent data using high-resolution manganese-enhanced MRI (20 × 20 μm inplane resolution) also showed significantly higher calcium-weighted neuronal activity in the outer retina during dark adaptation as expected. Interestingly, inner retina showed higher activity during light adaptation compared to the dark-adapted fellow eye.35 The discrepancies in the published literature could be due to differences in luminance of light adaptation, which was as high as 17,500 cd/m2 in our study. At such high luminance, the neuronal activity and temperature in the retina might be higher compared with that under lower luminance. Whether the increased BF is a direct response to different metrics of “neural” activities (such as glucose consumption or oxygen consumption) during neurotransmission warrants further investigation. It should be noted that the BF difference between light and dark may also be exaggerated by the variation of BF between groups (see below).
Flicker Light Stimulation
Choroidal Circulation
Consistent with other studies,6,36 we found rat choroidal BF to be largely unresponsive to flicker stimulation. It has also been reported that there were no changes arteriovenous difference in O2 saturation in the choroid during 10 Hz flicker stimulation in rats.37 A recent study using contrast-enhanced fMRI showed that the choroidal blood volume was also not responsive to changing flicker stimulation frequency, luminance and color.16
Retinal Circulation
Retinal BF has been reported to increase by 30–50% during flicker stimulation in humans, monkeys and cats.2,4,5 A contrast-enhanced blood-volume fMRI study depicted tuning curve characteristics in the rat inner retina in response to changing flicker stimulation frequency, luminance and color.16 Our current findings showed a 36% increase in rat retinal BF, in agreement with the above-mentioned published studies. Consistent with retinal functional hyperemia, flicker stimulation increased glucose consumption and lactate formation in the pig retina.20 Retinal arteriovenous oxygen tension difference during 10Hz flicker stimulation also increased 50% in rats and 60% in humans.38 In short, the results for flicker light in the literature are consistent and our findings on flicker stimulation are in general agreement. Note that the light used for light adaptation (17,500 cd/m2) and flicker (35,000 cd/m2) in the present study was very strong for the rod-dominated rat retina. It is possible that the flicker may have light-adapted the eye and led to similar changes in metabolism and flow compared with steady light. Hence, comparison between light adaptation and flicker in the present study needs to be made with caution. We suspect that flicker light stimuli may evoke higher retinal BF than light adaptation in the range of 10–100 cd/m2.
The potential drawback of the present study is that the light versus dark adaptation study was performed in two separate groups of rats. The BF from both eyes were averaged and compared. The flicker versus dark study was performed in the same group of rats. The flicker light was only applied to one eye and the fellow eye was covered as dark adaptation. This was because the original intent was only to measure basal retinal and choroidal BF values in albino rats (which has not been done previously) and the functional modulation experiments were added later on. A better experimental design would be to compare light versus dark adaptation in the same group of rats as that in the flicker group.
Conclusions
The present study investigated retinal and choroidal BF during light, dark adaptation and flicker light stimulation in rats. The retinal BF increased during light adaptation and flicker light stimulation. Choroidal BF was unresponsive to light–dark adaptation and flicker stimulation. Our current findings argue against a dark-induced functional hyperemia from the demands of the outer retina, but show no significantly higher retinal BF during dark adaptation. To our knowledge, this is the first study to examine retinal and choroidal BF response to light, dark adaptation and flicker light stimulation in rats. Future studies will apply these techniques to investigate whether the retinal and the choroidal BF regulate differently in retinal disease models such as diabetic retinopathy, retinal degeneration and glaucoma.
Acknowledgments
This work was supported in part by the NIH (EY009702, EY014211 and EY018855), a MERIT Award from the Department of Veterans Affairs, the San Antonio Life Science Institute, the American Heart Association (10POST4290091), a Clinical Translational Science Award (CTSA, parent grant UL1RR025767) and the San Antonio Area Foundation.
Footnotes
Declaration of Interest: The authors report no conflicts of interest.
References
- 1.Kiel JW. Choroidal myogenic autoregulation and intraocular pressure. Exp Eye Res. 1994;58:529–543. doi: 10.1006/exer.1994.1047. [DOI] [PubMed] [Google Scholar]
- 2.Riva CE, Logean E, Falsini B. Visually evoked hemodynamical response and assessment of neurovascular coupling in the optic nerve and retina. Prog Retin Eye Res. 2005;24:183–215. doi: 10.1016/j.preteyeres.2004.07.002. [DOI] [PubMed] [Google Scholar]
- 3.Linsenmeier RA. Effects of light and darkness on oxygen distribution and consumption in the cat retina. J Gen Physiol. 1986;88:521–542. doi: 10.1085/jgp.88.4.521. [DOI] [PMC free article] [PubMed] [Google Scholar]
- 4.Garhofer G, Zawinka C, Resch H, Huemer KH, Dorner GT, Schmetterer L. Diffuse luminance flicker increases blood flow in major retinal arteries and veins. Vision Res. 2004;44:833–838. doi: 10.1016/j.visres.2003.11.013. [DOI] [PubMed] [Google Scholar]
- 5.Riva CE, Logean E, Falsini B. Temporal dynamics and magnitude of the blood flow response at the optic disk in normal subjects during functional retinal flicker-stimulation. Neurosci Lett. 2004;356:75–78. doi: 10.1016/j.neulet.2003.08.069. [DOI] [PubMed] [Google Scholar]
- 6.Garhofer G, Huemer KH, Zawinka C, Schmetterer L, Dorner GT. Influence of diffuse luminance flicker on choroidal and optic nerve head blood flow. Curr Eye Res. 2002;24:109–113. doi: 10.1076/ceyr.24.2.109.8164. [DOI] [PubMed] [Google Scholar]
- 7.Feke GT, Zuckerman R, Green GJ, Weiter JJ. Response of human retinal blood flow to light and dark. Invest Ophthalmol Vis Sci. 1983;24:136–141. [PubMed] [Google Scholar]
- 8.Riva CE, Logean E, Petrig BL, Falsini B. Effect of dark adaptation on retinal blood flow. Klin Monatsb Augenh. 2000;216:309–310. doi: 10.1055/s-2000-10990. [DOI] [PubMed] [Google Scholar]
- 9.Longo A, Geiser M, Riva CE. Subfoveal choroidal blood flow in response to light-dark exposure. Invest Ophthalmol Vis Sci. 2000;41:2678–2683. [PubMed] [Google Scholar]
- 10.Fuchsjager-Mayrl G, Malec M, Amoako-Mensah T, Kolodjaschna J, Schmetterer L. Changes in choroidal blood flow during light/dark transitions are not altered by atropine or propranolol in healthy subjects. Vision Res. 2003;43:2185–2190. doi: 10.1016/s0042-6989(03)00332-8. [DOI] [PubMed] [Google Scholar]
- 11.Hill DW, Houseman J. Retinal blood flow in the cat following periods of light and darkness. Exp Eye Res. 1985;41:219–225. doi: 10.1016/0014-4835(85)90027-2. [DOI] [PubMed] [Google Scholar]
- 12.Wang L, Fortune B, Cull G, McElwain KM, Cioffi GA. Microspheres method for ocular blood flow measurement in rats: size and dose optimization. Exp Eye Res. 2007;84:108–117. doi: 10.1016/j.exer.2006.09.005. [DOI] [PubMed] [Google Scholar]
- 13.Wang L, Grant C, Fortune B, Cioffi GA. Retinal and choroidal vasoreactivity to altered PaCO2 in rat measured with a modified microsphere technique. Exp Eye Res. 2008;86:908–913. doi: 10.1016/j.exer.2008.03.005. [DOI] [PubMed] [Google Scholar]
- 14.Shih YY, Muir ER, Li G, De La Garza BH, Duong TQ. High-resolution 3D MR microangiography of the rat ocular circulation. Radiology. 2012;264:234–241. doi: 10.1148/radiol.12112033. [DOI] [PMC free article] [PubMed] [Google Scholar]
- 15.Shih YY, Li G, Muir ER, De La Garza BH, Kiel JW, Duong TQ. Pharmacological MRI of the choroid and retina: blood flow and BOLD responses during nitroprusside infusion. Magn Reson Med. 2012;68:1273–1278. doi: 10.1002/mrm.24112. [DOI] [PMC free article] [PubMed] [Google Scholar]
- 16.Shih YY, De la Garza BH, Muir ER, Rogers WE, Harrison JM, Kiel JW, et al. Lamina-specific functional MRI of retinal and choroidal responses to visual stimuli. Invest Ophthalmol Vis Sci. 2011;52:5303–5310. doi: 10.1167/iovs.10-6438. [DOI] [PMC free article] [PubMed] [Google Scholar]
- 17.Rogers B, Shih YY, Garza BD, Harrison JM, Roby J, Duong TQ. A low cost color visual stimulator for fMRI. J Neurosci Methods. 2011;204:379–382. doi: 10.1016/j.jneumeth.2011.10.032. [DOI] [PMC free article] [PubMed] [Google Scholar]
- 18.Ames A, 3rd, Li YY, Heher EC, Kimble CR. Energy metabolism of rabbit retina as related to function: high cost of Na+ transport. J Neurosci. 1992;12:840–853. doi: 10.1523/JNEUROSCI.12-03-00840.1992. [DOI] [PMC free article] [PubMed] [Google Scholar]
- 19.Riva CE, Grunwald JE, Petrig BL. Reactivity of the human retinal circulation to darkness: a laser Doppler velocimetry study. Invest Ophthalmol Vis Sci. 1983;24:737–740. [PubMed] [Google Scholar]
- 20.Wang L, Tornquist P, Bill A. Glucose metabolism in pig outer retina in light and darkness. Acta Physiol Scand. 1997;160:75–81. doi: 10.1046/j.1365-201X.1997.00030.x. [DOI] [PubMed] [Google Scholar]
- 21.Wang L, Kondo M, Bill A. Glucose metabolism in cat outer retina: effects of light and hyperoxia. Invest Ophthalmol Vis Sci. 1997;38:48–55. [PubMed] [Google Scholar]
- 22.Cringle SJ, Yu DY, Yu PK, Su EN. Intraretinal oxygen consumption in the rat in vivo. Invest Ophthalmol Vis Sci. 2002;43:1922–1927. [PubMed] [Google Scholar]
- 23.Berkowitz BA, Roberts R, Goebel DJ, Luan H. Noninvasive and simultaneous imaging of layer-specific retinal functional adaptation by manganese-enhanced MRI. Invest Ophthalmol Vis Sci. 2006;47:2668–2674. doi: 10.1167/iovs.05-1588. [DOI] [PubMed] [Google Scholar]
- 24.Morimoto N. Study on choroidal blood flow at dark and light adaptation. 1. Choroidal blood flow at dark adaptation. Nihon Ganka Gakkai Zasshi. 1989;93:790–795. [PubMed] [Google Scholar]
- 25.Fitzgerald M, Gamlin P, Zagvazdin Y, Reiner A. Central neural circuits for the light-mediated reflexive control of choroidal blood fow in the pigeon eye: a laser Doppler study. Visual Neurosc. 1996;13:655–669. doi: 10.1017/s0952523800008555. [DOI] [PubMed] [Google Scholar]
- 26.He Z, Vingrys AJ, Armitage JA, Bui BV. The role of blood pressure in glaucoma. Clin Exp Optometry: J Austr Optometr Assoc. 2011;94:133–149. doi: 10.1111/j.1444-0938.2010.00564.x. [DOI] [PubMed] [Google Scholar]
- 27.Luksch A, Garhöfer G, Imhof A, Polak K, Polska E, Dorner GT, et al. Effect of inhalation of different mixtures of O(2) and CO(2) on retinal blood flow. Br J Ophthalmol. 2002;86:1143–1147. doi: 10.1136/bjo.86.10.1143. [DOI] [PMC free article] [PubMed] [Google Scholar]
- 28.Yu DY, Cringle SJ. Oxygen distribution and consumption within the retina in vascularised and avascular retinas and in animal models of retinal disease. Prog Retin Eye Res. 2001;20:175–208. doi: 10.1016/s1350-9462(00)00027-6. [DOI] [PubMed] [Google Scholar]
- 29.Bill A, Sperber GO. Control of retinal and choroidal blood flow. Eye (Lond) 1990;4:319–325. doi: 10.1038/eye.1990.43. [DOI] [PubMed] [Google Scholar]
- 30.Braun RD, Linsenmeier RA, Goldstick TK. Oxygen consumption in the inner and outer retina of the cat. Invest Ophthalmol Vis Sci. 1995;36:542–554. [PubMed] [Google Scholar]
- 31.Medrano CJ, Fox DA. Oxygen consumption in the rat outer and inner retina: light- and pharmacologically-induced inhibition. Exp Eye Res. 1995;61:273–284. doi: 10.1016/s0014-4835(05)80122-8. [DOI] [PubMed] [Google Scholar]
- 32.Wang L, Tornquist P, Bill A. Glucose metabolism of the inner retina in pigs in darkness and light. Acta Physiol Scand. 1997;160:71–74. doi: 10.1046/j.1365-201X.1997.00131.x. [DOI] [PubMed] [Google Scholar]
- 33.Lau JC, Linsenmeier RA. Oxygen consumption and distribution in the Long-Evans rat retina. Exp Eye Res. 2012;102C:50–58. doi: 10.1016/j.exer.2012.07.004. [DOI] [PMC free article] [PubMed] [Google Scholar]
- 34.Hoshi H, Sato M, Oguri M, Ohtsuka T. In vivo nitric oxide concentration in the vitreous of rat eye. Neurosci Lett. 2003;347:187–190. doi: 10.1016/s0304-3940(03)00717-1. [DOI] [PubMed] [Google Scholar]
- 35.De La Garza BH, Li G, Shih YY, Duong TQ. Layer-specific manganese-enhanced MRI of the retina in light and dark adaptation. Invest Ophthalmol Vis Sci. 2012;53:4352–4358. doi: 10.1167/iovs.11-8826. [DOI] [PMC free article] [PubMed] [Google Scholar]
- 36.Riva CE, Cranstoun SD, Mann RM, Barnes GE. Local choroidal blood flow in the cat by laser Doppler flowmetry. Invest Ophthalmol Vis Sci. 1994;35:608–618. [PubMed] [Google Scholar]
- 37.Shakoor A, Blair NP, Mori M, Shahidi M. Chorioretinal vascular oxygen tension changes in response to light flicker. Invest Ophthalmol Vis Sci. 2006;47:4962–4965. doi: 10.1167/iovs.06-0291. [DOI] [PMC free article] [PubMed] [Google Scholar]
- 38.Hammer M, Vilser W, Riemer T, Liemt F, Jentsch S, Dawczynski J, et al. Retinal venous oxygen saturation increases by flicker light stimulation. Invest Ophthalmol Vis Sci. 2011;52:274–277. doi: 10.1167/iovs.10-5537. [DOI] [PubMed] [Google Scholar]