Abstract
Immature renal function in neonates requires antibiotic dosage adjustment. Population pharmacokinetic studies were performed to determine the optimal dosage regimens for three types of antibiotics: an aminoglycoside, arbekacin; a glycopeptide, vancomycin; and a carbapenem, panipenem. Eighty-three neonates received arbekacin (n = 41), vancomycin (n = 19), or panipenem (n = 23). The postconceptional ages (PCAs) were 24.1 to 48.4 weeks, and the body weights (BWs) ranged from 458 to 5,200 g. A one-compartment open model with first-order elimination was applied and evaluated with a nonlinear mixed-effect model for population pharmacokinetic analysis. In the fitting process, the fixed effects significantly related to clearance (CL) were PCA, postnatal age, gestational age, BW, and serum creatinine level; and the fixed effect significantly related to the volume of distribution (V) was BW. The final formulas for the population pharmacokinetic parameters are as follows: CLarbekacin = 0.0238 × BW/serum creatinine level for PCAs of <33 weeks and CLarbekacin = 0.0367 × BW/serum creatinine level for PCAs of ≥33 weeks, Varbekacin = 0.54 liters/kg, CLvancomycin = 0.0250 × BW/serum creatinine level for PCAs of <34 weeks and CLvancomycin = 0.0323 × BW/serum creatinine level for PCAs of ≥34 weeks, Vvancomycin = 0.66 liters/kg, CLpanipenem = 0.0832 for PCAs of <33 weeks and CLpanipenem = 0.179 × BW for PCAs of ≥33 weeks, and Vpanipenem = 0.53 liters/kg. When the CL of each drug was evaluated by the nonlinear mixed-effect model, we found that the mean CL for subjects with PCAs of <33 to 34 weeks was significantly smaller than those with PCAs of ≥33 to 34 weeks, and CL showed an exponential increase with PCA. Many antibiotics are excreted by glomerular filtration, and maturation of glomerular filtration is the most important factor for estimation of antibiotic clearance. Clinicians should consider PCA, serum creatinine level, BW, and chemical features when determining the initial antibiotic dosing regimen for neonates.
Nosocomial infections are an important cause of morbidity and mortality in neonates (16, 33). Antibiotics are widely used for the treatment of suspected or confirmed neonatal infections due to an immature immune system. As many antibiotics are principally eliminated by renal excretion, the initial doses are normally based on renal function. Although dosage adjustment is necessary for neonates because of their immature renal function, dosage regimens are not well defined for this population because of pharmacokinetic variability and difficulty with blood sampling. Dosage regimens need to be designed for neonates with various levels of maturation for safe dosing. The use of a population pharmacokinetic (PPK) approach with the nonlinear mixed-effect model (NONMEM) program for evaluation of the pharmacokinetics of panipenem according to various indices of maturation was reported previously (27). In the present study, three different types of antibiotics were selected: an aminoglycoside, arbekacin; a glycopeptide, vancomycin; and a carbapenem, panipenem. The PPKs of these antibiotics in neonates of various PCAs were analyzed and compared. Aminoglycosides are the basic compounds with which clearance (CL) is considered since excretion appears to correlate best with the glomerular filtration rate (GFR) (49). The level of excretion of vancomycin is similar to that of the aminoglycosides, but the CL-to-GFR ratio is smaller for vancomycin because of its higher level of protein binding in adults. Carbapenems (19) have a non-renal-related CL that is greater than the GFR (15, 39). Studies with neonates have previously identified correlations between pharmacokinetic parameters and body weight (BW), PCA, gestational age (GA), postnatal age (PNA), and serum creatinine concentration (Cr).
MATERIALS AND METHODS
Patients.
Eighty-three neonates from the neonatal intensive care unit of Kitasato University Hospital, Kanagawa, Japan, who required intensive care and who antibiotic treatment were eligible for inclusion in the study. Informed consent to enter this study was given by the parents. Neonates were enrolled in three groups, which comprised those treated with arbekacin (n = 41), vancomycin (n = 19), and panipenem (n = 23). Table 1 shows the characteristics of the patients. Biochemical data and detailed dosing histories were obtained from computer records or patient case notes, with the following continuous clinical covariates noted: PNA, PCA, GA, and BW.
TABLE 1.
Patient demographic dataa
| Characteristic | Arbekacin | Vancomycin | Panipenem |
|---|---|---|---|
| No. of subjects and sex | 15 females, 26 males | 10 females, 9 males | 13 females, 10 males |
| PCA range (wk) | 24.1-46.3 | 25.1-48.4 | 24.7-42.6 |
| No. of patients of the following PCA (wk)b: | |||
| <26 | 9 | 1 | 3 |
| <30 | 12 | 3 | 8 |
| <34 | 6 | 3 | 4 |
| <38 | 5 | 5 | 3 |
| <42 | 3 | 5 | 3 |
| 42≤ | 6 | 2 | 2 |
| GA range (wk) | 24.1-43.4 | 24.1-41.3 | 24.7-41.4 |
| PNA range (days) | 0-57 | 3-71 | 0-42 |
| BW range (g) | 458-4,455 | 710-5,200 | 530-4,455 |
| Cr range (mg/dL) | 0.2-3.0 | 0.2-0.9 | 0.3-2.0 |
A total of 83 neonates in the neonatal intensive care unit at Kitasato University Hospital were studied.
Number of subjects of each PCA on the first day of therapy.
Dosing and sampling procedures.
The following antibiotics were compared: arbekacin sulfate (Meiji Seika, Tokyo, Japan), vancomycin hydrochloride (Shionogi Pharmaceutical, Osaka, Japan), and panipenem (Sankyo, Tokyo, Japan). Arbekacin was administered at a dose of 2 to 3 mg/kg of body weight every 12 h over 30 min by intravenous infusion (actual dosages, between 2.2 and 4.1 mg/kg/dose; mean dosage, 3.0 mg/kg/dose). Vancomycin was administered at a dose of 15 mg/kg every 12 h (for those with a chronologic age of 1 to 7 days) or 15 mg/kg every 8 h (for those >7 days old) over 60 min by intravenous infusion. Nine patients received two daily doses of vancomycin intravenously, and 10 patients received three doses per day (actual dosages, between 9.0 and 17.9 mg/kg/day; mean dosage, 13.6 mg/kg/dose). Panipenem was administered at a dose of 10 to 20 mg/kg every 12 h over 60 min by intravenous infusion daily (actual dosages, between 10.2 and 34.7 mg/kg/dose; mean dosage, 18.6 mg/kg/dose). The arbekacin and panipenem doses were based on our own guidelines. The initial vancomycin dose was based on the guidelines of the Ministry of Health and Welfare of Japan. All doses were adjusted by the physician and pharmacist responsible for the patient. The mean durations of the arbekacin, vancomycin, and panipenem treatments were 7.5 ± 3.6 days (range, 2 to 19 days), 6.8 ± 2.5 days (range, 3 to 15 days), and 10.7 ± 5.7 days (range, 3 to 28 days), respectively.
Blood samples for retrieval of serum were obtained by capillary heel stick just prior to infusion. Peaks concentrations were measured 30 min or 1 h (2 to 3 h for vancomycin) after the end of infusion, and concentrations for evaluation of the elimination phase were measured 6 h after the end of infusion or just before administration of the next dose by the method of Sawchuk-Zaske (41). In our preliminary studies, trough levels were not detectable in some patients, and therefore, sampling every 6 h was also selected for measurement of the values for the elimination phase. Samples were obtained on days 1, 3, and 6 of the course of antibiotic treatment.
Serum was prepared by centrifugation and stored at −20°C prior to data analysis. Serum arbekacin concentrations were determined by high-performance liquid chromatography with a combination of reverse-phase, ion-pair chromatography, postcolumn derivatization with o-phthalaldehyde, and fluorescence detection, as described by Kubo et al. (28), with the following equipment and settings: detector, S-FL-330 (Soma Optics, Tokyo, Japan); wavelength, 440 nm; and column, Radial-PAK C18 (Nihon Waters, Tokyo, Japan). The lower limit of quantification was 0.3 mg/liter. The coefficient of variation was less than 3.0%. The recovery of arbekacin was 98.5%. Arbekacin was a gift from Meiji Seika. Serum vancomycin concentrations were analyzed by a fluorescence polarization immunoassay with a TDx Vancomycin Dinapack kit (Abbott, Osaka, Japan). The coefficient of variation was less than 3.0%. Serum panipenem concentrations were determined by high-performance liquid chromatography with a Multisolvent Delivery System 600 (Nihon Waters) with the following equipment and settings: detector, UV-970 (Jusco, Tokyo, Japan); wavelength, 300 nm; column, ODS-2 (GL Science, Tokyo, Japan); mobile phase, 35% (vol/vol) methanol in 5 mM sodium phosphate buffer containing 5 mM sodium dodecyl sulfate (pH 5.8); and flow rate, 0.8 ml/min. The lower limit of quantification was 0.5 mg/liter. The coefficient of variation was less than 2.7%. The recovery of panipenem was 98.4%. Panipenem was a gift from Sankyo.
Pharmacokinetic analysis.
The simultaneous analysis of all concentration-time and patient physiologic data was performed by using the NONMEM program with first-order methods (double precision, version V, level 1.0), a computer program developed for PPK analysis on a PCAT computer running under a Windows system (5). The concentration-time courses of each antibiotic were described by use of a one-compartment model (in accordance with the available post-distribution phase data) with a short infusion and first-order elimination. Fixed- and random-effect parameters were estimated by use of the NONMEM program. The basic pharmacokinetic parameters of CL and the volume of distribution (V) corresponding to the proposed model were determined for each patient by using the PREDPP subroutines supplied with ADVAN1/TRANS3 from the NONMEM library. In the first phase of the analysis, a basic model with no covariates on CL or V was used. Additive, proportional, and log-linear error models were compared for determination of the interindividual variability in CL and V and for the residual variability in the drug concentration. Proportional interindividual variability models were invoked for each  as follows:
 |
 |
where CL and V̄ are the population parameters. ηCL and ηV are random variables with a mean of zero and a variance of ω2. CLi and Vi are the individualized estimated parameters.
The additive error model was used for residual variability:
 |
where Cij is the ith measured concentration in serum in individual j, Cij* is the estimated concentration in serum (as determined from the pharmacokinetic data), and ɛij is the independent identically distributed statistical error with a mean of zero and a variance of δ2.
Fixed-effects modeling.
In the fitting process, the following patient demographic and biochemical data were used as covariables in the population model: PCA, GA, PNA, Apgar score, BW, and Cr. Covariates were investigated on the basis of the CL and V values for each antibiotic. The candidate covariate was screened in turn by adding it to the basic model: CL = θ1 + θ2 × covariate and V = θ1 + θ2 × covariate, where θ1 and θ2 are the intercept and slope parameters, respectively. An objective function value (the negative value of twice the log-likelihood difference [−2 l.l.d.]) is produced by the NONMEM program for each model in this regression. Comparisons among the different models were based on the differences in the minimum value of the objective function. Changes in the objective function greater than 6.635 indicate a statistically significant (P < 0.01) improvement in the fit of the data on the basis of a χ2 distribution with 1 degree of freedom. On the basis of these results, all significant factors were used to construct the full regression equation. A stepwise procedure was used to determine the final model. The final model was obtained by removing covariates from the full model. After deletion of each factor in the full model, the objective function value of this reduced model was compared with that of the full model. At that time, a more restrictive criterion was adopted, and −2 l.l.d. of more than 7.8 was required to maintain covariates for the final model (P < 0.005). The final estimates of the PPK parameters were defined. Individual estimates of the CL and V values for each antibiotic were generated by Bayesian feedback with the NONMEM program after the population analysis.
Model validation.
In the present study the bootstrap resampling technique was applied as an internal validation. The distribution of the pharmacokinetic parameters was confirmed by selecting 500 data sets by sampling and replacing data sets as needed. Finally, the mean values for the parameters from the bootstrap replicates were compared with the mean values made with the original data set.
To evaluate the predictive performance of the population parameters, we also obtained individual Bayesian estimates of CL and V of each antibiotic for these patients with the POSTHOC option in the NONMEM software package. The pharmacokinetic parameters derived in this study were evaluated by determination of their distribution against the linear regression of the predicted versus the observed concentrations in serum.
RESULTS
The study plan included the collection of nine samples from each subject over 6 days. The actual number of samples collected was as follows: 114 samples from the 41 neonates receiving arbekacin, 88 samples from the 19 neonates receiving vancomycin, and 108 samples from 23 neonates receiving panipenem. All subjects tolerated the antibiotics well, with no evidence of drug-associated toxicity. All data could be used for the pharmacokinetic evaluation.
The mean CL and V values were as follows: CLarbekacin = 0.107 liters/h, Varbekacin = 0.91 liters, CLvancomycin = 0.105 liters/h, Vvancomycin = 0.91 liters, CLpanipenem = 0.175 liters/h, and Vpanipenem = 0.55 liters. Table 2 summarizes the main covariate models that were tested by use of the NONMEM program. In the fitting process, the NONMEM analysis with single covariates identified PCA, GA, PNA (except with vancomycin), BW, inverted Cr, exponential PCA, the complex factor of BW, and inverted Cr (BW/Cr) as having an influence on CL. The Apgar score was not significantly correlated. The values of −2 l.l.d. for the effects of different PCAs on CL were minimal for PCAs of 33 to 34 weeks. When evaluating each CL, we found that the mean CL for the subjects with PCAs of <33 to 34 weeks was significantly smaller than the mean CL for those with PCAs of ≥33 to 34 weeks, and for all three antibiotics CL showed an exponential increase with PCA. The influence of PCAs of <33 to 34 weeks, 33 to 34 weeks, or >33 to 34 weeks on the CL was chosen for the next analysis step.
TABLE 2.
Hypothesis testing for influence of fixed effects on pharmacokinetic parameters for three types of antibiotics
| Pharmacokinetic parameter and fixed effecta | Effect (−2 l.l.d. [P value])
|
||
|---|---|---|---|
| Arbekacin | Vancomycin | Panipenem | |
| CL | |||
| PCA | 14.49 (0.001) | 5.13 (0.001) | 11.82 (0.001) |
| exp(PCA × θ) | 52.14 (0.001) | 21.60 (0.001) | 42.03 (0.001) |
| GA | 11.93 (0.001) | 19.23 (0.001) | 10.87 (0.001) |
| PNA | 14.03 (0.01) | 1.15 (NSb) | 9.08 (0.01) |
| BW | 54.32 (0.001) | 22.56 (0.001) | 37.49 (0.001) |
| APG-Sc | 3.2 (NS) | 1.80 (NS) | 2.80 (NS) |
| 1/Cr | 63.78 (0.001) | 40.19 (0.001) | 13.98 (0.001) |
| BW/Cr | 101.60 (0.001) | 50.71 (0.001) | 28.45 (0.001) |
| PCAd | 61.64 (0.001) | 21.60 (0.001) | 24.46 (0.001) |
| V | |||
| PCA | 0.79 (NS) | 3.43 (NS) | 6.53 (NS) |
| GA | 2.01 (NS) | 3.44 (NS) | 6.37 (NS) |
| PNA | 0.50 (NS) | 2.43 (NS) | 0.84 (NS) |
| BW | 16.73 (0.001) | 23.06 (0.001) | 26.60 (0.001) |
Three degree of freedom were used to model the effect on CL and V.
NS, not significant.
APG-S, Apgar score.
The values for PCA apply to PCAs of 33 weeks for arbekacin and panipenem and 34 weeks for vancomycin.
BW, inverted Cr, and PCA were selected for the full regression analysis. No significant correlation was found between CL and PCA when PCA and BW were analyzed at the same time. We found that PCA closely correlates with BW. Because CL is a function of PCA, BW, and Cr, the following fixed-effect model was assumed for the pharmacokinetic model: CL = θ1 + θ2 × BW × (1 + θ3/Cr) (PCAs, <33 or 34 weeks), CL = θ4 + θ5 × BW × (1 + θ6/Cr) (PCAs, ≥33 or 34 weeks), and V = θ7+ θ8 × BW, where θ3 to θ8 are the intercept or slope parameters.
Each parameter was eliminated from the full model (Table 3). The final model with PCA, Cr, and BW was examined; and the final regression equations and parameter estimates are shown in Table 4. The final formulas for the PPK parameters were as follows: CLarbekacin = 0.0238 × BW/Cr for PCAs of <33 weeks and CLarbekacin = 0.0367 × BW/Cr for PCAs of ≥33 weeks, Varbekacin = 0.54 liters/kg, CLvancomycin = 0.0250 × BW/Cr for PCAs of <34 weeks and CLvancomycin = 0.0323 × BW/Cr for PCAs of ≥34 weeks, Vvancomycin = 0.66 liters/kg, CLpanipenem = 0.0832 for PCAs of <33 weeks and CLpanipenem = 0.179 × BW for PCAs of ≥33 weeks, and Vpanipenem = 0.53 liters/kg.
TABLE 3.
Hypothesis testing according to intersubject variability by using reduced models of the full model
| CL = θ1 + θ2 × BW × (1 + θ3 × Cr) (PCA ≥ n)
| |||||
|---|---|---|---|---|---|
| CL = θ4 + θ5 × BW × (1 + θ6 × Cr) (PCA < n)
| |||||
| V = θ7 + θ8 × BW
| |||||
| Arbekacin (PCA, n = 33 wk)
|
Vancomycin (PCA, n = 34 wk)
|
Panipenem (PCA, n = 33 wk)
|
|||
| Parameter | P value | Parameter | P value | Parameter | P value |
| θ1 | NSa | θ1 | NS | θ1 | NS |
| θ2 | <0.001 | θ2 | <0.001 | θ2 | <0.001 |
| θ3 | <0.001 | θ3 | <0.001 | θ3 | NS |
| θ4 | NS | θ4 | NS | θ4 | <0.001 |
| θ5 | <0.001 | θ5 | <0.001 | θ5 | NS |
| θ6 | <0.001 | θ6 | <0.001 | θ6 | NS |
| θ7 | NS | θ7 | NS | θ7 | NS |
| θ8 | <0.001 | θ8 | <0.001 | θ8 | <0.001 |
NS, not significant.
TABLE 4.
Final estimates for the population pharmacokinetic parameters for antibiotics in neonates
| Data set and parameter | Arbekacin [CL = θ1 × BW/Cr (PCA, ≥33 wk); CL = θ2 × BW/Cr (PCA, <33 wk); V = θ3 × BW] | Vancomycin [CL = θ1 × BW/Cr (PCA, ≥34 wk); CL = θ2 × BW/Cr (PCA, <34 wk); V = θ3 × BW] | Panipenem [CL = θ1 × BW (PCA, ≥33 wk); CL = θ2 (PCA, <33 wk); V = θ3 × BW] |
|---|---|---|---|
| Original data set | |||
| Mean | |||
| θ1 | 0.0367 | 0.0323 | 0.0832 |
| θ2 | 0.0238 | 0.025 | 0.179 |
| θ3 | 0.54 | 0.66 | 0.53 |
| Variability (%) | |||
| ωCL (%) | 35.5 | 22.9 | 23.9 |
| ωV (%) | 42.5 | 20.8 | 28.5 |
| ɛ (mg/liter) | 2.43 | 3.22 | 4.20 |
| 500 bootstrap replication | |||
| Mean | |||
| θ1 | 0.0378 | 0.0344 | 0.0846 |
| θ2 | 0.0218 | 0.025 | 0.177 |
| θ3 | 0.51 | 0.61 | 0.54 |
| Variability | |||
| ωCL (%) | 36.2 | 25.8 | 24.5 |
| ωV (%) | 43.4 | 22.3 | 30.1 |
| ɛ (mg/liter) | 3.41 | 3.38 | 4.40 |
The interindividual coefficients of variation for CL and V were as follows: CLarbekacin, 35.5%; Varbekacin, 42.5%; CLvancomycin, 22.9%; Vvancomycin, 20.8%; CLpanipenem, 23.9%; Vpanipenem, 28.5%.
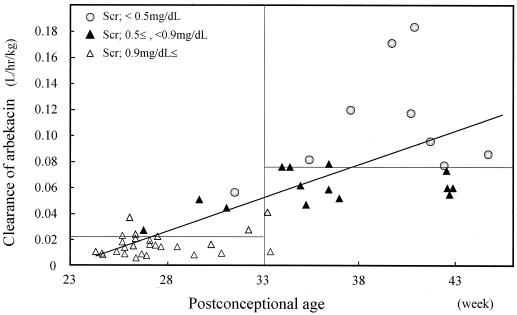
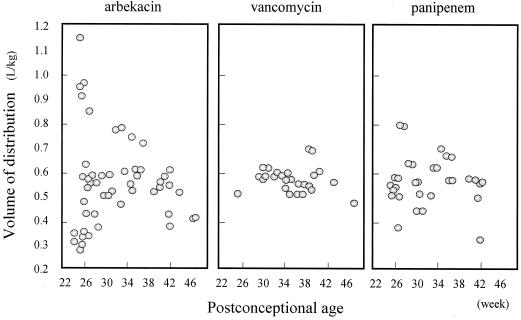
The standard deviations in intraindividual variability were determined to be 2.43, 3.22, and 4.2 mg/liter for arebkacin, vancomycin, and panipenem, respectively. The highly significant relationships between pharmacokinetic parameters and physiologic factors are presented in Fig. 1 to 4. These parameters were estimated by Bayesian feedback with the NONMEM program.
FIG. 1.
Relationship between CLarbekacin normalized by weight and PCA. CLarbekacin was estimated by the Bayesian method. The horizontal lines show the average CLarbekacin for neonates with PCAs of <33 and ≥33 weeks. CLarbekacin was normalized by weight but depends on PCA and Cr (Scr).
FIG. 4.
Scatterplot of Varbekacin, Vvancomycin, and Vpanipenem versus PCA. Each value of V was estimated by the Bayesian method. There was no significant relationship between V and time.
The results of the 500 bootstrap procedure are shown in Table 4. The mean values from the bootstrap procedure were similar to the parameter estimates from the original data set, indicating that the model that was developed is stable.
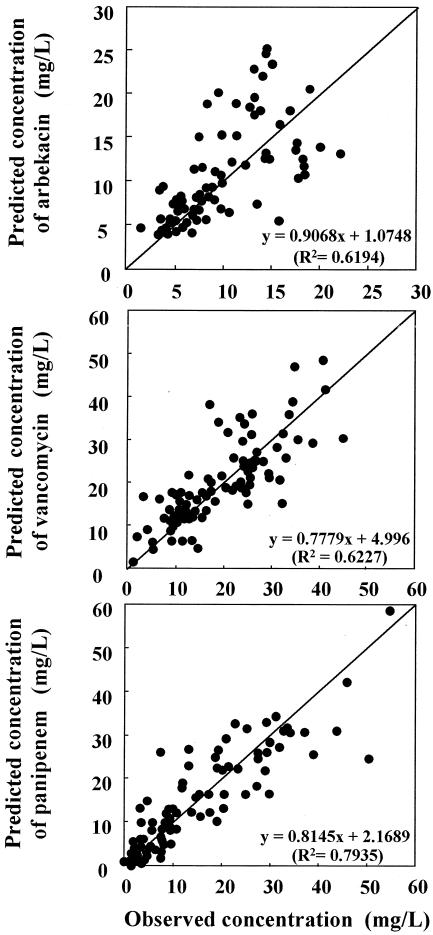
Figure 5 shows a scatterplot of the observed concentrations and the estimated concentrations. The mean values for the population analyzed showed a good predictive performance. The distribution of the plot against the line for the formula for CL displays a bilateral symmetry around the regression, so the observed population mean was assumed to be an unprejudiced parameter.
FIG. 5.
Scatterplot of observed concentrations versus estimated concentrations of three kinds of antibiotics. Estimated concentrations were calculated by using our population model, according to the covariate results for each individual from NONMEM analysis.
DISCUSSION
PPK analysis is very useful in situations in which the data are sparse and when ethical and logistical issues must be taken into account when neonates of various levels of maturation are studied (20, 48). The PPK study described here was conducted to determine adequate treatments with three typical antibiotics by characterization of the pharmacokinetics of the antibiotics in neonates. Although two-compartment models are used for many antibiotics with short infusions, a one-compartment model analysis was adopted in this study. The two-compartment model is not important for clinical dosage regimens, as shown by the method of Sawchuk-Zaske (41), for neonates, for whom minimization of blood loss is critical.
In the present study, PCA, GA, PNA, Cr, and BW were important factors that correlated with individual estimates of CL (Table 2); but the correlation for PNA was not clearly significant. Many investigators have reported a high correlation between GA and antibiotic CL (7, 8, 23, 45, 46). Clinically, renal function is the most important factor for elimination because many antibiotics are completely excreted in urine. Many studies have evaluated the changes in renal function during development in neonates according to their GAs. Although PNA must be considered along with GA to evaluate renal function correctly, it is difficult to identify the significant covariate in the process of determining population parameters (17). The use of a large number of patients of the same GA with various PNAs is necessary for analysis of a small population. For this reason, the use of PCA is an obvious choice for the evaluation of renal function in neonates. Our results showed that the mean CL of antibiotics in patients with PCAs of <33 to 34 weeks was significantly lower than that in patients with PCAs of ≥33 to 34 weeks, and CL showed a logarithmic rise with PCA. Many investigators (2, 3, 18, 29) have reported that changes in the development of the renal function in neonates are correlated with PCA and that renal function increases after 34 to 35 weeks. These associations suggest that antibiotic CL steeply increases in neonates with PCAs of 33 to 36 weeks.
If patients with a wider range of renal function had been available, it is likely that creatinine CL would have been a significant predictor of CL for antibiotics excreted mainly by glomerular filtration. Schwartz et al. (42) estimate GFR (in millimeters per minute per 1.73 m2) as follows: GFR = k · HT/Cr, where HT is the height (in centimeters) and k is a constant proportional to HT/Cr. Although HT or body surface area might be more accurate for estimation of GFR, many dosages have previously been normalized per kilogram of BW. After the inclusion of Cr and BW in the regression model, BW/Cr was a powerful predictor of the CL of each antibiotic in the early stages of the model-building process, but for panipenem it was not significant in the final model.
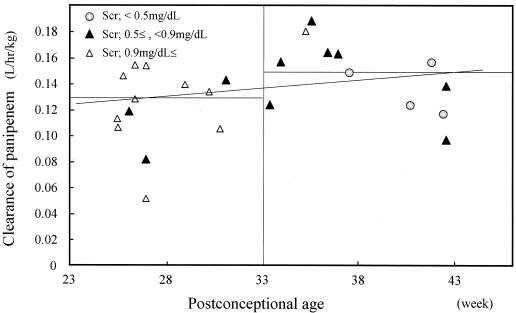
In this study, significant covariates related to CLpanipenem were found, and it was confirmed that CLpanipenem does not depend on the maturation process. Panipenem and other carbapenems are metabolized by the enzyme dehydropeptidase-1 and are very unstable in solution (34). The renal function of low-birth-weight babies is extremely low; therefore, CL by extrarenal pathways is relatively greater than that by the renal pathway according to the level of maturation of the neonate. Our results indicate that CLpanipenem (0.179 liter/h) was almost identical to GFR in full-term babies (0.144 liter/h; GA, 38 to 41 weeks) (24), and similar CLs were observed for other carbapenems, such as meropenem (0.157 liter/h/kg) (46) and impenem (0.150 liter/h/kg) (39).
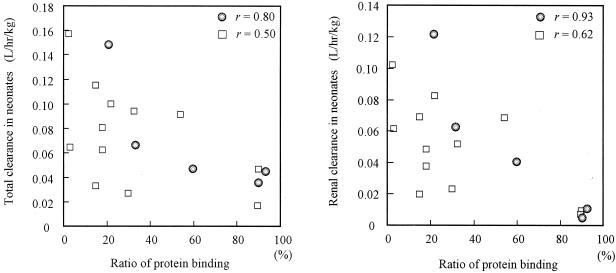
The renal CL of antibiotics is affected by glomerular filtration, tubular secretion, and tubular reabsorption (35). Antibiotics with high degrees of binding to serum proteins show a markedly lower renal CL (6). We reviewed 14 reports in the literature about the relationship between plasma protein binding and renal CL for seven antibiotics in neonates, and the results are shown in Fig. 6. With some exceptions, protein binding ratios provide good theoretical values of renal CL (renal CL = fu × GFR) in neonates (fu is the unbound fraction of antibiotic). A similar result was shown in the present study. Because of the high degree of interpatient variability, very small CL, and low body protein levels, CLvancomycin and CLarbekacin were similar in neonates with PCAs of less than 33 weeks. However, in the group with PCAs of >33 weeks, CLvancomycin was lower than CLarbekacin. The levels of protein binding of vancomycin and arbekacin are less than 10 to 82% (1) and less than 15% (31), respectively.
FIG. 6.
Correlation between total and renal CL of antibiotics with protein binding ratios reported in the literature. Fourteen antibiotics were reviewed in 16 studies. The values of antibiotic CL from the literature were divided into two groups: circles indicate PCA of ≥33 weeks or BW of ≥2,000 g for amikacin (36), amoxicillin (11, 23), aztreonam (13), cefoperazone (38), cefotaxime (21), ceftazidime (40, 44), ceftizoxime (26), ceftriaxone (32), meropenem (46), and piperacillin (25); squares indicate PCA of <33 weeks or BW of <2,000 for cefoperazone (8), flucloxacillin (10), piperacillin (25), ticarcillin (11), and vancomycin (12). The figure shows that CL is associated with protein binding ratios and that the relationship between renal CL and protein binding is stronger than that between total CL and protein binding.
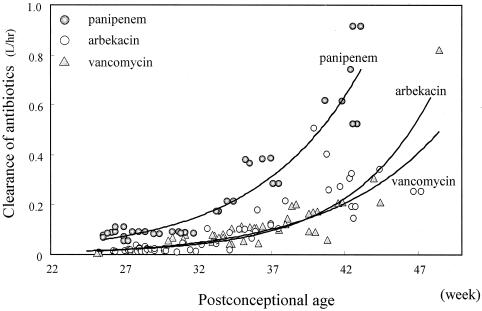
CL is the most important factor in determining the daily dose of antibiotics, and the comparative CLs obtained by PPK analysis (Fig. 7) define the correct dosage regimen for neonates. The dosage regimen is based on consideration of (i) PCAs of 33 to 36 weeks, (ii) BW and inverted Cr, (iii) chemical stability (extrarenal CL), and (iv) protein binding.
FIG. 7.
Correlation between PCA and CL of arbekacin, vancomycin, and panipenem. Antibiotic CL was estimated by the Bayesian method.
In the present study, NONMEM analysis showed that V of the antibiotics was best described by using BW, but the time-dependent differences in water balance, such as those according to PNA, were unexpected. It is known that in neonates V of hydrophilic antibiotics is affected by total body water content and extracellular fluid volume (35). The extracellular fluid volume is large in neonates, especially those with low birth weights, and it decreases postnatally (43). Some of the limitations of PPK studies with neonates are the sparse data on the concentration in serum; the small sample size; and the considerable variability among neonates in terms of fluid intake, serum sodium concentrations, urine output, and the occurrence of diarrhea and fever.
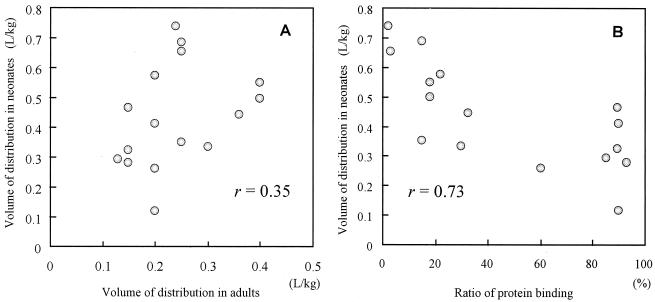
In our study the mean Vvancomycin for the neonates was smaller than that for adults, and conversely, the mean Varbekacin and Vpanipenem for the neonates were larger than those for adults. Those findings confirm the findings of other investigators with the same group of antibiotics (4, 17, 27, 49). We suggest that the discrepancy may be due to estimation of the distribution property in adults. Although some antibiotics are extensively bound to tissue and plasma proteins and have very large V in adults, many antibiotics show small apparent V (0.1 to 0.3 liters/kg) due to high levels of aqueous solubility. Antibiotic diffusion from blood to extracellular fluid depends on many factors, such as tissue binding, free drug concentration (plasma protein binding), pKa, molecular weight, and lipid solubility (37, 47). Plasma protein binding may interfere with the extravascular distribution (9). The distribution profiles of 12 antibiotics with a wide range of protein binding values in neonates and the relationship between V in neonates and V in adults are reviewed and presented in Fig. 8. V in neonates is difficult to estimate from values for adults (Fig. 8), but it depends on the level of protein binding and the amount of extracellular fluid. While protein binding is an important factor for estimation of pharmacokinetics parameters, we need to consider the significant differences between neonates and adults. In our study Varbekacin and Vpanipenem were double those for adults because of low plasma protein binding levels. Because Vvancomycin is large (more than 0.6 liters/kg) in adults, the drug is likely extensively distributed in tissue, in addition to extracellular fluid. The apparent Vvancomycin in neonates tends to be small compared to that in adults, even though the antibiotic is hydrophilic; the reason may be that increased BW is the result of increased extracellular fluid levels in neonates and, thus, Vvancomycin is relatively small because vancomycin does not distribute to extracellular fluid. These data on hydrophilic antibiotics assume that the value of V in neonates, which is less than 0.4 liters/kg in adults, depends on the protein binding ratio. For antibiotics for which the values of V are >0.6 liters/kg in adults, the values of V are smaller in neonates.
FIG. 8.
(A) Correlation between apparent V for antibiotics in adults and neonates reported in the literature. Apparent V for amikacin (36), amoxicillin (11, 23), cefazolin (14), cefoperazone (8, 38), cefotaxime (21), ceftazidime (40, 44), ceftizoxime (26), ceftriaxone (30, 32), flucloxacillin (22), meropenem (46), piperacillin (25), and ticarcillin (10) are low (less than 0.4 liters/kg) in adults due to aqueous solubility. (B) Correlation between protein binding ratio and V. The apparent V was strongly associated with the protein binding ratio. As the protein binding ratio increases in serum (fu decreases), the apparent V is decreased.
In conclusion, the comparative PPK analysis described here identified important covariates for determination of initial drug dosing in neonates: PCA, Cr, and BW. Chemical features such as chemical stability and protein binding should also be considered for determination of the correct dosage regimens for neonates.
FIG. 2.
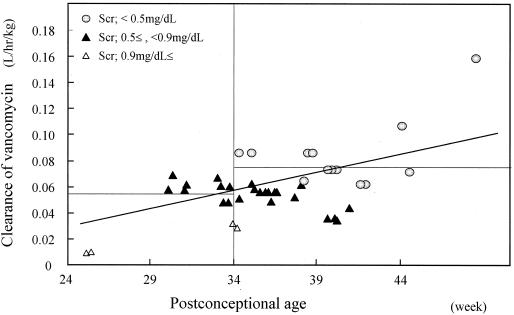
Relationship between CLvancomycin normalized by weight and PCA. CLvancomycin was estimated by the Bayesian method. The horizontal lines shows the average CLvancomycin for neonates with PCAs of <34 and ≥34 weeks. CLvancomycin normalized by weight still depends on PCA and Cr (Scr).
FIG. 3.
Relationship between CLpanipenem and PCA. CLpanipenem for neonates with PCAs of <33 weeks was not dependent on maturation but was constant for extrarenal CL; CLpanipenem for neonates with PCAs of ≥34 weeks increased by PCA.
Acknowledgments
We thank Masato Nonoyama and the medical and nursing staff of the Neonatal Intensive Care Unit, Kitasato University, for kind cooperation.
REFERENCES
- 1.Albrecht, L. M., M. J. Rybak, L. H. Warbasse, and D. J. Edwards. 1991. Vancomycin protein binding in patients with infections caused by Staphylococcus aureus. DICP = Ann. Pharmacother. 25:713-715. [DOI] [PubMed] [Google Scholar]
- 2.Al-Dahhan, J., G. B. Haycock, C. Chantler, and L. Stimmler. 1983. Sodium homeostasis in term and preterm neonates. I. Renal aspects. Arch. Dis. Child. 58:335-342. [DOI] [PMC free article] [PubMed] [Google Scholar]
- 3.Arant, B. S., Jr. 1978. Developmental patterns of renal functional maturation compared in the human neonate. J. Pediatr. 92:705-712. [DOI] [PubMed] [Google Scholar]
- 4.Asbury, W. H., E. H. Darsey, W. B. Rose, J. E. Murphy, D. E. Buffington, and C. C. Capers. 1993. Vancomycin pharmacokinetics in neonates and infants: a retrospective evaluation. Ann. Pharmacother. 27:490-496. [DOI] [PubMed] [Google Scholar]
- 5.Beal, S. L., A. Beckman, and L. B. Sheiner. 1992. NONMEM users guides, version IV. NONMEM Projects Group, University of California, San Francisco.
- 6.Bernareggi, A., M. Borgonovi, A. Del Favero, R. Rosina, and L. Gavanaghi. 1991. Teicoplanin binding in plasma following administration of increasing intravenous doses to healthy volunteers. Eur. J. Drug Metab. Pharmacokinet. 3:256-260. [PubMed] [Google Scholar]
- 7.Bleyzac, N., V. Varnier, J. M. Labaune, S. Corvaisier, P. Maire, R. W. Jelliffe, G. Putet, and G. Aulagner. 2001. Population pharmacokinetics of amikacin at birth and interindividual variability in renal maturation. Eur. J. Clin. Pharmacol. 57:499-504. [DOI] [PubMed] [Google Scholar]
- 8.Bosso, J. A., G. M. Chan, and J. M. Matsen. 1983. Cefoperazone pharmacokinetics in preterm infants. Antimicrob. Agents Chemother. 23:413-415. [DOI] [PMC free article] [PubMed] [Google Scholar]
- 9.Brion, N., A. Contrepois, and C. Carbon. 1983. From serum pharmacokinetics to extravascular pharmacokinetics of antibiotics. Importance of protein binding. Presse Med. 12:293-296. [PubMed] [Google Scholar]
- 10.Burstein, A. H., L. E. Wyble, P. Gal, P. R. Diaz, J. L. Ransom, R. Q. Carlos, and A. Forrest. 1994. Ticarcillin-clavulanic acid pharmacokinetics in preterm neonates with presumed sepsis. Antimicrob. Agents Chemother. 38:2024-2028. [DOI] [PMC free article] [PubMed] [Google Scholar]
- 11.Capparelli, E. V., J. R. Lane, G. L. Romanowski, E. J. McFeely, W. Murray, P. Sousa, C. Kildoo, and J. D. Connor. 2001. The influences of renal function and maturation on vancomycin elimination in newborns and infants. J. Clin. Pharmacol. 41:927-934. [DOI] [PubMed] [Google Scholar]
- 12.Charles, B. G., Y. Preechagoon, T. C. Lee, P. A. Steer, V. J. Flenady, and N. Debuse. 1997. Population pharmacokinetics of intravenous amoxicillin in very low birth weight infants. J. Pharm. Sci. 86:1288-1292. [DOI] [PubMed] [Google Scholar]
- 13.Cuzzolin, L., V. Fanos, D. Zambreri, E. M. Padovani, and G. Benoni. 1991. Pharmacokinetics and renal tolerance of aztreonam in premature infants. Antimicrob. Agents Chemother. 35:1726-1728. [DOI] [PMC free article] [PubMed] [Google Scholar]
- 14.Deguchi, Y., R. Koshida, E. Nakashima, R. Watanabe, N. Taniguchi, F. Ichimura, and A. Tsuji. 1988. Interindividual changes in volume of distribution of cefazolin in newborn infants and its prediction based on physiological pharmacokinetic concepts. J. Pharm. Sci. 77:674-678. [DOI] [PubMed] [Google Scholar]
- 15.Drusano, G. L., and M. Hutchison. 1995. The pharmacokinetics of meropenem. Scand. J. Infect. Dis. 96:11-16. [PubMed] [Google Scholar]
- 16.Eicher, D. J., and D. J. Annibale. 2002. Neonatal sepsis: evaluation and management. J. S. C. Med. Assoc. 98:106-112. [PubMed] [Google Scholar]
- 17.Falcao, A. C., D. S. Buelga, M. E. Mendez, M. J. Garcia, and M. Pardo. 2001. Population kinetics of tobramycin in neonates. Ther. Drug Monit. 23:202-208. [DOI] [PubMed] [Google Scholar]
- 18.Fawer, C. L., A. Torrado, and J. P. Guignard. 1979. Maturation of renal function in full-term and premature neonates. Helv. Paediatr. Acta 34:11-21. [PubMed] [Google Scholar]
- 19.Garcia-Capdevila, L., C. Lopez-Calull, C. Arroyo, M. A. Moral, M. A. Mangues, and J. Bonal. 1997. Determination of imipenem in plasma by high-performance liquid chromatography for pharmacokinetic studies in patients. J. Chromatogr. B Biomed. Sci. Appl. 692:127-132. [DOI] [PubMed] [Google Scholar]
- 20.Gilman, J. T., and P. Gal. 1992. Pharmacokinetic and pharmacodynamic data collection in children and neonates. A quiet frontier. Clin. Pharmacokinet. 23:1-9. [DOI] [PubMed] [Google Scholar]
- 21.Gouyon, J. B., A. Pechinot, C. Safran, P. Chretien, D. Sandre, and A. Kazmierczak. 1990. Pharmacokinetics of cefotaxime in preterm infants. Dev. Pharmacol. Ther. 14:29-34. [PubMed] [Google Scholar]
- 22.Herngren, L., M. Ehrnebo, and U. Broberger. 1987. Pharmacokinetics of free and total flucloxacillin in newborn infants. Eur. J. Clin. Pharmacol. 32:403-409. [DOI] [PubMed] [Google Scholar]
- 23.Huisman-de Boer, J. J., J. N. van den Anker, M. Vogel, W. H. Goessens, R. C. Schoemaker, and R. de Groot. 1995. Amoxicillin pharmacokinetics in preterm infants with gestational ages of less than 32 weeks. Antimicrob. Agents Chemother. 39:431-434. [DOI] [PMC free article] [PubMed] [Google Scholar]
- 24.Jasso-Gutierrez, L., H. Villasenor-Acosta, O. Falcon, and E. Diaz del Castillo. 1976. Glomerular filtration rate in newborn infants. Arch. Investig. Med. 7:91-96. [PubMed] [Google Scholar]
- 25.Kacet, N., M. Roussel-Delvallez, C. Gremillet, J. P. Dubos, L. Storme, and P. Lequien. 1992. Pharmacokinetic study of piperacillin in newborns relating to gestational and postnatal age. Pediatr. Infect. Dis. J. 11:365-369. [DOI] [PubMed] [Google Scholar]
- 26.Karna, P., C. Lee, A. Kumar, J. Dyke, and W. M. Gooch III. 1993. Population pharmacokinetics of ceftizoxime in premature newborns. Dev. Pharmacol. Ther. 20:135-143. [DOI] [PubMed] [Google Scholar]
- 27.Kimura, T., H. Kokubun, M. Nowatari, N. Matsuura, K. Sunakawa, and H. Kubo. 2001. Population pharmacokinetics of panipenem in neonates and retrospective evaluation of dosage. J. Antimicrob. Chemother. 47:51-59. [DOI] [PubMed] [Google Scholar]
- 28.Kubo, H., Y. Kobayashi, and T. Nishikawa. 1985. Rapid method for determination of kanamycin and dibekacin in serum by use of high-pressure liquid chromatography. Antimicrob. Agents Chemother. 28:521-523. [DOI] [PMC free article] [PubMed] [Google Scholar]
- 29.Malcolm, G. C. 1985. Maturation of glomerular filtration in preterm and mature babies. Early Hum. Dev. 11:281-292. [DOI] [PubMed] [Google Scholar]
- 30.Martin, E., J. R. Koup, U. Paravicini, and K. Stoeckel. 1984. Pharmacokinetics of ceftriaxone in neonates and infants with meningitis. J. Pediatr. 105:475-481. [DOI] [PubMed] [Google Scholar]
- 31.Mitomi, N., T. Matsumoto, M. Fujigaki, I. Komiya, and F. Kai. 1987. Absorption, distribution, and excretion of arbekacin after intravenous and intramuscular administration in rats. Jpn. J. Antibiot. 40:357-364. [PubMed] [Google Scholar]
- 32.Mulhall, A., J. de Louvois, and J. James. 1985. Pharmacokinetics and safety of ceftriaxone in the neonate. Eur. J. Pediatr. 144:379-382. [DOI] [PubMed] [Google Scholar]
- 33.Mullaney, D. W. 2001. Group B streptococcal infections in newborns. J. Obstet. Gynecol. Neonatal Nurs. 30:649-658. [DOI] [PubMed] [Google Scholar]
- 34.Naganuma, H., H. Tokiwa, Y. Hirouchi, Y. Kawahara, J. Fukushige, and M. Fukami. 1991. Nephroprotective effect and its mechanism of betamipron. 1. Relationships of renal transport. Nippon Kagaku Ryoho Gakkai Zasshi 39:166-177. [Google Scholar]
- 35.Paap, C. M., and M. C. Nahata. 1990. Clinical pharmacokinetics of antibacterial drugs in neonates. Clin. Pharmacokinet. 19:280-318. [DOI] [PubMed] [Google Scholar]
- 36.Padovani, E. M., C. Pistolesi, V. Fanos, A. Messori, and N. Martini. 1993. Pharmacokinetics of amikacin in neonates. Dev. Pharmacol. Ther. 20:167-173. [DOI] [PubMed] [Google Scholar]
- 37.Peterson, L. R., and D. N. Gerding. 1980. Influence of protein binding of antibiotics on serum pharmacokinetics and extravascular penetration: clinically useful concepts. Rev. Infect. Dis. 2:340-348. [DOI] [PubMed] [Google Scholar]
- 38.Philips, J. B., III, K. Braune, W. Ravis, G. Cassady, and H. Dillon. 1984. Pharmacokinetics of cefoperazone in newborn infants. Pediatr. Pharmacol. 4:193-197. [PubMed] [Google Scholar]
- 39.Reed, M. D., R. M. Kliegman, T. S. Yamashita, C. M. Myers, and J. L. Blumer. 1990. Clinical pharmacology of imipenem and cilastatin in premature infants during the first week of life. Antimicrob. Agents Chemother. 34:1172-1177. [DOI] [PMC free article] [PubMed] [Google Scholar]
- 40.Rule, R., N. J. Martiarena, M. Rubio, and A. Magadan. 1993. Pharmacokinetics of ceftazidime in newborn infants. Medicina 53:207-210. [PubMed] [Google Scholar]
- 41.Sawchuk, R. J., and D. E. Zaske. 1976. Pharmacokinetics of dosing regimens which use multiple intravenous infusions: gentamicin in burn patients. J. Pharmacokinet. Biopharm. 4:183-195. [DOI] [PubMed] [Google Scholar]
- 42.Schwartz, G. J., L. P. Brion, and A. Spitzer. 1987. The use of plasma creatinine concentration for estimating glomerular filtration rate in infants, children, and adolescents. Pediatr. Clin. N. Am. 34:571-590. [DOI] [PubMed] [Google Scholar]
- 43.Shaffer, S. G., S. K. Bradt, V. M. Meade, and R. T. Hall. 1987. Extracellular fluid volume changes in very low birth weight infants during first 2 postnatal months. J. Pediatr. 111:124-128. [DOI] [PubMed] [Google Scholar]
- 44.van den Anker, J. N., R. C. Schoemaker, W. C. Hop, B. J. van der Heijden, A. Weber, P. J. Sauer, H. J. Neijens, and R. de Groot. 1995. Ceftazidime pharmacokinetics in preterm infants: effects of renal function and gestational age. Clin. Pharmacol. Ther. 58:650-659. [DOI] [PubMed] [Google Scholar]
- 45.van den Anker, J. N., W. C. Hop, R. C. Schoemaker, B. J. van der Heijden, H. J. Neijens, and R. de Groot. 1995. Ceftazidime pharmacokinetics in preterm infants: effect of postnatal age and postnatal exposure to indomethacin. Br. J. Clin. Pharmacol. 40:439-443. [PMC free article] [PubMed] [Google Scholar]
- 46.van Enk, J. G., D. J. Touw, and H. N. Lafeber. 2001. Pharmacokinetics of meropenem in preterm neonates. Ther. Drug Monit. 23:198-201. [DOI] [PubMed] [Google Scholar]
- 47.Vicente, M. V., T. Olay, M. C. Quecedo, and A. Rodriguez. 1979. Diffusion of beta-lactam antibiotics and fosfomycin to interstitial tissue fluid in rabbits. Chemotherapy (Basel) 25:329-335. [DOI] [PubMed] [Google Scholar]
- 48.Whiting, B., A. W. Kelman, and J. Grevel. 1986. Population pharmacokinetics. Theory and clinical application. Clin. Pharmacokinet. 11:387-401. [DOI] [PubMed] [Google Scholar]
- 49.Winter, M. E. 1991. Basic clinical pharmacokinetics. Applied Therapeutics Inc., Vancouver, Wash.


