

Abstract
Background
This report presents iodine data from National Health and Nutrition Examination Survey (NHANES) and from a sample of pregnant women in the National Children's Study (NCS) Vanguard Study.
Methods
Urinary iodine (UI) was measured in a one third subsample of NHANES 2005–2006 and 2009–2010 participants and in all 2007–2008 participants age 6 years and older. These measurements are representative of the general U.S. population. UI was also measured in a convenience sample of 501 pregnant women enrolled in the NCS initial Vanguard Study from seven study sites across the United States.
Results
NHANES median UI concentration in 2009–2010 (144 μg/L) was significantly lower than in 2007–2008 (164 μg/L). Non-Hispanic blacks had the lowest UI concentrations (131 μg/L) compared with non-Hispanic whites or Hispanics (147 and 148 μg/L, respectively). The median for all pregnant women in NHANES 2005–2010 was less than adequate (129 μg/L), while third trimester women had UI concentrations that were adequate (median UI 172 μg/L). Third trimester women participating in the NCS similarly had an adequate level of iodine intake, with a median UI concentration of 167 μg/L. Furthermore, NCS median UI concentrations varied by geographic location.
Conclusions
Dairy, but not salt, seafood, or grain consumption, was significantly positively associated with median UI concentration in women of childbearing age. Pregnant women in their third trimester in the NHANES 2005–2010 had adequate median UI concentrations, but pregnant women in NHANES who were in their first or second trimesters had median UI concentrations that were less than adequate. Non-Hispanic black pregnant women from both the NHANES 2005–20010 and the NCS consistently had lower UI median concentrations than non-Hispanic whites or Hispanics.
Introduction
Adequate dietary iodine intake is essential to the synthesis of thyroid hormone, which is key for normal growth, development, and metabolism throughout life. Recent data show that 1.88 billion people globally, including 241 million school children, have insufficient dietary iodine intake (1). Iodine deficiency disorders include a range of health consequences or abnormalities of the body resulting from a prolonged lack or insufficient intake of iodine, ranging from simple goiter to cretinism, which is a condition of severely stunted physical and mental growth (1,2). Adequate iodine intake during pregnancy and lactation is especially critical to normal brain development in the fetus (3). While diet-induced hypothyroidism can occur at any stage of life, the most devastating consequences of iodine deficiency occur during fetal development and early childhood, and include miscarriage, stillbirth, congenital abnormalities, and severe and irreversible mental retardation. Iodine deficiency is the leading and most preventable cause of mental retardation in the world (4). The consequence of severe iodine deficiency is a 10%–15% reduction in IQ for a population (4).
Strategies to combat the prevalence of iodine deficiency disorders focus on ensuring adequate dietary intake. Dairy, grain, seafood, and to a lesser degree, iodized salt are the major sources of iodine in the United States (5). However, there is a wide variation in iodine content in foods and iodine content is rarely included in nutritional labeling (5). In the United States approximately 60% of iodine consumed comes from dairy products. The iodine is added to dairy products as a consequence of iodine added to cattle feed (6), or use of iodophor disinfectants in the milking process (7,8). Iodized salt accounts for a small amount of dietary iodine. Approximately 70% of salt consumed in the United States comes from processed and restaurant foods which generally do not use iodized salt (9).
The Institute of Medicine has set the recommended dietary allowance (RDA) for iodine in adult men and women at 150 μg per day (10). One teaspoon of iodized table salt contains approximately 400 μg of iodine. To support fetal and infant thyroid function, the Institute of Medicine suggests an RDA for pregnant women of 220 μg iodine per day and 290 μg iodine per day during breastfeeding (10). To prevent iodine deficiency, the American Thyroid Association recommends supplementation containing 150 μg of iodine daily for U.S. women of childbearing age during the preconception phase, as well as during pregnancy and lactation (11). In addition, adequate iodine intake before conception (RDA of 150 μg per day) is important to ensure adequate maternal iodine stores to support the fetus. Preconception iodine status of the mother influences the degree of successful maturation of the fetal central nervous system and subsequent neurodevelopment of the child (12).
There are no analytical techniques available to directly measure an individual's daily iodine status. Urinary iodine (UI) reflects iodine intake within the past few days. As a clinical biomarker, UI generally is not useful to classify intake sufficiency or deficiency in a person, but rather to define the risk of a population. UI measurement in 24-hour urine collection is preferred, but iodine excretion can be expressed per gram of creatinine in spot urine collections in population groups with very low inter- and intra-individual variation in urinary creatinine (13). The World Health Organization (WHO) defines nutritional iodine sufficiency for a population by UI concentrations as follows: excessive iodine intake, >300 μg/L; more than adequate intake, 200–299 μg/L; adequate intake, 100–199 μg/L; mild iodine deficiency, 50–99 μg/L; moderate iodine deficiency, 20–49 μg/L; and severe iodine deficiency <20 μg/L. The WHO recently defined adequate iodine intake for pregnant women as an iodine excretion of 150–249 μg/L and inadequate iodine intake as represented by iodine excretion <150 μg/L (13).
Given the significant numbers at risk for iodine insufficiency among select population subgroups in the United States, population-wide monitoring to document UI levels is a necessary public health activity. Recent U.S. population data from the National Health and Nutrition Examination Survey (NHANES) have shown that women and some subpopulations of non-Hispanic blacks tend to have UI concentrations indicating mild iodine deficiency (14). The National Children's Study (NCS) initial Vanguard Study was launched during the same time frame as the 2009–2010 NHANES. The NCS Vanguard Study was intended to provide operational data to inform decisions regarding processes and measures for inclusion in the Main Study. The Centers for Disease Control and Prevention (CDC) used samples collected during the Vanguard Study to conduct a pilot study. The purpose of the CDC pilot study was to measure a number of environmental chemicals and nutritional biomarkers in the NCS convenience sample of pregnant women from seven study locations throughout the United States. As part of the CDC pilot study, UI was measured in Vanguard Study participants who were in their third trimester of pregnancy. These data help provide a more complete picture of UI status of U.S. pregnant women and enhance the data provided by the NHANES. Our paper will focus on iodine status in the U.S. population as measured by the most recent NHANES 2009–2010 cycle and pregnant women from NHANES 2005–2010 as well as the UI levels for pregnant women who participated in the NCS Vanguard pilot study.
UI has been measured in NHANES since 1971. In recent years, UI has shown a decrease. In all instances in which the data are stratified by race/ethnicity, the non-Hispanic black population has had the lowest UI relative to other racial/ethnic groups. Despite oversampling of pregnant women in NHANES 2001–2006, the number of pregnant women participating in the survey was still quite small. The CDC collaboration with the NCS provided an opportunity to measure UI in a large number of third trimester pregnant women as part of a pilot study to evaluate the clinical biospecimen collection protocols used in the 2009–2010 Vanguard Study. The Division of Laboratory Sciences, National Center for Environmental Health measured UI concentrations and other environmental and nutritional analytes in samples collected from participants enrolled at any of the seven original Vanguard study sites. In this study, results of UI measured in the NCS sample of pregnant women provides additional data on a group at risk for inadequate iodine intake and will be compared with results from a representative sample of U.S. pregnant women from NHANES.
Data and Methods
NHANES design
NHANES is conducted by the National Center for Health Statistics (NCHS) of the CDC. It is a program of studies designed to assess the health and nutritional status of adults and children in the United States. The NHANES interview includes demographic, socioeconomic, dietary, and health-related questions. Physical examinations and sample collection for laboratory tests are included. The survey is conducted in 2-year cycles. In this article, the NHANES 2009–2010 survey cycle provides the main source of population data for UI. However, we utilized dietary data from NHANES 2007–2008 (dietary data for 2009–2010 were not yet available) and included UI results for pregnant women in NHANES 2005–2010 in order to have a larger sample size. The survey incorporates sample population weights to account for the unequal selection probabilities caused by the cluster design, nonresponse, and planned oversampling of certain subgroups. Pregnant women were oversampled in NHANES 2001–2006. Due to the relatively small number of pregnant women in each 2-year cycle for some analyses, we combined UI results for pregnant women from NHANES 2005–2010 for different analyses in this report. For pregnant women ages 15–44 years, UI results from NHANES 2007–2010 were used. For pregnant women ages 15–44 years by trimester, UI results from NHANES 2005–2010 were used. For the entire population, UI results from NHANES 2009–2010 were used. Figure 1 illustrates the combinations of data across several cycles that were used for the projects and a justification for use of different cycles is given.
FIG. 1.

Description of National Health and Nutrition Examination Survey (NHANES) and National Children's Study (NCS) population utilized for each of the different analyses in this investigation and the justification.
Data on the sociodemographic variables sex, age, race/ethnicity, and pregnancy status were collected. Age was categorized using the following groups: 6–11, 12–19, 20–29, 30–39, 40–49, 50–59, 60–69, and 70 years and older. Race/ethnicity categories were self-reported as non-Hispanic white, non-Hispanic black, and Hispanic, which includes Mexican American and other Hispanic. Childbearing age was defined as between 15 and 44 years old. Pregnancy status was determined by a urine pregnancy test. Dairy consumption in the past 30 days was categorized as “never or rare,” “not often,” or “often.” Never or rare consumption meant any dairy product consumed less than once a week in the past 30 days; not often denoted some dairy product consumed more than once a week but less than once a day; and often meant dairy product was consumed more than once a day. Salt consumption was determined by response to the question “How often is ordinary salt or seasoned salt added in cooking or preparing foods in your household? Is it never or rarely, occasionally or very often?” Fish or shellfish consumption during the past 30 days was also included for NHANES 2007–2008. Fish included breaded fish, tuna, bass, catfish, flatfish, haddock, mackerel, perch, pike, pollock, porgy, salmon, sardines, sea bass, swordfish, trout, and other fish. Shellfish consisted of clams, crabs, crayfish, lobsters, mussels, oyster, scallops, shrimp, and other shellfish. Total grain intake was determined based on intake reported on the first day of the dietary interview. Dietary supplement use during the past 30 days was determined by response to the question, “Have you used or taken any vitamins, minerals or other dietary supplements in the past month?”
NCS design
NCS is a planned large long-term study of children's health and development. It examines the effects of the environment, as broadly defined to include factors such as air, water, diet, sound, family dynamics, community and cultural influences, and genetics on the growth, development, and health of children across the United States, following them from before birth until age 21 years. The goal of the study is to improve the health and well-being of children and contribute to understanding the role of various factors on health and disease. Details of the background and organization of this complex undertaking have been described (15,16). Briefly, the NCS structure consists of the Vanguard Study, Main Study, and formative research that supports and informs the Main Study. The Vanguard Study is a parallel extensive feasibility study that will precede the Main Study to evaluate feasibility, acceptability, and cost of recruitment, logistics, operations, and study visits. The original Vanguard Study began in 2009 and included recruitment of pregnant women at seven selected study locations throughout the United States. Women were eligible if they were not surgically sterile and were age 18 through 49 years or currently pregnant. The women had up to two pregnancy visits, which included interviews and collection of biological and environmental samples. Pregnancy visits were scheduled to occur in the first and third trimesters; this study used samples collected from women in their third trimester of pregnancy. Race/ethnicity categories were self-reported as non-Hispanic white, non-Hispanic black, and all Hispanic, which included Mexican American and other Hispanic. At the time of this submission, such interview survey results as dietary recall, food intake, and supplement use were not available.
Sample collection
During the NHANES physical examinations, spot urine specimens were collected into a prescreened collection cup from participants ages 6 years and older, and aliquots of these specimens were generated and stored cold (2°C to 4°C) or frozen until shipped. The samples were shipped on dry ice to the CDC National Center for Environmental Health (NCEH) and were stored frozen (−70°C) for <1 year. During the NCS third trimester visits, spot urine specimens were collected from participants into a prescreened collection cup, frozen, and shipped to the NCS Repository (Fisher Bioservices, Rockville, MD) on dry ice, thawed, and aliquoted into prescreened metal-free cryovials, according to NCS protocols, then stored frozen at vapor phase liquid nitrogen temperatures until shipment on dry ice to the CDC NCEH laboratory where they were also stored frozen (−70°C) for <1 year.
Iodine measurements
In all NHANES cycles except 2007–2008, UI measurements were obtained for one third of the survey population. For NHANES 2007–2008, UI measurements were obtained for all participants over age 5 years. Samples were analyzed for UI concentration using the method of Caldwell et al. (17,18). Briefly, 0.5 mL of urine was diluted 1:10 with 1% (v/v) tetramethylammonium hydroxide, 0.02% Triton™ X-100 (Mallinckrodt Baker, Inc. Phillipsburg, NJ), 25 μg/L tellurium, 5 μg/L bismuth, 5% (v/v) ethanol, 1000 μg/L gold, and 0.5 g/L EDTA. This solution was subsequently analyzed using inductively coupled plasma dynamic reaction cell mass spectrometry. Iodine was quantified based on the peak as a ratio of analyte to internal standard tellurium. The limit of detection was found to be 1.4 μg/L. The LOD as reported is equal to 3×S/N, where S/N is the signal to noise derived from the measurement process as the concentration approaches zero. Four concentration levels of quality controls were analyzed in each analytical batch. Reported results met the accuracy and precision specification of the quality control/quality assurance program of the Division of Laboratory Sciences, NCEH, CDC (19). Two quality control pools were analyzed from 2000 to 2012. One QC pool (n=869) with a concentration of 93 μg/L had a relative standard deviation (RSD) of 2.3%. The RSDs for the second pool (n=866) with a concentration of 308 μg/L was 3.0%. Absolute assay accuracy was verified by the blind analysis of two additional iodine reference solutions and the analysis of National Institute of Standard Technology (NIST) 2670A, 2672a, and 3668 Standard Reference Materials.
Stability was excellent with no trend observed for the RSD across time. To confirm agreement between survey cycles, 122 previously analyzed urine iodine samples from NHANES study years 2000–2009 were reanalyzed in 2011 by the CDC lab to assure the repeatability of those measurements across time. Concordance correlation coefficient (CCC) (20) was applied to measure the agreement between the measurements of the same iodine sample among different time periods. Overall, the CCC was 0.9955 (95% confidence interval [CI 0.9948, 0.9962]), which assures the validity of the measurements from instruments across time. The stability of measuring the iodine samples by the instruments across time from 2000 to 2010 at CDC was also established through successful administration and participation in CDC's external quality assurance program: Ensuring the Quality of Urinary Iodine Procedures (21).
Creatinine measurements
NHANES and NCS urinary creatinine concentrations were determined using the Roche/Hitachi Modular P Chemistry Analyzer (Laboratory Services, LLC, Hartford, CT) in 2009–2010 (19). This method is described in Roche's Creatinine plus Product Application no. 11775685216V18. Iodine concentrations were adjusted by using creatinine concentrations to correct for variable urine excretion rates at the time of spot urine specimen collection.
Statistical analysis
Statistical analyses were conducted using SAS, version 9.2 (SAS Institute, Inc., Cary, NC), and SUDANN PROC DESCRIPT, version 10.0 (Research Triangle Institute, Research Triangle Park, NC). In NHANES, median UI measurements and the median creatinine corrected UI concentrations with CIs were analyzed based on the method of Korn and Graubard (22). In each NHANES survey period we used sample weights to account for differential nonresponse or no coverage and to adjust for oversampling of some groups. Median test was used to compare the median UI concentrations between or among different target subpopulations in the NHANES analyses (23). Error proportions associated with certain UI thresholds were estimated and were flagged when the relative standard error was greater than 30%. In NHANES, Rao–Scott F-adjusted chi-square test was used to test the association between two categorical variables. In NCS, median UI concentrations were analyzed for subpopulations and the Kruskal–Wallis test was applied to test for equality among different study sites. Histogram plots of iodine distribution on pregnant women of childbearing age and pregnant non-Hispanic black women of childbearing age were presented with both NHANES and NCS datasets.
Results
U.S. population in NHANES 2009–2010
From NHANES 2009–2010, median UI for the U.S. population 6 years and older was 144 μg/L [CI 132–154] (Table 1), which was significantly lower (p=0.001) than the median of 164 μg/L [CI 154–173] in NHANES 2007–2008 (14). The median UI for all females was 134 μg/L [CI 125–146]. Median UI for women of childbearing age (15–44 years) was 124 μg/L [CI 111–139]. Median UI for non-Hispanic blacks was 131 μg/L [CI 120–144]. Non-Hispanic blacks had significantly lower UI concentrations compared to non-Hispanic whites and all Hispanics (p=0.03; Table 1). As shown in Figure 2, a U-shaped curve with higher median UI at lower and higher age categories was observed in NHANES 2009–2010. Lowest UI was observed in ages 12–49 years, highest in children ages 6–11 years. The UI concentrations were consistently lower in women of childbearing age compared with the general population, a relationship that has been observed since 2001 (14) (Fig. 3).
Table 1.
Urinary Iodine and Iodine Corrected for Creatinine Levels by Age, Sex, and Race/Ethnicity; Weighted Survey Analysis, NHANES 2009–2010
| |
|
|
Median [CI] |
|
|---|---|---|---|---|
| n | Weighted n | UI (μg/L) | I/Cr (μg/g creatinine) | |
| Age, years | ||||
| 6 and above | 2864 | 271,924,206 | 144 [132–154] | 143 [136–148] |
| 6–11 | 379 | 23,034,180 | 213 [188–234] | 250 [221–279] |
| 12–19 | 454 | 32,605,343 | 131 [112–151] | 117 [107–130] |
| 20–29 | 328 | 41,055,524 | 132 [109–152] | 112 [98–129] |
| 30–39 | 361 | 39,145,156 | 132 [114–156] | 114 [102–129] |
| 40–49 | 368 | 42,930,574 | 128 [108–146] | 114 [101–137] |
| 50–59 | 300 | 40,067,968 | 136 [122–160] | 147 [128–170] |
| 60–69 | 316 | 27,097,884 | 148 [124–171] | 181 [154–210] |
| 70 and above | 358 | 25,987,578 | 182 [160–206] | 239 [195–264] |
| Sex | ||||
| Male | 1402 | 132,645,050 | 152 [139–171] | 135 [126–142] |
| Female | 1462 | 139,279,157 | 134 [125–146] | 150 [143–162] |
| Race/ethnicity | ||||
| Non-Hispanic white | 1224 | 176,420,426 | 147 [133–160] | 149 [143–159] |
| Non-Hispanic black | 545 | 32,383,034 | 131 [120–144] | 98 [89–105] |
| All Hispanic | 914 | 41,172,201 | 148 [134–160] | 142 [137–149] |
| Women of childbearing age | 605 | 61,583,168 | 124 [111–139] | 117 [108–127] |
UI, urinary iodine; I/Cr, iodine corrected for creatinine levels; CI, 95% confidence interval.
FIG. 2.
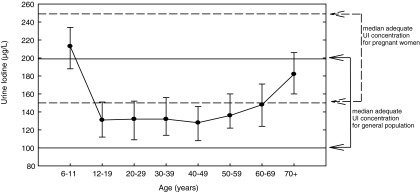
Median urinary iodine (UI, μg/L) by age category, NHANES 2009–2010, participants 6 years and older. The solid horizontal reference lines indicate the adequate iodine intake range defined by the World Health Organization (WHO; 100–199 μg/L) for the general population. The dashed horizontal reference lines indicate sufficient median iodine intake for pregnant women (150–249 μg/L).
FIG. 3.

Median UI (μg/L) for participants older than 6 years and women of childbearing age based on NHANES 2001–2010.
NHANES 2007–2010 U.S. pregnancy data and NCS
Table 2 presents the median UI with CI in NHANES 2007–2010 by pregnancy status for women of childbearing age (15–44 years) and for NCS pregnant women. The median UI for pregnant women in NHANES 2009–2010 was 135 μg/L [CI 108–172] compared with 167 μg/L [CI 151–185] in third trimester pregnant women in the NCS study.
Table 2.
Median and Low Urinary Iodine Concentrations in U.S. Women of Childbearing Age (15–44 Years) by Pregnancy Status, NHANES 2007–2010 Compared to NCS
| |
|
|
<150 (μg/L) |
<100 (μg/L) |
<50 (μg/L) |
||||||
|---|---|---|---|---|---|---|---|---|---|---|---|
| n | Median [CI] | % | SE | n | % | SE | n | % | SE | n | |
| NHANES total | 1568 | 133 [121–143] | 56.3 | 2.2 | 862 | 36.9 | 1.9 | 550 | 15.4 | 1.8 | 205 |
| NHANES Pregnant | 76 | 135 [109–172] | 55.8 | 7.7 | 45 | 26.3 | 6.5 | 26 | 15.7 | 6.6a | 13 |
| NHANES Nonpregnant | 1492 | 133 [121–143] | 56.3 | 2.2 | 817 | 37.3 | 1.9 | 524 | 15.4 | 1.9 | 192 |
| NCS Pregnant | 501 | 167 [151–185] | 45.3 | 2.3 | 227 | 26.7 | 1.9 | 134 | 7.0 | 1.5 | 35 |
The relative standard error >30%. The NHANES guidelines recommend a relative standard error ≤30%.
SE, standard error.
Trimester data NHANES and NCS
Given the limited number of pregnant women in both NHANES 2007–2010 (n=76) or NHANES 2009–2010 (n=22), stratification by trimester was only possible by using all pregnant women who participated in 2005–2010 NHANES (the number of pregnant women was 206; however, only 176 participants had trimester data available). Table 3 presents the median UI concentrations for women of childbearing age and pregnant women. Women in their first trimester had a median UI of 109 μg/L (n=42) while the second trimester women had a median UI of 128 μg/L (n=70). The median UI for NHANES women in their third trimester was 172 μg/L [CI 109–267] (n=64), comparable to the NCS third trimester pregnant women (167 μg/L [CI 151–185], n=501; Table 2).
Table 3.
Median Urinary Iodine Concentrations for Women of Childbearing Age and Pregnant Women by Trimester, NHANES 2005–2010
| Category | n | UI (μg/L) median [95% CI] |
|---|---|---|
| Total | 2233 | 129 [120–136] |
| Pregnant | 206 | 129 [101–173] |
| Nonpregnant | 2027 | 129 [119–136] |
| Trimester 1 | 42 | 109 [50–219] |
| Trimester 2 | 70 | 128 [88–219] |
| Trimester 3 | 64 | 172 [109–267] |
Distribution of UI in NCS and NHANES (2007–2010)
Among NHANES pregnant women, approximately 55.8% (±7.7%) had UI that suggested less than adequate iodine intake (<150 μg/L, Table 2). Among NCS women, approximately 45.3% (±2.3%) had UI that indicated less than adequate iodine intake. The distributions of UI for pregnant women in NHANES 2007–2010 and in NCS are presented in Figures 4A and 4B. Figure 4A shows the median UI of 135 μg/L and distribution in pregnant women from NHANES 2007–2010. The 5th and 95th percentiles of the UI distribution were 40 and 508 μg/L, respectively (Fig. 4A). Figure 4C shows the distribution for NHANES 2007–2010 pregnant non-Hispanic black women. The median UI concentration was 119 μg/L with 5th and 95th percentiles of 34 and 347 μg/L, respectively. Figures 4B and 4D show the distribution of UI in NCS women. The median UI for all NCS pregnant women was 167 μg/L, with 5th and 95th percentiles of 43 and 605 μg/L (Fig. 4B). For non-Hispanic black NCS pregnant women, median UI was considerably lower (132 μg/L) relative to all NCS pregnant women (Fig. 4D). It is interesting to note that only the NCS population has women with UI concentration greater than ∼900 μg/L. These apparent outliers represent only few participants who are taking iodine-containing supplements or another significant source of iodine.
FIG. 4.

(A) Histogram of UI (μg/L) for pregnant women in NHANES 2007–2010 (n=76; reference line denotes the median UI=135.0 μg/L). (B) Histogram of UI (μg/L) for pregnant women (n=501) in the NCS (reference line denotes the median UI=166.9 μg/L). (C) Histogram of UI (μg/L) for pregnant non-Hispanic black women, NHANES 2007–2010 (n=14; reference line denotes the median UI=118.5 μg/L). (D) Histogram of UI (μg/L) for pregnant non-Hispanic black women (n=22) in the NCS (reference line denotes the median UI=133 μg/L).
Race/ethnicity in 2009–2010 NHANES and NCS
Table 4 provides details on UI concentration by race/ethnicity and age from both 2009–2010 NHANES and NCS. Non-Hispanic blacks in each age category and in both study cohorts had lower median UI concentrations than non-Hispanic whites and all Hispanics. The trend is consistent for uncorrected and creatinine-corrected data.
Table 4.
Comparison of Urinary Iodine Levels by Race/Ethnicity and Age Groups in the United States
| |
NHANES 2009–2010 |
NCS |
|||||
|---|---|---|---|---|---|---|---|
| Age groups | Race/ethnicity | n | UI (μg/L) median [CI] | I/Cr (μg/g creatinine) median [CI] | n | UI (μg/L) median [CI] | I/Cr (μg/g creatinine) median [CI] |
| 6–11 years | Non-Hispanic white | 109 | 241 [193–281] | 285 [227–360] | |||
| Non-Hispanic black | 84 | 168 [120–223] | 163 [120–226] | ||||
| All Hispanic | 159 | 198 [153–254] | 238 [216–268] | ||||
| 12–19 years | Non-Hispanic white | 164 | 141 [107–162] | 125 [113–139] | —a | ||
| Non-Hispanic black | 97 | 130 [107–155] | 86 [72–109] | — | |||
| All Hispanic | 162 | 150 [124–165] | 132 [113–145] | — | |||
| 20+ years | Non-Hispanic white | 951 | 143 [128–158] | 147 [137–159] | 327 | 179 [157–199] | 208 [196–227] |
| Non-Hispanic black | 364 | 129 [117–144] | 94 [84–101] | 22 | 132 [104–221] | 97 [86–189] | |
| All Hispanic | 593 | 137 [125–156] | 137 [126–144] | 86 | 178 [136–209] | 152 [135–177] | |
| Region | |||||||
|---|---|---|---|---|---|---|---|
| 12+ years | North Carolina | 82 | 217 [177–251] | 169.4 [141.4–210.1] | |||
| South Dakota/Minnesota | 102 | 205 [161–225] | 203.1 [177.9–242.7] | ||||
| Pennsylvania | 45 | 125 [107–199] | 196.4 [161.2–311.7] | ||||
| California | 62 | 107 [86–147] | 144.7 [121.4–195.2] | ||||
| New York | 39 | 150 [86–186] | 149.7 [126.3–189.6] | ||||
| Utah | 102 | 190 [168–209] | 197.5 [162.7–219.5] | ||||
| Wisconsin | 69 | 145 [112–193] | 241.2 [205.5–286.9] | ||||
NCS 12–19 years has frequencies that fall below the disclosure threshold.
Geographic location (in NCS data only)
Table 4 also provides the NCS sample population stratified by geographic locations. The NCS participants consist of pregnant women from seven different geographic locations in the United States. The participating study centers were located in California, North Carolina, Minnesota and South Dakota, New York, Pennsylvania, Utah, and Wisconsin. Table 3 provides NCS median UI concentrations by the geographic region of the study site. All seven sites had different median UI concentrations. All collection sites used collection material that had been prescreened at the CDC. It is unlikely that protocol or material influenced the results. Urine iodine is very stable once collected as discussed in the Data and Methods section. Several study sites had median UI concentrations <150 μg/L. The California median UI was 107 μg/L well below those found in North Carolina, South Dakota-Minnesota, and Utah (217, 205, and 190 μg/L, respectively). New York and Wisconsin had median UI concentrations of 150 μg/L and 145 μg/L, respectively, while Pennsylvania had a median UI of 125 μg/L. Median UI concentrations in California, Pennsylvania, and Wisconsin were below the recommended median UI concentration of 150 μg/L for pregnant women.
Dietary questions in NHANES 2007–2008
Dairy products consumption has been shown to be significantly associated with iodine intake (6). Table 5 shows the association between dairy consumption in the past 30 days and race/ethnicity for women of childbearing age in NHANES 2007–2008. The proportion of non-Hispanic black women who never or rarely consumed dairy products in the past 30 days was 39.8%, significantly higher than non-Hispanic whites (27.1%) or all Hispanics (31.1%) (p=0.004, Rao–Scott F-adjusted chi-square test). The median UI concentrations for non-Hispanic blacks were the lowest in each dairy consumption level compared to other race/ethnicity groups.
Table 5.
Urinary Iodine Median and 95% Confidence Interval by Race and Dairy Product, Salt, and Fish and Fish/Shellfish Consumption in Women of Childbearing Age, NHANES 2007–2008
| Race | Dairy consumption | n | Weighted % | UI (μg/L)median [CI] | p valuea |
|---|---|---|---|---|---|
| Non-Hispanic white | Never or rare | 149 | 27.1 | 111 [90–142] | 0.0001 |
| Not often | 167 | 31.1 | 131 [99–165] | ||
| Often | 216 | 41.8 | 189 [163–204] | ||
| Non-Hispanic black | Never or rare | 126 | 39.8 | 111 [82–132] | 0.0009 |
| Not often | 89 | 27.9 | 109 [89–163] | ||
| Often | 101 | 32.3 | 151 [110–212] | ||
| All Hispanic | Never or rare | 153 | 31.1 | 134 [106–155] | <0.0001 |
| Not often | 133 | 27.2 | 163 [130–196] | ||
| Often | 210 | 41.7 | 185 [155–207] |
| Salt consumption | |||||
|---|---|---|---|---|---|
| Non-Hispanic white | Never or rare | 142 | 27.1 | 110 [91–149] | 0.07 |
| Not often | 188 | 37.1 | 144 [116–189] | ||
| Often | 183 | 35.9 | 148 [113–185] | ||
| Non-Hispanic black | Never or rare | 77 | 24.5 | 117 [93–161] | 0.2 |
| Not often | 97 | 29.5 | 132 [82–195] | ||
| Often | 136 | 45.9 | 116 [97–132] | ||
| All Hispanic | Never or rare | 78 | 17.2 | 154 [124–239] | 0.2 |
| Not often | 128 | 27.1 | 152 [124–182] | ||
| Often | 255 | 55.6 | 165 [141–194] |
| Fish/shellfish consumption | |||||
|---|---|---|---|---|---|
| Non-Hispanic white | Yes | 353 | 70.6 | 144 [114–178] | 0.6 |
| No | 159 | 29.4 | 134 [100–175] | ||
| Non-Hispanic black | Yes | 244 | 81.7 | 119 [99–151] | 0.5 |
| No | 66 | 18.3 | 123 [83–159] | ||
| All Hispanic | Yes | 339 | 73.4 | 166 [153–185] | 0.03 |
| No | 128 | 26.6 | 146 [108–185] |
The p value tests whether the median UI concentrations were significantly different among never or rare, not often, and often dairy, and salt consumption groups within each race/ethnicity group. The p value tests whether the median UI concentrations were significantly different among yes or no answers for fish/shellfish consumption during the past 30 days within each race/ethnicity group.
The relationship between salt consumption and median UI was also evaluated across race/ethnicity categories (Table 5). Hispanics reported greater salt use than the other groups, with 17.2% reporting never or rare use during the last 30 days compared to 24.5% for non-Hispanic blacks and 27.1 % for non-Hispanic whites. The proportion of Hispanic women who reported using salt often was 55.6 %, significantly higher than non-Hispanic blacks (45.9%) and non-Hispanic whites (35.9%) (p<0.0001, Rao–Scott F-adjusted chi-square test).
Fish or shellfish intake during the last 30 days was not significantly associated with median UI concentrations in racial/ethnic groups with the exception of Hispanics (Table 5). Hispanic women who reported fish or shellfish intake had significantly higher median UI compared to non–fish-consuming Hispanics (p=0.03). There was no significant association between higher median UI and grain intake, or supplement use in each race/ethnicity category during the past 30 days (data not shown).
Discussion
NHANES 2009–2010 indicates that median UI in the general population is 144 μg/L [CI 132–154]. That concentration is significantly lower than in the 2007–2008 cycle, in which median UI was 164.0 μg/L [CI 154–173] (p=0.001). In NHANES 2009–2010, certain groups within the U.S. population did not achieve adequate dietary iodine intake. Non-Hispanic blacks had a significantly lower UI concentration than non-Hispanic whites and all Hispanic groups. Non-Hispanic white children had the highest UI levels, in the more than adequate range, while non-Hispanic black and Hispanic children had median UI in the adequate range. In the U.S. population, age groups 12–49 years had the lowest UI, which has been noted before (14). As in previous NHANES survey periods, women had lower UI concentrations than men (14). NHANES data (2007–2010) indicated that 37.3% of nonpregnant women of childbearing age (n=1492) have UI concentrations below 100 μg/L, while 55.8% of pregnant women (n=76) have UI concentrations less than 150 μg/L. Meanwhile, in the convenience sample of 501 pregnant women from the NCS, 45.3% of the participants had UI concentrations less than 150 μg/L. The observed difference in the proportion of pregnant women with UI<150 μg/L is most likely because the NCS participants were all in their third trimester of pregnancy. While there were only 76 pregnant women in NHANES 2007–2010 with UI measurements, limiting our ability to look at data stratified by trimester of pregnancy due to insufficient power, by combining NHANES 2005–2010 data we were able to increase our sample of pregnant women to 206. We stratified these women into trimester groups. The NHANES third trimester UI concentration 172 μg/L [CI 109–267] is very similar to the UI concentration found in the third trimester women participating in the NCS pilot study (167 μg/L [CI 151–185]).
UI levels found in women in the third trimester in both NHANES and NCS were in the adequate iodine intake range. Women in late pregnancy may be more attuned to maintaining adequate nutrition or may be taking supplements with iodine. Most iodine-containing multivitamins should have at least 150 μg of iodine, but only about half of the multivitamins sold in the United States contain iodine (12). According to Gregory et al. (12), in the NHANES 2001–2006, approximately 76.9% of pregnant women reported prenatal supplement use. However, only 20.3% of those preparations contained iodine. Prenatal vitamins are not a dependable source of iodine, since only about 51% may contain iodine and of those that do, the measured iodine concentration can vary±50% from the labeled content (12). In addition to being an inconsistent source of iodine, relying on the use of prenatal vitamins to ensure iodine sufficiency during pregnancy may miss the very early stages of the fetal development. Not surprisingly, when we looked at supplement use (yes or no) in NHANES women of childbearing age, there was no significant correlation between those using supplements and those not using supplements.
There is a need to look beyond pregnancy status to identify what may be influencing UI concentrations in subpopulations. NHANES 2009–2010 indicates that non-Hispanic blacks had lower UI levels compared to non-Hispanic whites and all Hispanics across all age categories. However, the number of pregnant participants in NHANES was insufficient to look at pregnancy status by race/ethnicity. In the NCS pilot study, non-Hispanic black pregnant women ages 20 years and above had lower UI concentrations than both non-Hispanic whites and Hispanics, which was also lower than what WHO suggested for pregnant women. There were only five NCS women less than 20 years, and their median UI was 224 μg/L [CI 106–1701]. There is a wide confidence interval with a very small population.
The NHANES and NCS UI data suggest that non-Hispanic black women have lower UI concentration than other women. Additionally, non-Hispanic black women had lower dairy consumption, based on NHANES 2007–2008 data. Almost 40% of non-Hispanic black women of childbearing age never or only rarely consume dairy products compared with 27.1% of non-Hispanic white women and 31.1% of Hispanics. Moreover, proportionately more Hispanic and non-Hispanic white women of childbearing age reported consuming dairy products daily than do non-Hispanic blacks. Non-Hispanic black women reporting lower rates of dairy consumption is consistent with recent data on U.S. population reports of lactose intolerance (8). That study found that 76% of adults reporting to be lactose intolerant were female, and among females, 50% were non-Hispanic black, 30% non-Hispanic white, and 20% Hispanic. Self-diagnosed lactose intolerance and consequent avoidance of dairy products may be one of the contributing factors in the racial/ethnic differences we have shown in UI concentration.
Neither salt use during food preparation nor grain intake was significantly associated with an increase in median UI for any race/ethnic category of women of childbearing age. However, among women of childbearing age in NHANES who claimed to never or only rarely consume salt, Hispanic women had the highest median UI (154 μg/L) compared with non-Hispanic whites (110 μg/L) or non-Hispanic blacks (117 μg/L). The use of salt, consumption of grain, or fish/shellfish intake did not significantly affect UI, although there were racial/ethnic differences in reported salt use and fish/shellfish intakes.
Analysis has shown regional differences in UI among pregnant women in the NCS study. Future work with the NCS may provide the statistical power needed to stratify the participants within each region by race/ethnicity. The present data suggest that race/ethnicity is an important predictor of iodine status. However geographic location may prove to be an equally important predictor. Additionally, within pregnant women in the NCS, we have identified iodine insufficiency among non-Hispanic blacks and among NCS subgroups evaluated geographically. These data enhance ongoing efforts to identify populations at risk for iodine deficiency and may help direct efforts to ensure optimal fetal and postnatal development. NCS will be an important tool to assist in evaluation of U.S. population iodine intake in a vulnerable group. The NCS not only has important data on pregnant women but will collect data that may link the iodine status in pregnant women to birth and child health outcomes.
This study has several strengths. This is the largest known population of pregnant women to be surveyed for UI concentration at one time in the United States. Through NHANES and NCS we have a diverse sample set covering different ethnic groups, ages, geographic regions, and different stages of pregnancy. There are several limitations. These include the temporality of the UI biomarker, limited personal and health information, and unknown selection biases in the NCS convenience sample.
Conclusion
The median UI concentration for the general U.S. population in NHANES 2009–2010 was significantly lower than the levels found during NHANES 2007–2008. These differences likely result from variations in dietary iodine intake for both the general population and for women of childbearing age. Grain, salt, and fish/shellfish had little effect on UI in women of childbearing age except for Hispanic women, in whom median UI was correlated with fish and shellfish intake. A higher proportion of non-Hispanic black women may avoid dairy products due to concerns about lactose intolerance. Children had a higher UI level than adults. Non-Hispanic white and Hispanic children have UI levels in the upper range of adequate or in the more than adequate range. Non-Hispanic black children have UI concentrations that put them solidly in the adequate range.
NCS data provide a unique look at a large population of pregnant women in the United States. The data indicate that third trimester pregnant non-Hispanic black women age 20 years and older were the only racial/ethnic group with median UI below 150 μg/L. This racial/ethnic UI pattern was consistent with observations in NHANES data for the general population.
Understanding the median UI differences within subpopulations of the United States may help to identify where public health interventions should be focused to ensure adequate iodine nutrition for all, and can allow educational efforts to focus on groups for which evidence indicates inadequate iodine intake. Prevention of unnecessary self-imposed dairy restriction and improved iodine intake may be achieved by medical evaluation and education of individuals who perceive themselves to be lactose intolerant but who are not. Individuals with confirmed lactose intolerance, particularly women who are pregnant or who are of childbearing age, should be counseled about iodine supplementation. Public health intervention may include continued efforts by the medical community and public health officials to promote the use of iodine-containing prenatal vitamins and to promote continued efforts to monitor actual iodine content in prenatal vitamins. The NCS data have provided an opportunity to look across seven geographical locations, noting differences in median values among study sites. Further study is needed to determine if the concentration of iodine in the dairy consumed varies geographically and may be a significant factor in median UI concentrations, along with race/ethnicity.
Acknowledgments
This analysis was conducted as part of the National Children's Study, supported by the Eunice Kennedy Shriver National Institute of Child Health and Human Development (NICHD), and funded, through its appropriation, by the Office of the Director of the National Institutes of Health. Supported by NICHD Contracts HHSN275200503414C, HHSN275200503411C, HHSN275200603416C, HHSN275200503415C, HHSN275200503413C, HHSN275200503410C, and HHSN275200503396C. The manuscript was developed by a Writing Team identified by the National Children's Study Publications Committee for the purpose of timely sharing of centrally collected NCS data. In addition, funding for the biospecimen analyses was provided by the National Center for Environmental Health, Centers for Disease Control and Prevention. The findings and conclusions in this report are those of the authors and do not necessarily represent the views of the Centers for Disease Control and Prevention, the National Children's Study or the National Institutes of Health, or the U.S. Department of Health and Human Services.
Disclosure Statement
The authors declare that no competing financial interests exist.
References
- 1.Andersson M. Karumbunathan V. Zimmermann MB. Global iodine status in 2011 and trends over the past decade. J Nutr. 2012;142:744–750. doi: 10.3945/jn.111.149393. [DOI] [PubMed] [Google Scholar]
- 2.Hetzel B. Iodine deficiency disorders (IDD) and their eradication. Lancet. 1983;322:1126–1129. doi: 10.1016/s0140-6736(83)90636-0. [DOI] [PubMed] [Google Scholar]
- 3.Hetzel BS. Delange F. Dunn JT. Ling J. Mannar V. Pandav C. Oxford University Press; Delhi: 2004. Towards the global elimination of brain damage due to iodine deficiency. [Google Scholar]
- 4.Bleichrodt N. Born M. A meta analysis of research on iodine, its relationship to cognitive development. In: Stanbury J, editor. The Damaged Brain of Iodine Deficiency. Cognizant Communication; New York: 1994. pp. 187–191. [Google Scholar]
- 5.Murray CW. Egan SK. Kim H. Beru N. Bolger PM. US Food and Drug Administration's total diet study: dietary intake of perchlorate and iodine. J Expo Sci Environ Epidemiol. 2008;18:571–580. doi: 10.1038/sj.jes.7500648. [DOI] [PubMed] [Google Scholar]
- 6.Hemken RW. Milk and meat iodine content—relation to human health. J Am Vet Med Assoc. 1980;176:1119–21. [PubMed] [Google Scholar]
- 7.Pearce EN. Pino S. He X. Bazrafshan HR. Lee SL. Braverman LE. Sources of dietary iodine: bread, cows' milk, and infant formula in the Boston area. J Clin Endocrinol Metab. 2004;89:3421–3424. doi: 10.1210/jc.2003-032002. [DOI] [PubMed] [Google Scholar]
- 8.Nicklas TA. Qu HY. Hughes SO. He MY. Wagner SE. Foushee HR. Shewchuk RM. Self-perceived lactose intolerance results in lower intakes of calcium and dairy foods and is associated with hypertension and diabetes in adults. Am J Clin Nutr. 2011;94:191–198. doi: 10.3945/ajcn.110.009860. [DOI] [PubMed] [Google Scholar]
- 9.Dasgupta PK. Liu Y. Dyke JV. Iodine nutrition: iodine content of iodized salt in the United States. Environ Sci Technol. 2008;42:1315–1323. doi: 10.1021/es0719071. [DOI] [PubMed] [Google Scholar]
- 10.Institute of Medicine. The National Academies Press; Washington, DC: 2001. Dietary reference intakes for vitamin A, vitamin K, arsenic, boron, chromium, copper, iodine, iron, manganese, molybdenum, nickel, silicon, vanadium, and zinc. [PubMed] [Google Scholar]
- 11.Public Health Committee of the American Thyroid Association. Becker DV. Braverman LE. Delange F. Dunn JT. Franklyn JA. Hollowell JG. Lamm SH. Mitchell ML. Pearce E. Robbins J. Rovet JF. Iodine supplementation for pregnancy and lactation—United States and Canada: recommendations of the American Thyroid Association. Thyroid. 2006;16:949–951. doi: 10.1089/thy.2006.16.949. [DOI] [PubMed] [Google Scholar]
- 12.Gregory CO. Serdula MK. Sullivan KM. Use of supplements with and without iodine in women of childbearing age in the united states. Thyroid. 2009;19:1019–1020. doi: 10.1089/thy.2009.0166. [DOI] [PubMed] [Google Scholar]
- 13.World Health Organization. Third. World Health Organization; Geneva: 2008. Assessment of iodine deficiency disorders and monitoring their elimination—a guide for programme managers. [Google Scholar]
- 14.Caldwell KL. Makhmudov A. Ely E. Jones RL. Wang RY. Iodine status of the U.S. population, National Health and Nutrition Examination Survey, 2005–2006 and 2007–2008. Thyroid. 2011;21:419–427. doi: 10.1089/thy.2010.0077. [DOI] [PubMed] [Google Scholar]
- 15.Mortensen M. Hirschfeld S. The National Children's Study: an opportunity for medical toxicology. J Med Toxicol. 2012;8:160–165. doi: 10.1007/s13181-011-0197-8. [DOI] [PMC free article] [PubMed] [Google Scholar]
- 16.The National Childrens Study. What is the National Children's Study? www.nationalchildrensstudy.gov/Pages/default.aspx. [Aug 3;2012 ]. www.nationalchildrensstudy.gov/Pages/default.aspx
- 17.Caldwell KL. Jones R. Hollowell JG. Urinary iodine concentration: United States National Health and Nutrition Examination Survey 2001–2002. Thyroid. 2005;15:692–699. doi: 10.1089/thy.2005.15.692. [DOI] [PubMed] [Google Scholar]
- 18.Caldwell KL. Maxwell CB. Makhmudov A. Pino S. Braverman LE. Jones RL. Hollowell JG. Use of inductively coupled plasma mass spectrometry to measure urinary iodine in NHANES 2000: comparison with previous method. Clin Chem. 2003;49:1019–1021. doi: 10.1373/49.6.1019. [DOI] [PubMed] [Google Scholar]
- 19.Caudill SP. Schleicher RL. Pirkle JL. Multi-rule quality control for the age-related eye disease study. Stat Med. 2008;27:4094–4106. doi: 10.1002/sim.3222. [DOI] [PubMed] [Google Scholar]
- 20.Lin LI. A concordance correlation coefficient to evaluate reproducibility. Biometrics. 1989;45:255–268. [PubMed] [Google Scholar]
- 21.Centers for Disease Control and Prevention. Ensuring the quality of urinary iodine procedures. www.cdc.gov/labstandards/equip.html. [Aug 3;2012 ]. www.cdc.gov/labstandards/equip.html
- 22.Korn EL. Graubard BI. Confidence intervals for proportions with small expected number of positive counts estimated from survey data. Surv Methodol. 1998;24:193–201. [Google Scholar]
- 23.Williams RL. Perritt RL. The Weighted Median Test for Finite Population Samples. American Statistical Association; Washington, DC: 1986. [Google Scholar]