

Abstract
Human brain matures in temporal and regional heterogeneity, with some areas matured at early adulthood. In this study, the relationship of cortical structural developments between different cortical sheet regions is systematically analyzed using interregional correlation coefficient and network methods. Specifically, 951 longitudinal T1 brain MR images from 445 healthy subjects with ages from 3 to 20 years old are used. The result shows that the development of cortex reaches a turning point at around 7 years of age: a) the cortical thickness reaches its highest value and also the cortical folding becomes stable at this age; b) both global and local efficiencies of anatomical correlation networks reach the lowest and highest values at this age, respectively; and c) the change of anatomical correlation networks reach the highest level at this age, and the convergence of different anatomical correlation networks starts to decrease from this age. These results might inspire more studies on why there exists a turning point at this age from different viewpoints. For example, is there any change of synaptic pruning, or is it related to the starting of school life? And how can we benefit from this in the real life?
Keywords: Cortex development, Cortical thickness, Cortical folding, Anatomical network
Introduction
Human brain matures at different rates across time and different regions, with some areas matured at early adulthood. Specifically, the total size of the brain reaches approximately 90% of its adult size at 6 years of age (Giedd, 2004; Reiss et al., 1996). Cortical thickness and volume have been shown to follow an inverted U-shaped developmental course, with a period of initial childhood increase and a subsequent adolescent decline (Courchesne et al., 2000; Giedd, 2004; Gogtay et al., 2004; Kennedy et al., 2002; Pfefferbaum et al., 1994; Reiss et al., 1996; Shaw et al., 2008). The early cortical thinning may reflect pruning in the form of use-dependent selective synapse elimination (Bourgeois and Rakic, 1993; Huttenlocher and Dabholkar, 1997; Shaw et al., 2008), which could play a key role in shaping neural circuits and could be a biological basis for ongoing development of cognitive abilities and behavior (Hensch, 2004; Knudsen, 2004). Thus, quantitative characterization of brain maturation might be essential to reveal the relationship between cortical structural connection and high-level functional development, and also for understanding neuro-developmental disorders (Schlaggar et al., 2002; Stiles, 2000).
Longitudinal structural neuroimaging provides a powerful tool for developmental neuroscience to measure anatomical changes over time (Raznahan et al., 2011). In recent years, neuroimaging methods have provided fundamental insights into characterizing the features of human brain maturation, and revealing the difference related to sex, cognitive ability, genetic profile, and disease status during neuro-development (Giedd and Rapoport, 2010). Though the development of cortical structures shows regional heterogeneity in humans in recent studies (Gogtay et al., 2004; Shaw et al., 2008; Sowell et al., 2004), the underlying relationship between structural developments between different cortical sheet regions still needs to be quantified (Raznahan et al., 2011).
Human brain could also be characterized as a complex anatomical and functional network developing over the whole life (Achard et al., 2006; Eguiluz et al., 2005; Salvador et al., 2005; Sporns et al., 2004; Stam, 2004; Stam et al., 2007). The functional network in human brain has been explored extensively using electroencephalogram (EEG) (Micheloyannis et al., 2006; Stam et al., 2007), magnetoencephalography (MEG) (Stam, 2004), and functional magnetic resonance imaging (fMRI) (Achard et al., 2006; Eguiluz et al., 2005; Gao et al., 2011; Salvador et al., 2005). The small-world property (Watts and Strogatz, 1998), which indicates that most nodes in the network are not neighbors of one another, but can be reached from every other by a small number of hops or steps, has been found in the functional network of the adult brain (Achard et al., 2006; Eguiluz et al., 2005; Salvador et al., 2005). Meanwhile, the network of anatomical connections in the human brain has also been studied recently (Gong et al., 2009a, 2012; He et al., 2007; Sporns et al., 2004). The correlations of cortical thickness between different regions across subjects have been measured and formed as structural connections (He et al., 2007; Sporns et al., 2005). The anatomical connection could also be estimated by regional diffusion-based anatomical connectivity using probabilistic tractography (Gong et al., 2009a, 2012).
In this study, the relationship between cortical structural developments in different cortical sheet regions is systematically analyzed using interregional correlation coefficient and network methods. Specifically, 951 longitudinal T1 brain MR images from 445 healthy subjects with ages from 3 to 20 years old are used, and for each subject at each time point its cortical thickness and cortical folding are first calculated on its inner cortical surface (the interface between white matter and gray matter) that has been parcellated into 78 regions of interest (ROIs). Then, the correlation matrices for cortical thickness and cortical folding at each time point and also at all time points are constructed, respectively, by computing the interregional Pearson's correlation coefficient of any pair of ROIs across subjects.
To analyze the development of the interregional correlation coefficient, the development of left/right hemispheric symmetry is particularly measured by the correlation value between corresponding left and right regions at different longitudinal times. Then, by using the interregional correlation coefficient as the regional similarity, the whole cortex is clustered into several large regions with distinct structural developmental patterns by a clustering method (Frey and Dueck, 2007).
Finally, the presence/absence pattern (i.e., binary pattern) of the connection network is constructed from each interregional correlation matrix, and its statistical and anatomical properties, especially the small-world property and connectivity distribution using graph theoretical analysis, are adopted to analyze the longitudinal development of anatomical networks.
Methods
Subjects and image acquisition protocol
Data were obtained from the Pediatric MRI Data Repository (Release 4.0) created for the NIH MRI Study of Normal Brain Development (Evans, 2006), a multi-site longitudinal project aimed at providing a normative database to characterize healthy brain maturation in relation to behavior. This database includes subjects from neonates to 21 years of age who underwent extensive cognitive, neuropsychological and behavioral testing along with multiple MRI brain imaging sessions. 951 sessions from 445 subjects with ages from 3 to 20 years old were used here. As this study aimed to study healthy subjects, exclusion criteria included (but were not limited to) prior history of medical illnesses with CNS implications, IQb70, and intra-uterine exposure to substances known or highly suspected to alter brain structure or functions (Evans, 2006; Waber et al., 2007).
A three-dimensional T1-weighted (T1W) Spoiled Gradient Recalled (SPGR) echo sequence from 1.5 Tscanners was obtainedoneach participant, with 1 mm isotropic data acquired sagittally from the entire head. Slice thickness of ∼1.5 mm was allowed for GE scanners due to their limit of 124 slices. In addition, T2-weighted (T2W) and proton density-weighted (PDW) images were acquired using a two-dimensional (2D) multi-slice (2 mm) dual echo fast spin echo (FSE) sequence. Total acquisition time was about 25 min and was often repeated when indicated by the scanner-side quality control process.
Image processing
In order to measure cortical attributes for each session, T1-weighted images were adopted. For each T1-weighted image, the skull stripping was first performed to remove non-cerebral tissues, and also the cerebellum and brain stem were further removed (Smith, 2002). Then the brain image was segmented into gray matter (GM), white matter (WM), and cerebrospinal fluid (CSF) regions (Zhang et al., 2001). After topology correction of the WM volume, the inner and outer cortical surfaces were reconstructed and represented by the triangular meshes, composed of a set of vertices and triangles (Liu et al., 2008). Based on the automated anatomical labeling template (Tzourio-Mazoyer et al., 2002), each cortical surface was parcellated into 78 regions of interest (ROIs) by a high-dimensional nonlinear hybrid volumetric/surface registration method (Liu et al., 2004; Shen and Davatzikos, 2002). The 78 cortical surface regions of interest defined by the template are provided in Table S1.
Cortical thickness can be measured by various distance metrics between inner and outer cortical surfaces, such as the linked distance (Kim et al., 2005), curved streamline distance (Jones et al., 2000) and shortest distance (Fischl and Dale, 2000; Li et al., 2012). For our ROI-based study, cortical thickness was measured in the native space using the shortest distance between inner and outer cortical surfaces at each vertex. For each session, regional cortical thickness was defined as the average thickness of all vertices belonging to the same ROI. The curvedness (Koenderink and Vandoorn, 1992) of the inner cortical surface was adopted to characterize the local cortical folding as did in Nie et al. (2012). Recent comparison on the curvature-based measurement and the gyrification index (Rodriguez-Carranza et al., 2007) shows that these two types of measurements perform similarly on the inner cortical surfaces. For each session, regional cortical folding was defined as the average curvedness of all vertices belonging to the same ROI.
Measurement of correlations between ROIs
The statistical similarity between two cortical regions can be measured by computing the interregional Pearson's correlation coefficient of cortical properties across subjects after removing the effects of multiple confounding variables. Since the anatomical features of brain might not develop uniformly during this age range (3 to 20 years of age), statistical similarity between two cortical regions might change with ages. Thus, the interregional correlations across all ages and at each age are calculated as below.
Correlations across all ages
A linear regression analysis was performed at each cortical region across all sessions (with one session defined as a scan of a subject, thus each subject probably having several sessions at different ages) in order to remove the effects of multiple confounding variables: gender, and overall mean cortical thickness and curvedness (He et al., 2007). The residual of the regression was treated as the raw value of each ROI. Then, the statistical similarity between two cortical regions was measured by computing the interregional Pearson's correlation coefficient of cortical thickness or cortical folding across all sessions. Since the variable age is not removed in the linear regression, the calculated correlation could represent the similarity between regions across all ages.
Correlations at each year
Another potential analysis method is to calculate the correlation coefficient at each year, and then measure the change of correlations with the age. However, since the number of sessions at certain ages (such as 4 and 5 years of age) is small as shown in Fig. 1, the correlation value might not be estimated accurately at these ages. Thus, a weighted correlation coefficient (Bland and Altman, 1995) is adopted herein to include more sessions at each year (t) by assigning small weights to sessions at other years:
Fig. 1.
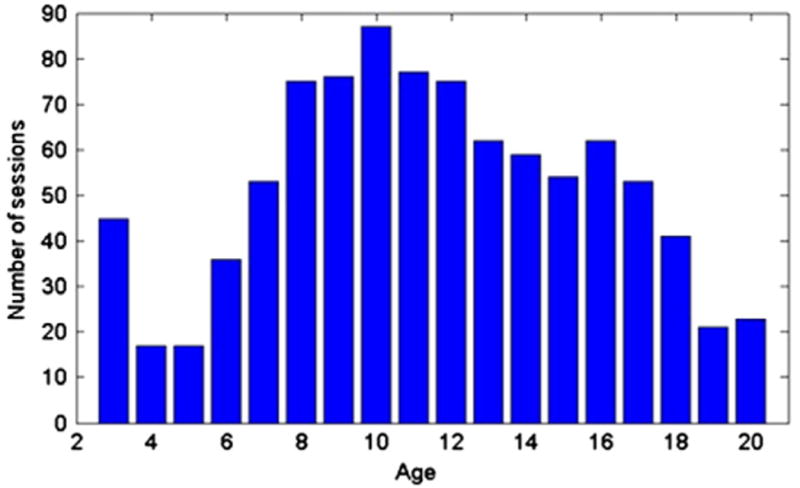
The number of sessions at each year.
| (1) |
where xi and yi are the anatomical properties of session i at regions x and y, respectively, and is the weight for session i at year t, which is defined as:
| (2) |
where ti is the age of a subject in session i, λ is the smooth parameter which is set as 0.1 in our experiment, and (t − tr, t + tr) is the range of years we used to estimate the correlation at year t. Thus, the sessions with ages in the range (t − tr, t + tr) are included for calculating the correlation at year t, and their importance is weighted by the respective age difference. Note that, when setting for all sessions, the weighted correlation coefficient becomes the traditional Pearson's correlation coefficient.
Construction of cortical-thickness and folding correlation networks
The construction of the anatomical connection matrix is a key issue in characterizing the human brain network (Sporns et al., 2005). In this study, the anatomical connection as statistical associations in cortical anatomical properties between cortical regions was defined similarly as in the previous studies (Gong et al., 2012; Lerch et al., 2006; Worsley et al., 2005). In this way, the interregional symmetric correlation matrices (78 × 78) of cortical thickness can be constructed from 3 to 20 years of age, respectively, as shown in Fig. S1. Similarly, the correlation matrices of cortical curvedness can also be computed from 3 to 20 years of age, as shown in Fig. S2.
The above processing results in multiple 78 × 78 symmetric correlation matrices for each year. For conceptual simplicity, our present study focused on a presence/absence pattern (i.e., binary pattern) of connections. Similar to the previous studies (Achard and Bullmore, 2007; Bassett et al., 2008; Gong et al., 2012), we employed a sparsity-based thresholding approach, where the sparsity was defined as the ratio of the number of actual connections to the number of possible connections (78 × (78 − 1)/2 = 3003) within the network. Specifically, we applied the same sparsity threshold to all matrices, ensuring the same number of supra-threshold regional pairs.
To compare the similarity between the cortical-thickness and curvedness correlation networks at the same age and also the similarity between networks at different ages, we calculated the percentage of convergence (PC) via dividing the number of convergent regional pairs (Ncon) by the number of all supra-threshold regional pairs (Nsup):
| (3) |
The convergent regional pair is defined as the connections that exist in both networks. Since the same sparsity threshold is applied to both networks, the number of all supra-threshold regional pairs is identical for both networks.
Measurement of network topological properties
Previous studies have demonstrated the small-world topology of both diffusion and thickness correlation networks, characterized by highly efficient information transfer both locally and globally (Gong et al., 2009a; He et al., 2007; Iturria-Medina et al., 2008). Herein, the network global efficiency is defined as the inverse of the harmonic mean of the shortest path length (dij) between each pair of nodes within the network:
| (4) |
And the local efficiency for each node could be calculated as the global efficiency of the neighborhood subgraph Gi of the node. Then, the local efficiencies across all nodes within the network are further averaged to estimate the network local efficiency:
| (5) |
In the study of functional network, a small number of regions (hubs) with an unusually large number of connections have been identified (Eguiluz et al., 2005). Usually, the nodes with the smallest mean shortest path length, or the largest degree (number of connections to the node), were considered as the hubs of the network (Achard et al., 2006). As described in Gong et al. (2009b), to measure the connections of each node (i), the regional efficiency Er(i) is defined as:
| (6) |
Thus the regions were identified as the hubs in correlation networks if their regional efficiency was at least one standard deviation (STD) greater than the average regional efficiency of the network.
Results
The development of correlation matrices from 3 to 20 years of age
The changes of correlation matrices can directly reflect the development of different anatomical properties. The cortical-thickness and curvedness correlation matrices at different ages show similar patterns but with small difference at overall absolute correlation value as shown in Figs. S1 and S2. Both cortical-thickness and curvedness correlation matrices show the decrease of absolute correlation value over ages at most regions, which indicates that the regional difference increases during the development. However, compared to the curvedness correlation matrices, more negative correlations and higher overall absolute correlation values are found in the cortical-thickness correlation matrices. This result indicates that there might be stronger connection in the cortical-thickness correlation networks than the curvedness correlation networks.
The hemispheric asymmetry of development from 3 to 20 years of age
After obtaining the correlation matrices, the development of hemispheric asymmetry is analyzed by the correlation values between the corresponding left and right regions and its changes over time. The cortical thickness and curvedness symmetry correlation values, from 3 to 20 years of age, are mapped onto the cortical surface as shown in Figs. S3 and S4, respectively. The linear regression is also performed on the symmetry correlation values from3 to20 years of age to analyze the increasing or decreasing developmental pattern of each ROI. The linear developmental patterns of the symmetry cortical-thickness and curvedness correlation are shown in Figs. 2(a) and (b), respectively. The strong asymmetries appear at the occipital (negative correlation) and frontal lobes (with correlation value less than 0.4) at early childhood in both cortical-thickness and curvedness correlations, as shown in Fig. 2. During the adolescence and early adult phases, the corresponding thickness and curvedness symmetry correlation values become stable as shown in Figs. S3 and S4, respectively. As we can see, visual cortex shows the strong increase of symmetry in both cortical-thickness and curvedness correlations, even though strong asymmetry could be found in this area at early childhood as shown in Fig. 2. Temporal cortex also shows the similar trend of symmetry changing with the age in cortical-thickness and curvedness correlations, with the superior and middle temporal gyri decreasing symmetry and the inferior temporal gyrus increasing symmetry. Certain differences could also be found in the cortical-thickness and curvedness correlations. For example, the symmetry of cortical thickness in the frontal lobe generally increases, while the symmetry of curvedness generally decreases in this region. Compared to the curvedness, higher overall hemispheric symmetry correlation values are found in the cortical thickness.
Fig. 2.
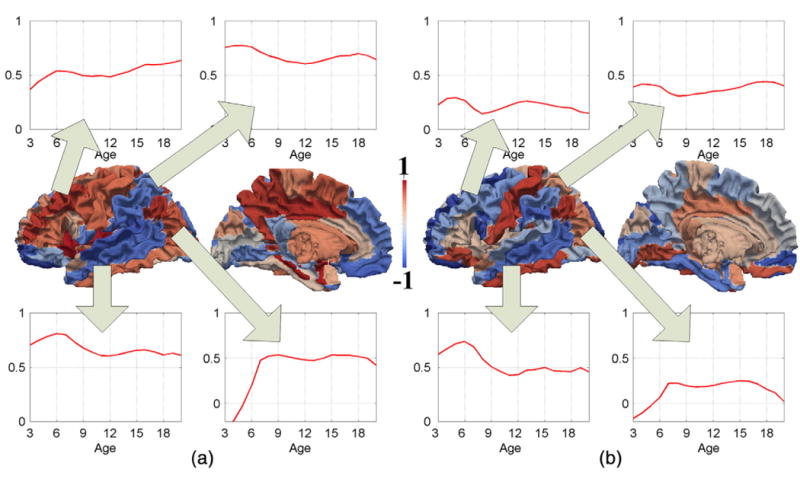
The development of the hemispheric symmetry between corresponding left and right ROIs from 3 to 20 years of age, using linear regression of correlation values (red: increase of symmetry; blue: decrease of symmetry). (a) Thickness correlation. (b) Curvedness correlation.
The cortex parcellation based on the correlations across all ages
To further analyze the developmental pattern of cortical anatomy, the affinity propagation clustering method (Frey and Dueck, 2007) is adopted to cluster ROIs into several large regions, each containing similar structural developmental patterns. Affinity propagation is a clustering algorithm that takes as input the measures of similarity between pairs of data points and simultaneously considers all data points as potential exemplars. The similarity (sij) between regions i and j in our experiment is defined as sij = (1 + rij)/2, where rij is the correlation value between regions i and j. Given the similarities, affinity propagation iteratively updates the responsibilities (qik) and availabilities (aik) between point i and the potential exemplar k by:
| (7) |
For point i, the value of k that maximizes aik + qik either identifies point i as an exemplar if k = i, or identifies the point that is the exemplar for point i. Affinity propagation can automatically determine the number of clusters based on the input preference that a data point could be chosen as an exemplar. In our experiment, the input preference sii is set as 0.3.
After clustering using affinity propagation, 8 and 5 clusters are found in the cortical-thickness and curvedness developmental patterns, respectively, as shown in Figs. 3(a) and (b). The left and right hemispheres show strong symmetry, so only left hemisphere is shown in Fig. 3. As we can see, the cortical surface is parcellated as spatially coherent clusters, although no spatial neighboring information was adopted for clustering. It is also interesting to find that both cortical-thickness and curvedness developmental patterns could be roughly distinguished by lobes, especially that pre- (motor cortex) and post-central (somatosensory cortex) gyri, which belong to the frontal and parietal lobes, respectively, are clustered into two different developing patterns. Also, the parieto-occipital sulcus that separates the parietal lobe and occipital lobe is identified as a border in the parcellation of both cortical-thickness and curvedness developmental patterns. These results indicate that there are certain essential anatomical similarities within brain lobes.
Fig. 3.
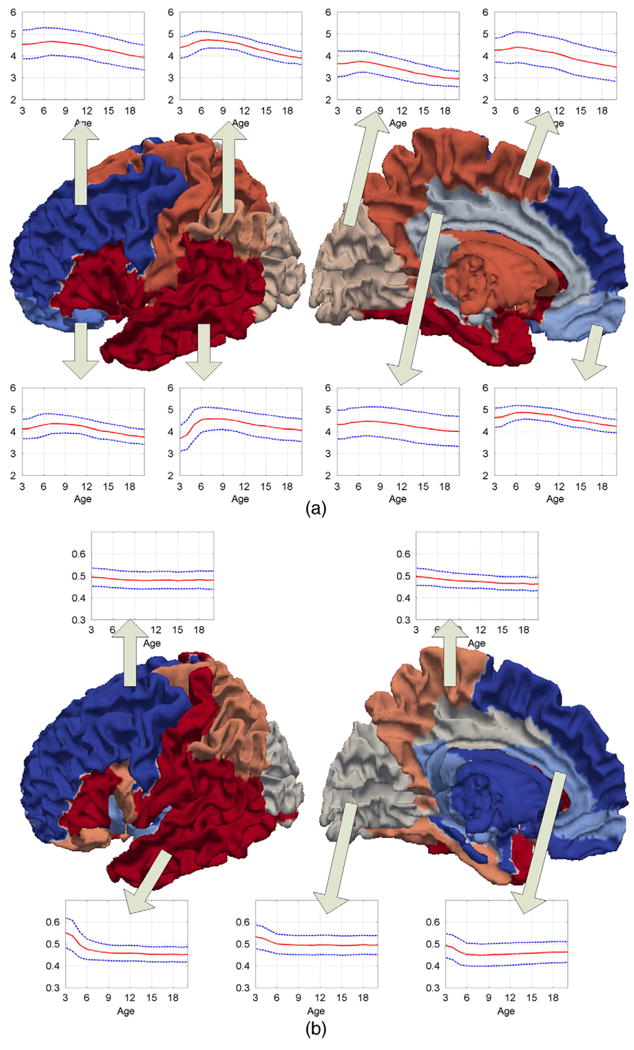
The parcellation of the cortex by the similarity of developmental patterns in ROIs. (a) Thickness correlation. (b) Curvedness correlation.
The development of the mean values and variances of cortical-thickness and curvedness at each cluster over age are also shown in Figs. 3(a) and (b), respectively. As we can see, the trajectories of average thickness in different clusters are distinct. However, they all follow an inverted U-shaped developmental course with a period of initial childhood increase and a subsequent adolescent decline. The highest average thickness value appears at around 7 years of age in all clusters, which is consistent with the observation that the total brain size reaches approximately 90% of its adult size at 6 years of age (Giedd, 2004; Reiss et al., 1996) and the total cortex volume reaches its highest value at about 7 to 8 years of age (Group, 2012). Similarly, the trajectories of cortical folding in different clusters are also distinct, with each region following an overall decreasing trajectory. The cortical folding becomes stable at 6 to 7 years of age in most regions.
The development of network topological properties
The developments of global and local efficiencies on cortical-thickness and curvedness correlation networks at each age are shown in Fig. 4 (sparsity = 0.234). The global and local efficiencies of cortical-thickness and curvedness correlation networks reach the lowest and highest values at 6 to 7 years of age, respectively. After that, the changes of the global efficiency in both cortical-thickness and curvedness correlation networks are non-significant as shown in Fig. 4(a), and the local efficiency in curvedness correlation networks slightly decreases during the brain development as shown in Fig. 4(b). This result also indicates the important change of network efficiency at 6 to 7 years of age.
Fig. 4.
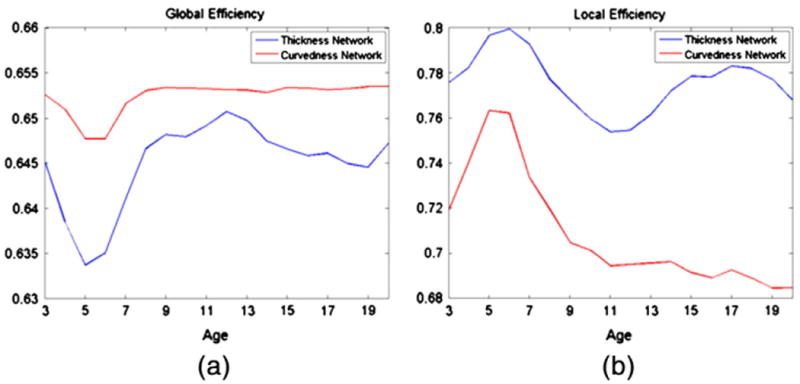
The development of global and local efficiencies on the thickness and curvedness correlation networks (sparsity = 0.234).
We also compared both global and local efficiencies between different types of correlation networks. The two correlation networks show similar global efficiency value (with difference of about 0.01) as shown in Fig. 4(a). On the other hand, the curvedness correlation networks show lower local efficiency (about 0.70 at sparsity = 0.234), compared to cortical-thickness correlation networks (about 0.76 at sparsity = 0.234), as shown in Fig. 4(b).
The convergence of networks during development
The convergence of cortical-thickness and curvedness correlation networks is shown in Fig. 5. The percentage of convergences (PC) between each age t (t = 3, …, 19) and its next age t + 1 is calculated for cortical-thickness and curvedness correlation networks, with the results shown in Fig. 5(a). As we can see, the cortical-thickness correlation networks show even higher PC value compared to the curvedness correlation networks, although both networks show high PC value (larger than 0.8). This result indicates that both network architectures remain similar during the development from early childhood to early adult, except that the change of anatomical correlation networks reach the highest level at 6 to 7 years of age as shown in Fig. 5(a).
Fig. 5.
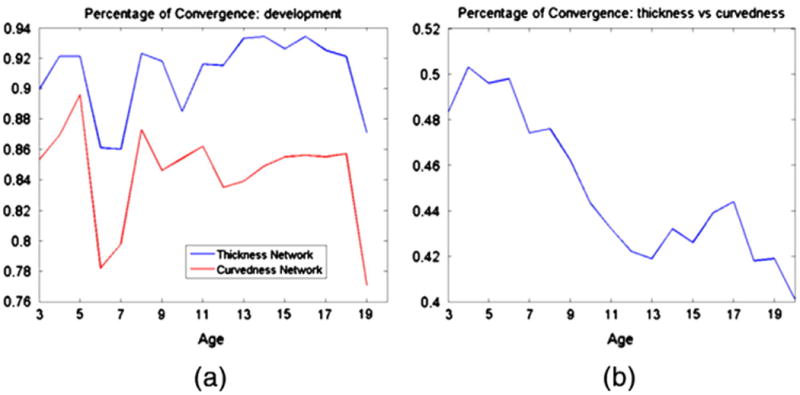
The change of percentage of convergence of the thickness and curvedness correlation networks during the development.
To further compare the difference of correlation networks, the percentage of convergence (PC) was calculated between the two correlation networks at each age, as shown in Fig. 5(b). As we can see, the PC values of the two correlation networks decrease from 7 years of age to early adult. This result indicates that the two cortical anatomical networks have different developmental patterns, especially after 7 years of age.
The development of hub regions in correlation networks
The hub regions of cortical-thickness and curvedness correlation networks from 3 to 20 years of age are shown in Figs. 6(a) and (b), respectively. Inthe cortical-thickness correlation networks, the superior and middle temporal gyri are identified as a hub region consistently duringthe development, andthe hub regionsinthe parietal lobe appear during childhood and adolescent agesasshown in Fig. 6(a). The hub regions in the temporal lobe also remain consistently in the curvedness correlation networks during the development, while the hub regions in the frontal lobes appear during early childhood and adolescent ages as shown in Fig. 6(b). By comparing the hub regions in the cortical-thickness and curvedness correlation networks, we find that the temporal lobe is consistently identified as a hub region in both cortical thickness and curvedness correlation networks at each age.
Fig. 6.
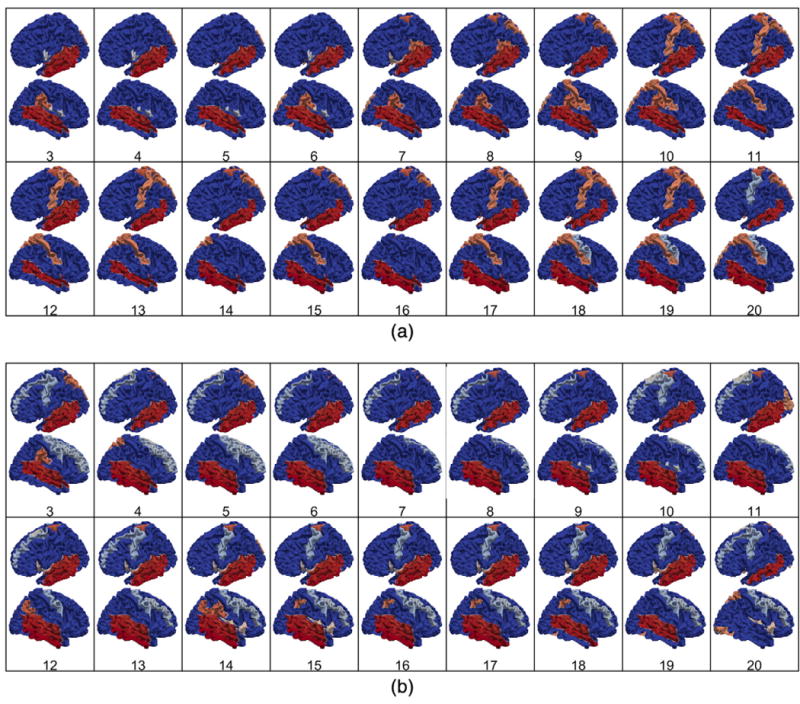
The development of hub regions in the thickness and curvedness correlation networks from 3 to 20 years of age. (a) Hub regions in the thickness correlation network, (b) hub regions in the curvedness correlation network.
Discussions
Our results show that the cortical thickness still increases at the early childhood, and starts to decrease after 7 years of age. Meanwhile, the curvedness decreases fast before 7 years of age and becomes stable after that. However, different developmental patterns could be identified in different lobes, as shown in Fig. 3. This result suggests that the development of cortical thickness is highly correlated with the development of brain functions which could also be separated by lobes. For example, the temporal lobe, which is highly related to the long term memory (Kolb and Whishaw, 2003), increases its thickness fast before 7 years of age. While the occipital lobe (visual area), which is developed earlier, has lower cortical thickness value (such as less than4 mm at the highest value) as shown in Fig. 3(a).
The cortical-thickness and curvedness correlation networks are very stable during this developmental stage. The percentage of convergence (PC) of cortical-thickness correlation networks (about 0.90) during this developmental stage is much higher than the corresponding PC at 1 to 2 years of age (about 0.5), and the percentage of convergence (PC) of curvedness correlation networks (about 0.85) during this developmental stage is also much higher than the corresponding PC at 1 to 2 years of age (about 0.65) (Wang et al., 2011). The hub regions at different ages do not change much as shown in Figs. 6(a) and (b). This result also suggests that both cortical-thickness and curvedness correlation networks are well established during these ages.
However, the PC between cortical-thickness and curvedness correlation networks increases from 3 to 6 years of age and then decreases after that, as shown in Fig. 5(b). This result suggests that the correlation networks have the similar developmental patterns in both cortical-thickness and curvedness correlation networks until the early childhood, since the cortical volume growth is the major development factor during this period, and other factors such as functional development dominate the development of anatomical correlation networks after that time.
Our result shows that the development of the cortex reaches a turning point at around 7 years of age. Although previous studies have also shown the decrease of cortical volume and thickness starting at earlier childhood (Gogtay et al., 2004; Group, 2012), our result indicates that cortical folding also starts to decrease at earlier childhood, with a similar pattern as the cortical thickness. Moreover, the brain structure network also shows the corresponding change at this age.
The reason that causes the change of the cortex development at this age needs to be further studied. For example, it might be caused by the change of synaptic pruning, or it might be related to the starting of school life. To further study this reason, longitudinal diffusion and functional MRI could be adopted to the subjects around 7 years of age for studying the change of structural and functional changes of the cortex.
These results might also provide certain useful information for further brain image analysis. For example, the cortical symmetry information might be used to guide the segmentation and registration of brain images. The changing speed of cortical thickness and folding might help decide the age interval when constructing brain atlases. For example, since the cortical thickness and folding change faster before 6 years of age (as shown in Fig. 2), the age interval for constructing brain atlases should be smaller.
The two measurements used in our study might not be stable due to the drastic changes in the cohort's age. Specifically, for the measurement of cortical thickness, the accuracy is mostly determined by tissue segmentation method. We have visually checked all the tissue segmentation and surface reconstruction results to ensure the reliability of cortical thickness. On the other hand, for the curvedness measurement, the accuracy is highly depending on the tissue segmentation and surface reconstruction methods. In our ROI-based study, we found that the coefficient of variation (standard deviation/mean value) of curvedness (8.7%) is smaller than the coefficient of variation of cortical thickness (10.7%), which means that the curvedness is more stable in the cohort's age.
Since both the cortical thickness and curvedness are not scale-invariant, certain normalization methods are adopted in this study. The linear regression analysis was performed at each cortical region across all sessions in order to remove the effects of multiple confounding variables: gender, and overall mean cortical thickness and curvedness. Thus the scale change is normalized by removing the mean change of cortical thickness and curvedness.
In this study, although we show only the development of networks calculated by a single threshold (sparsity = 0.234), we also analyzed the network with other thresholds and obtained the similar results. Since the strong correlation between two cortical regions does not necessarily mean the actual connection, the tractography method should be included to further study the development of cortical networks. Since the NIH Pediatric MRI Data Repository has released DTI datasets associated with the MRI dataset, the tractography results obtained from the corresponding DTI images could provide the “actual” connection between regions, and might further reveal the development of the relationship between the structural correlation connections and the fiber connections.
Supplementary Material
Acknowledgments
Data used in the preparation of this article were obtained from the Pediatric MRI Data Repository created by the NIH MRI Study of Normal Brain Development. This is a multi-site, longitudinal study of typically developing children, from ages newborn through young adulthood, conducted by the Brain Development Cooperative Group and supported by the National Institute of Child Health and Human Development, the National Institute on Drug Abuse, the National Institute of Mental Health, and the National Institute of Neurological Disorders and Stroke (Contract #s N01-HD02-3343, N01-MH9-0002, and N01-NS-9-2314, -2315, -2316, -2317, -2319 and -2320). A listing of the participating sites and a complete listing of the study investigators can be found at http://www.bic.mni.mcgill.ca/nihpd/info/ participating_centers.html. This manuscript reflects the views of the authors and may not reflect the opinions or views of the NIH.
This work was supported in part by NIH grants EB008374, EB006733, AG041721 and EB009634.
Footnotes
Conflict of interest statement: The authors report no biomedical financial interests or potential conflicts of interest related to this article.
Appendix A. Supplementary data: Supplementary data to this article can be found online at http://dx.doi.org/10.1016/j.neuroimage.2013.03.021.
References
- Achard S, Bullmore E. Efficiency and cost of economical brain functional networks. PLoS Comput Biol. 2007;3:174–183. doi: 10.1371/journal.pcbi.0030017. [DOI] [PMC free article] [PubMed] [Google Scholar]
- Achard S, Salvador R, Whitcher B, Suckling J, Bullmore E. A resilient, low-frequency, small-world human brain functional network with highly connected association cortical hubs. J Neurosci. 2006;26:63–72. doi: 10.1523/JNEUROSCI.3874-05.2006. [DOI] [PMC free article] [PubMed] [Google Scholar]
- Bassett D, Bullmore E, Verchinski BA, Mattay VS, Weinberger KQ, Meyer-Lindenberg A. Hierarchical organization of human cortical networks in health and schizophrenia. J Neurosci. 2008;28:9239–9248. doi: 10.1523/JNEUROSCI.1929-08.2008. [DOI] [PMC free article] [PubMed] [Google Scholar]
- Bland JM, Altman DG. Calculating correlation-coefficients with repeated observations: part 2–correlation between subjects. Br Med J. 1995;310:633–633. doi: 10.1136/bmj.310.6980.633. [DOI] [PMC free article] [PubMed] [Google Scholar]
- Bourgeois JP, Rakic P. Changes of synaptic density in the primary visual cortex of the macaque monkey from fetal to adult stage. J Neurosci. 1993;13:2801–2820. doi: 10.1523/JNEUROSCI.13-07-02801.1993. [DOI] [PMC free article] [PubMed] [Google Scholar]
- Courchesne E, Chisum HJ, Townsend J, Cowles A, Covington J, Egaas B, Harwood M, Hinds S, Press GA. Normal brain development and aging: quantitative analysis at in vivo MR imaging in healthy volunteers. Radiology. 2000;216:672–682. doi: 10.1148/radiology.216.3.r00au37672. [DOI] [PubMed] [Google Scholar]
- Eguiluz VM, Chialvo DR, Cecchi GA, Baliki M, Apkarian AV. Scale-free brain functional networks. Phys Rev Lett. 2005;94:018102. doi: 10.1103/PhysRevLett.94.018102. [DOI] [PubMed] [Google Scholar]
- Evans AC. NeuroImage. 2006. The NIH MRI study of normal brain development; pp. 30pp. 184–202. [DOI] [PubMed] [Google Scholar]
- Fischl B, Dale AM. Measuring the thickness of the human cerebral cortex from magnetic resonance images. Proc Natl Acad Sci U S A. 2000;97:11050–11055. doi: 10.1073/pnas.200033797. [DOI] [PMC free article] [PubMed] [Google Scholar]
- Frey BJ, Dueck D. Clustering by passing messages between data points. Science. 2007;315:972–976. doi: 10.1126/science.1136800. [DOI] [PubMed] [Google Scholar]
- Gao W, Gilmore JH, Giovanello KS, Smith JK, Shen D, Zhu H, Lin W. Temporal and spatial evolution of brain network topology during the first two years of life. PLoS One. 2011;6:e25278. doi: 10.1371/journal.pone.0025278. [DOI] [PMC free article] [PubMed] [Google Scholar]
- Giedd JN. Structural magnetic resonance imaging of the adolescent brain. Ann N Y Acad Sci. 2004;1021:77–85. doi: 10.1196/annals.1308.009. [DOI] [PubMed] [Google Scholar]
- Giedd JN, Rapoport JL. Structural MRI of pediatric brain development: what have we learned and where are we going? Neuron. 2010;67:728–734. doi: 10.1016/j.neuron.2010.08.040. [DOI] [PMC free article] [PubMed] [Google Scholar]
- Gogtay N, Giedd JN, Lusk L, Hayashi KM, Greenstein D, Vaituzis AC, Nugent TF, III, Herman DH, Clasen LS, Toga AW, Rapoport JL, Thompson PM. Dynamic mapping of human cortical development during childhood through early adulthood. PNAS. 2004;101:8174–8179. doi: 10.1073/pnas.0402680101. [DOI] [PMC free article] [PubMed] [Google Scholar]
- Gong G, He Y, Concha L, Lebel C, Gross DW, Evans AC, Beaulieu C. Mapping anatomical connectivity patterns of human cerebral cortex using in vivo diffusion tensor imaging tractography. Cereb Cortex. 2009a;19:524–536. doi: 10.1093/cercor/bhn102. [DOI] [PMC free article] [PubMed] [Google Scholar]
- Gong G, Rosa-Neto P, Carbonell F, Chen ZJ, He Y, Evans AC. Age- and gender-related differences in the cortical anatomical network. J Neurosci. 2009b;29:15684–15693. doi: 10.1523/JNEUROSCI.2308-09.2009. [DOI] [PMC free article] [PubMed] [Google Scholar]
- Gong G, He Y, Chen ZJ, Evans AC. Convergence and divergence of thickness correlations with diffusion connections across the human cerebral cortex. NeuroImage. 2012;59:1239–1248. doi: 10.1016/j.neuroimage.2011.08.017. [DOI] [PubMed] [Google Scholar]
- Group BDC. Total and regional brain volumes in a population-based normative sample from 4 to 18 years: the NIH MRI study of normal brain development. Cereb Cortex. 2012;22:1–12. doi: 10.1093/cercor/bhr018. [DOI] [PMC free article] [PubMed] [Google Scholar]
- He Y, Chen ZJ, Evans AC. Small-world anatomical networks in the human brain revealed by cortical thickness from MRI. Cereb Cortex. 2007;17:2407–2419. doi: 10.1093/cercor/bhl149. [DOI] [PubMed] [Google Scholar]
- Hensch TK. Critical period regulation. Annu Rev Neurosci. 2004;27:549–579. doi: 10.1146/annurev.neuro.27.070203.144327. [DOI] [PubMed] [Google Scholar]
- Huttenlocher PR, Dabholkar AS. Regional differences in synaptogenesis in human cerebral cortex. J Comp Neurol. 1997;387:167–178. doi: 10.1002/(sici)1096-9861(19971020)387:2<167::aid-cne1>3.0.co;2-z. [DOI] [PubMed] [Google Scholar]
- Iturria-Medina Y, Sotero RC, Canales-Rodriguez EJ, Aleman-Gomez Y, Melie-Garcia L. Studying the human brain anatomical network via diffusion weighted MRI and graph theory. NeuroImage. 2008;40:1064–1076. doi: 10.1016/j.neuroimage.2007.10.060. [DOI] [PubMed] [Google Scholar]
- Jones SE, Buchbinder BR, Aharon I. Three-dimensional mapping of cortical thickness using Laplace's equation. Hum Brain Mapp. 2000;11:12–32. doi: 10.1002/1097-0193(200009)11:1<12::AID-HBM20>3.0.CO;2-K. [DOI] [PMC free article] [PubMed] [Google Scholar]
- Kennedy DN, Makris N, Herbert MR, Takahashi T, Caviness VS. Basic principles of MRI and morphometry studies of human brain development. Dev Sci. 2002;5:268–278. [Google Scholar]
- Kim JS, Singh V, Lee JK, Lerch J, Ad-Dab'bagh Y, MacDonald D, Lee JM, Kim SI, Evans AC. Automated 3-D extraction and evaluation of the inner and outer cortical surfaces using a Laplacian map and partial volume effect classification. NeuroImage. 2005;27:210–221. doi: 10.1016/j.neuroimage.2005.03.036. [DOI] [PubMed] [Google Scholar]
- Knudsen EI. Sensitive periods in the development of the brain and behavior. J Cogn Neurosci. 2004;16:1412–1425. doi: 10.1162/0898929042304796. [DOI] [PubMed] [Google Scholar]
- Koenderink JJ, Vandoorn AJ. Surface shape and curvature scales. Image Vis Comput. 1992;10:557–564. [Google Scholar]
- Kolb B, Whishaw IQ. Fundamentals of Human Neuropsychology. Worth Publishers; 2003. [Google Scholar]
- Lerch JP, Worsley K, Shaw WP, Greenstein DK, Lenroot RK, Giedd J, Evans AC. Mapping anatomical correlations across cerebral cortex (MACACC) using cortical thickness from MRI. NeuroImage. 2006;31:993–1003. doi: 10.1016/j.neuroimage.2006.01.042. [DOI] [PubMed] [Google Scholar]
- Li G, Nie J, Wu G, Wang Y, Shen D ADNI. Consistent reconstruction of cortical surfaces from longitudinal brain MR images. NeuroImage. 2012;59:3805–3820. doi: 10.1016/j.neuroimage.2011.11.012. [DOI] [PMC free article] [PubMed] [Google Scholar]
- Liu T, Shen D, Davatzikos C. Deformable registration of cortical structures via hybrid volumetric and surface warping. NeuroImage. 2004;22:1790–1801. doi: 10.1016/j.neuroimage.2004.04.020. [DOI] [PubMed] [Google Scholar]
- Liu T, Nie J, Tarokh A, Guo L, Wong ST. Reconstruction of central cortical surface from brain MRI images: method and application. NeuroImage. 2008;40:991–1002. doi: 10.1016/j.neuroimage.2007.12.027. [DOI] [PMC free article] [PubMed] [Google Scholar]
- Micheloyannis S, Pachou E, Stam CJ, Vourkas M, Erimaki S, Tsirka V. Using graph theoretical analysis of multi channel EEG to evaluate the neural efficiency hypothesis. Neurosci Lett. 2006;402:273–277. doi: 10.1016/j.neulet.2006.04.006. [DOI] [PubMed] [Google Scholar]
- Nie J, Li G, Wang L, Gilmore JH, Lin W, Shen D. A computational growth model for measuring dynamic cortical development in the first year of life. Cereb Cortex. 2012;22:2272–2284. doi: 10.1093/cercor/bhr293. [DOI] [PMC free article] [PubMed] [Google Scholar]
- Pfefferbaum A, Mathalon DH, Sullivan EV, Rawles JM, Zipursky RB, Lim KO. A quantitative magnetic resonance imaging study of changes in brain morphology from infancy to late adulthood. Arch Neurol. 1994;51:874–887. doi: 10.1001/archneur.1994.00540210046012. [DOI] [PubMed] [Google Scholar]
- Raznahan A, Lerch JP, Lee N, Greenstein D, Wallace GL, Stockman M, Clasen L, Shaw PW, Giedd JN. Patterns of coordinated anatomical change in human cortical development: a longitudinal neuroimaging study of maturational coupling. Neuron. 2011;72:873–884. doi: 10.1016/j.neuron.2011.09.028. [DOI] [PMC free article] [PubMed] [Google Scholar]
- Reiss AL, Abrams MT, Singer HS, Ross JL, Denckla MB. Brain development, gender and IQ in children, a volumetric imaging study. Brain. 1996;119(Pt5):1763–1774. doi: 10.1093/brain/119.5.1763. [DOI] [PubMed] [Google Scholar]
- Rodriguez-Carranza CE, Mukherjee P, Vigneron D, Barkovich J, Studholme C. Comparing 3D Gyrification Index and area-independent curvature-based measures in quantifying neonatal brain folding. Proc SPIE. 2007;6512:65120N. [Google Scholar]
- Salvador R, Suckling J, Coleman MR, Pickard JD, Menon D, Bullmore E. Neurophysiological architecture of functional magnetic resonance images of human brain. Cereb Cortex. 2005;15:1332–1342. doi: 10.1093/cercor/bhi016. [DOI] [PubMed] [Google Scholar]
- Schlaggar BL, Brown TT, Lugar HM, Visscher KM, Miezin FM, Petersen SE. Functional neuroanatomical differences between adults and school-age children in the processing of single words. Science. 2002;296:1476–1479. doi: 10.1126/science.1069464. [DOI] [PubMed] [Google Scholar]
- Shaw P, Kabani NJ, Lerch JP, Eckstrand K, Lenroot R, Gogtay N, Greenstein D, Clasen L, Evans A, Rapoport JL, Giedd JN, Wise SP. Neurodevelopmental trajectories of the human cerebral cortex. J Neurosci. 2008;28:3586–3594. doi: 10.1523/JNEUROSCI.5309-07.2008. [DOI] [PMC free article] [PubMed] [Google Scholar]
- Shen D, Davatzikos C. HAMMER: Heirarchical Attribute Matching Mechanism for Elastic Registration. IEEE Trans Med Imaging. 2002;21:1421–1439. doi: 10.1109/TMI.2002.803111. [DOI] [PubMed] [Google Scholar]
- Smith SM. Fast robust automated brain extraction. Hum Brain Mapp. 2002;17:143–155. doi: 10.1002/hbm.10062. [DOI] [PMC free article] [PubMed] [Google Scholar]
- Sowell ER, Thompson PM, Leonard CM, Welcome SE, Kan E, Toga AW. Longitudinal mapping of cortical thickness and brain growth in normal children. J Neurosci. 2004;24:8223–8231. doi: 10.1523/JNEUROSCI.1798-04.2004. [DOI] [PMC free article] [PubMed] [Google Scholar]
- Sporns O, Chialvo DR, Kaiser M, Hilgetag CC. Organization, development and function of complex brain networks. Trends Cogn Sci. 2004;8:418–425. doi: 10.1016/j.tics.2004.07.008. [DOI] [PubMed] [Google Scholar]
- Sporns O, Tononi G, Kotter R. The human connectome: a structural description of the human brain. PLoS Comput Biol. 2005;1:e42. doi: 10.1371/journal.pcbi.0010042. [DOI] [PMC free article] [PubMed] [Google Scholar]
- Stam CJ. Functional connectivity patterns of human magnetoencephalographic recordings: a ‘small-world’ network? Neurosci Lett. 2004;355:25–28. doi: 10.1016/j.neulet.2003.10.063. [DOI] [PubMed] [Google Scholar]
- Stam CJ, Jones BF, Nolte G, Breakspear M, Scheltens P. Small-world networks and functional connectivity in Alzheimer's disease. Cereb Cortex. 2007;17:92–99. doi: 10.1093/cercor/bhj127. [DOI] [PubMed] [Google Scholar]
- Stiles J. Neural plasticity and cognitive development. Dev Neuropsychol. 2000;18:237–272. doi: 10.1207/S15326942DN1802_5. [DOI] [PubMed] [Google Scholar]
- Tzourio-Mazoyer N, Landeau B, Papathanassiou D, Crivello F, Etard O, Delcroix N, Mazoyer B, Joliot M. Automated anatomical labeling of activations in SPM using a macroscopic anatomical parcellation of the MNI MRI single-subject brain. NeuroImage. 2002;15:273–289. doi: 10.1006/nimg.2001.0978. [DOI] [PubMed] [Google Scholar]
- Waber DP, De Moor C, Forbes PW, Almli CR, Botteron KN, Leonard G, Milovan D, Paus T, Rumsey J. The NIH MRI study of normal brain development: performance of a population based sample of healthy children aged 6 to 18 years on a neuropsychological battery. J Int Neuropsychol Soc. 2007;13:729–746. doi: 10.1017/S1355617707070841. [DOI] [PubMed] [Google Scholar]
- Wang L, Shi F, Yap PT, Gilmore JH, Lin W, Shen D. Accurate and consistent 4D segmentation of serial infant brain MR images. LNCS. 2011;2011(2712):93–101. [Google Scholar]
- Watts DJ, Strogatz SH. Collective dynamics of‘small-world’ networks. Nature. 1998;393:440–442. doi: 10.1038/30918. [DOI] [PubMed] [Google Scholar]
- Worsley KJ, Chen JI, Lerch J, Evans AC. Comparing functional connectivity via thresholding correlations and singular value decomposition. Philos Trans R Soc Lond B Biol Sci. 2005;360:913–920. doi: 10.1098/rstb.2005.1637. [DOI] [PMC free article] [PubMed] [Google Scholar]
- Zhang Y, Brady M, Smith S. Segmentation of brain MR images through a hidden Markov random field model and the expectation maximization algorithm. IEEE Trans Med Imaging. 2001;20:45–57. doi: 10.1109/42.906424. [DOI] [PubMed] [Google Scholar]
Associated Data
This section collects any data citations, data availability statements, or supplementary materials included in this article.