

Abstract
Even though cellular volume dynamics has been linked to cell apoptosis and intrinsic optical signals, there is no quantitative model for describing neuronal volume dynamics on the millisecond time scale. This study introduces a multiphysics neuron model, where the cell volume is a time-varying variable and multiple physical principles are combined to build governing equations. Using this model, we analyzed neuronal volume responses during excitation, which elucidated the variety of optical signals observed experimentally across the literature. Several physiological conditions were examined to investigate their effect on the pattern of volume response. In addition, we analyzed volume responses on a longer time scale with repetitive stimulation to study the characteristics of slow cell swelling. This multiscale analysis of the multiphysics model will provide not only a novel quantitative elucidation of physiologically important issues related with cellular volume dynamics but also a chance for further studies, such as the interesting possibility of inferring the balance of ion flux from plateau volume changes.
Index Terms: Biological cells, biological system modeling, cellular biophysics, physiology
I. Introduction
Quantitative analysis of neuronal volume dynamics would be helpful in addressing a range of physiological issues. A number of studies have hypothesized, for example, that fast (millisecond time scale) intrinsic optical signals of neural activity might be attributed, at least partially, to a change in the cellular volume due to excitation of the neuron [1]–[5]. In addition, we have seen growing interest in the role of excessive excitation-oriented cellular volume changes in cell apoptosis [6], [7].
Thus far, however, neuronal volume dynamics on the millisecond time scale have only been discussed qualitatively, despite the publication of several modeling studies [8]–[10]. Such qualitative discussion does not provide sufficient elucidation of the observed variation in the shape of optical signals across studies [1]–[5]. For this reason, this study introduces a multiphysics neuron model to describe how the intracellular ion concentration and the cellular volume vary in time during excitation. At the same time, it explores how physiological conditions, such as the initial cell size and stimulation current, affect the neuronal volume response and produce a variety of response patterns.
In addition to the short time-scale volume dynamics, this paper also studies long-time-scale (up to 1 min) neuronal volume responses arising from repetitive stimulation. It is well established that repetitive stimulation causes slow cell swelling [11], [12]. Also, several investigators have hypothesized that changes in the optical transmittance of neural tissue were mainly related to cellular volume changes [11]–[14]. Hence, this study uses the multiphysics neuron model to analyze the pattern of long-time-scale volume responses.
This multiscale analysis of neuronal volume dynamics, based on the multiphysics model, will provide a novel quantitative elucidation of the wide variety of cellular volume changes reported in the literature.
II. Multiphysics Neuron Model
The Hodgkin–Huxley (H-H) model describes how a membrane current causes a change in the membrane potential and, thus, initiates the action potential in neurons [15]. The H-H model, however, cannot describe how the cellular volume varies during neuronal excitation because it deals with the volume as a constant quantity. It is natural to assume that the volume will vary during the excitation because the excitation is accompanied by ion flux, producing a change in the total intracellular concentration, and the concentration change will make water molecules diffuse through the membrane, thus causing a change in the cellular volume. Such a volume change during excitation has also been observed experimentally [17].
Here, we introduced the cell volume and intracellular sodium and potassium concentrations as time-varying variables and, then, employed multiple physical principles to couple variables (see Fig. 1). For example, the intracellular ion amount and the membrane ion current were coupled with the continuity equation of charge conservation. As a result, we derived coupled nonlinear differential equations of seven independent variables. A detailed derivation of these equations was presented in [5]:
| (1) |
where the first two equations were adopted from the H-H model; Ψ(t) is the gating probability of n, m, and h subunits of ion channels; αΨ and βΨ are the transition rates between the open and closed states of the subunit Ψ; Vm(t) is the membrane potential; cm is the membrane capacitance per unit area (1×10⁻³ F·m−2); Im(t) is the membrane current (the stimulation current in this study); am is the surface area of the cell; is the maximum conductance of the potassium channel (360 S·m−2); is the maximum conductance of the sodium channel (1200 S·m−2); EΩ is the equilibrium potential of the potassium/sodium (Ω is the species of ion; Ω = Na, K) channels depending on the ion concentration (baseline values are −0.077 and 0.050 V, respectively); gL is the conductance of a passive leakage current at resting state (3 S·m−2); and EL is the equilibrium potential for the passive leakage (−0.0544 V); and are the intracellular amounts of potassium and sodium ions, respectively, in the unit of moles; v(t) is the cell volume; and
Fig. 1.

Diagram of our neuron model: time-varying variables and the physical principles connecting them. In addition to the H-H model (indicated in gray), we employed multiple physical principles, such as conservation theory, diffusion theory, and electrochemical equilibrium, to couple newly introduced time-varying variables, such as the intracellular ion concentration and the cell volume.
are active potassium and sodium ion transfers produced by the sodium–potassium pump of the neuron membrane; DH2O is the diffusion coefficient of water molecules (10−10 m2 ·s−1); dm is the thickness of the cellular membrane (10−9 m); is the ordinary water density (5.56 × 10⁴ mol·m−3); and T is the room temperature (300 K). NA, e, R, z, and F are fundamental physical constants: the Avogadro’s number, the charge of a single electron, the universal gas constant, the valence of sodium and potassium ions, and the Faraday constant, respectively. We used equations from the literature for the voltage-dependent transition rates αΨ(Vm) and βΨ(Vm) [16].
III. Multiscale Analysis of Volume Dynamics
A. Short-Time-Scale Neuronal Volume Response for Single Stimulation
We used the Euler method to numerically solve the governing equation of neuronal volume dynamics (1). The solutions showed that the membrane potential exhibited behavior typical of action potentials (see Fig. 2, top), confirming that our model performs the basic function of a neuron model.
Fig. 2.

Representative numerical solutions of our neuron model. (A)–(D) Total (Na+K) intracellular concentration and the cell volume, as well as the membrane potential, varied during excitation. The duration of stimulation was 1 ms, and the initial cell diameter was 10 μm. The vertical gray lines indicate the moment of stimulation. (E) Various shapes of the optical signals observed experimentally in the literature are very similar to our calculated cellular volume responses. Data were extracted from the literature (left and center from [1], and right from [2]). All horizontal scale bars indicate 10 ms.
The solutions also described the dynamics of the intracellular concentration and the cell volume (see Fig. 2, middle and bottom). As expected, the stimulation current led to an initial sodium influx, which initially increased the total intracellular concentration, followed by a total concentration decrease due to the later potassium efflux. These concentration changes led to a change in the cellular volume.
The neuronal volume dynamics exhibited three different patterns during excitation, as shown in Fig. 2(B)–(D). These physiological condition-dependent patterns may shed light on the variety of optical neural signals reported in the literature. The pattern in Fig. 2(C) (pattern C) is common in optical signals measured in [1], [3]–[5] (see, e.g., Fig. 2(E), center), while the patterns in Fig. 2(B) and (D) (patterns B and D, respectively) are quite similar to the optical signals presented in [1], [2] (see, e.g., Fig. 2(E), left and right). Although some discrepancies between simulation and measurement were observed in the time constant of volume dynamics, the general shape matched quite well in the three cases. Those discrepancies might be attributed to differences in the cell size, cell morphology, and membrane properties between our simulation and real measurement in the literature.
To investigate how physiological conditions are related to each pattern, we examined various stimulation current amplitudes, stimulation durations, and initial cell sizes. The volume response was categorized as one of the three patterns according to the relationship between its peak and the plateau volume changes (pattern B when the plateau > 1/2 peak; pattern D when the plateau < –peak, otherwise pattern C). These three patterns were distributed in the parameter space as shown in Fig. 3(A).
Fig. 3.

Analysis of neuronal volume responses for a single stimulation. (A) Distribution of volume response patterns in the parameter space. Green, blue, and red colors indicate the patterns B, C, and D, respectively. Only points where an action potential was fired are presented. (B) Distribution of the volume response patterns for four selected initial cell diameters. (C) Peak and plateau volume changes as a function of the injected charge density. The color represents the initial cell size, ranging from 10 (cyan) to 25 μm (magenta). (D) Distribution of volume response patterns in the parameter space of the charge density and the cell size. The dashed line b indicates the threshold of action potential firing. The dashed lines c and d indicate the boundaries among the patterns B (green), C (blue), and D (red).
From four slices of the 3-D pattern distribution [see Fig. 3(B)], we found that the boundary between adjacent patterns was close to the curve of (amplitude) × (duration) = constant, which implies that the total injected charge, i.e., (amplitude) × (duration), is more directly related to the volume response. In addition, the identical amount of injected charge worked as a larger stimulation when applied to a smaller cell, more likely resulting in the pattern D as a result. This analysis led us to consider a new parameter: a total injected charge per cell unit area, i.e., (charge density) = (amplitude) × (duration)/(cell area).
The use of this parameter helped to reveal tendencies underlying the volume response [see Fig. 3(C)]: the peak volume change was negatively correlated with the initial cell size and the plateau volume was negatively correlated with the injected charge density. Furthermore, the use of the charge density simplified the classification of volume response patterns, as can be seen in Fig. 3(D). According to our results, the peak volume change was larger in smaller cells, and the pattern C occurred more frequently than other patterns under reasonable physiological conditions.
B. Long-Time-Scale Neuronal Volume Response for Repetitive Stimulation
We solved (1) for repetitive stimulation on a larger time scale (up to 1 min). For two selected stimulation amplitudes, the cell volume showed long-term responses (see Fig. 4(A), top) that were similar to experimentally measured slow cell swelling [12]. In addition, the zoomed response for the first 1 s (see Fig. 4(A), middle) exhibited different patterns of the optical signals observed in the literature [13], [14].
Fig. 4.

Large-time-scale neuronal volume responses for repetitive stimulation. (A) Cellular volume change and membrane potential for two selected stimulation amplitudes. Top traces show the cell volume change during 1 min, while middle and bottom traces show the cell volume and membrane potential changes during the first 1 s. The stimulation was applied at 20 Hz for 20 s (the thick horizontal bar). (B) Behavior of the volume response in the parameter space of the stimulation amplitude and frequency. The maximum volume change with its sign (top) and the average slope of the volume change for the first 1 s (bottom) are presented. The color represents the stimulation frequency, ranging from 5 (blue) to 50 Hz (red). The dashed line a indicates the threshold current for inducing long-term volume responses. In the region between the dashed lines b and c, the maximum change was larger than zero even though the initial slope was negative. The initial cell diameter and the current pulse width were fixed at 10 μm and 1 ms, respectively.
To investigate which physiological conditions affect the pattern of the slow volume response, we obtained volume responses for various stimulation current amplitudes and stimulation frequencies [see Fig. 4(B)]. The maximum volume change was larger when the stimulation frequency was higher and the stimulation amplitude was close to the threshold. Interestingly, we noted that, for suprathreshold stimulation, the maximum volume change was smaller for larger stimulation. This tendency is probably related to the behavior of the short-time-scale response [see Fig. 3(C)].
It was also interesting to observe a specific region of the stimulation amplitude, where the maximum volume change was larger than zero even though the initial slope of the volume change was negative [the region between the dashed lines b and c in Fig. 4(B)]. An example of this tendency can be seen in Fig. 4(A). In addition, while the slope of the volume change decreased during the repetitive stimulation of 30 pA, the slope increased during the stimulation when 70-pA currents were applied. This means that the second-order time derivative of the volume response can vary with the stimulation amplitude. The origin of this relationship requires further study.
IV. Discussion and Conclusion
The plateau volume in the short time scale decreased when the stimulation was too large [see Figs. 2(D) and 3(C)]. Based on the process of the action-potential initiation described in Fig. 5, the volume initially increases due to the increase in the sodium concentration and later decreases due to the decrease in the potassium concentration. Hence, the short-time-scale plateau volume is related to the balance between the total change in the sodium and potassium concentrations (specifically, the time integral of each change). In this context, a larger stimulation current initially raises the membrane potential so much that the positive feedback (line a in Fig. 5) mediated initial sodium influx becomes smaller, thus resulting in a smaller increase in the sodium concentration. Also, the later potassium efflux is less affected by the stimulation current. Therefore, this imbalance between the two ion concentrations may lead to the decrease in the short–time-scale plateau volume and may also influence the behavior of the long-time-scale volume response. This modeling result suggests the interesting possibility of inferring the balance of sodium influx and potassium efflux from the plateau volume change. This possibility could be tested with experiments, where multiple patch clamps and a high-resolution optical microscope are employed. Although other membrane currents may have an effect on the prediction—our model only accounts for sodium and potassium currents—we believe that the two currents play a dominant role in the millisecond scale neuronal volume dynamics because the inward calcium current and most of the other membrane currents are much slower than the sodium and potassium currents in most types of neurons.
Fig. 5.
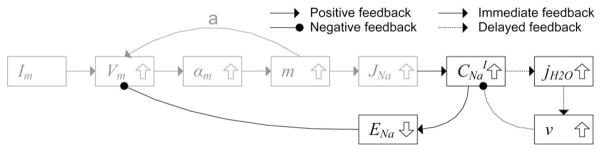
Positive and negative feedbacks among variables during initiation of the action potential. The stimulation current increases the membrane potential, as well as the transition rate and the permeability of the sodium channel, while the increased sodium channel conductivity further raises the membrane potential (positive feedback), thus initiating the action potential. Our model suggests that the increased sodium current raises the intracellular sodium concentration and decreases the equilibrium potential of the sodium ion channel, while the decreased equilibrium potential inhibits the increase of membrane potential (negative feedback), thus suppressing the initiation of the action potential. This is why the threshold was slightly higher in our model than in the H-H model. The negative feedback of the volume to the ion concentration occurs with a time delay due to the finite water diffusion speed. Gray color indicates variables and feedbacks from the H-H model.
In conclusion, this study introduces a multiphysics neuron model for quantitative description of cellular volume dynamics during neural activation. We analyzed the neuronal volume response in both short (millisecond) and long (up to 1 min) time scales. The results categorized the volume responses into three patterns, which reproduced the variety of optical signals experimentally observed in the literature. Our multiphysics model and its multiscale analysis provide insight into neuronal volume dynamics and its dependence on physiological conditions.
Acknowledgments
This work was supported in part by the U.S. National Institutes of Health under Grant R01NS057476, by the Ministry of Education, Science and Technology of Korea under the Pioneer Project 20110001662, and by the Korea Health 21 R&D Project under Grant A084359.
Footnotes
Color versions of one or more of the figures in this paper are available online at http://ieeexplore.ieee.org.
Contributor Information
Jonghwan Lee, Email: jonghwan@nmr.mgh.harvard.edu, Martinos Center for Biomedical Imaging, Massachusetts General Hospital, Harvard Medical School, Charlestown, MA 02129 USA.
David A. Boas, Email: dboas@nmr.mgh.harvard.edu, Martinos Center for Biomedical Imaging, Massachusetts General Hospital, Harvard Medical School, Charlestown, MA 02129 USA
Sung June Kim, Email: kimsj@snu.ac.kr, School of Electrical Engineering and Computer Science, and the Interuniversity Semiconductor Research Center, Seoul National University, Seoul 151 742, Korea.
References
- 1.Tasaki I, Watanabe A, Sandlin R, Carnay L. Changes in fluorescence, turbidity, and birefringence associated with nerve excitation. Proc Nat Acad Sci USA. 1968;61:883–888. doi: 10.1073/pnas.61.3.883. [DOI] [PMC free article] [PubMed] [Google Scholar]
- 2.Cohen LB. Changes in neuron structure during action potential propagation and synaptic transmission. Physiol Rev. 1973;53:373–418. doi: 10.1152/physrev.1973.53.2.373. [DOI] [PubMed] [Google Scholar]
- 3.Yao XC, Foust A, Rector DM, Barrowes B, George JS. Cross-polarized reflected light measurement of fast optical responses associated with neural activation. Biophys J. 2005;88:4170–4177. doi: 10.1529/biophysj.104.052506. [DOI] [PMC free article] [PubMed] [Google Scholar]
- 4.Akkin T, Joo C, de Boer JF. Depth-resolved measurement of transient structural changes during action potential propagation. Biophys J. 2007;93:1347–1353. doi: 10.1529/biophysj.106.091298. [DOI] [PMC free article] [PubMed] [Google Scholar]
- 5.Lee J, Kim SJ. Spectrum measurement of fast optical signal of neural activity in brain tissue and its theoretical origin. Neuroimage. 2010;51:713–722. doi: 10.1016/j.neuroimage.2010.02.076. [DOI] [PubMed] [Google Scholar]
- 6.Pelletier MR, Wadia JS, Mills LR, Carlen PL. Seizure-induced cell death produced by repeated tetanic stimulation in vitro: Possible role of endoplasmic reticulum calcium stores. J Neurophysiol. 1999;81:3054–3064. doi: 10.1152/jn.1999.81.6.3054. [DOI] [PubMed] [Google Scholar]
- 7.Bellizzi MJ, Shao-Ming L, Masliah E, Gelbard HA. Synaptic activity becomes excitotoxic in neurons exposed to elevated levels of platelet-activating factor. J Clin, Invest. 2005;115:3185–3192. doi: 10.1172/JCI25444. [DOI] [PMC free article] [PubMed] [Google Scholar]
- 8.Cressman J, Ullah G, Ziburkus J, Schiff S, Barreto E. The influence of sodium and potassium dynamics on excitability, seizures, and the stability of persistent states: I. Single neuron dynamics. J Comp Neurosci. 2009;26:159–170. doi: 10.1007/s10827-008-0132-4. [DOI] [PMC free article] [PubMed] [Google Scholar]
- 9.Kager H, Wadman WJ, Somjen GG. Conditions for the triggering of spreading depression studied with computer simulations. J Neurophysiol. 2002;88:2700–2712. doi: 10.1152/jn.00237.2002. [DOI] [PubMed] [Google Scholar]
- 10.Frohlich F, Sejnowski TJ, Bazhenov M. Network bistability mediates spontaneous transitions between normal and pathological brain states. J Neurosci. 2010;30:10734–10743. doi: 10.1523/JNEUROSCI.1239-10.2010. [DOI] [PMC free article] [PubMed] [Google Scholar]
- 11.MacVicar B, Hochman D. Imaging of synaptically evoked intrinsic optical signals in hippocampal slices. J Neurosci. 1991;11:1458–1469. doi: 10.1523/JNEUROSCI.11-05-01458.1991. [DOI] [PMC free article] [PubMed] [Google Scholar]
- 12.Syková E, Vargová Lý, Kubinová S, Jendelová P, Chvátal A. The relationship between changes in intrinsic optical signals and cell swelling in rat spinal cord slices. Neuroimage. 2003;18:214–230. doi: 10.1016/s1053-8119(02)00014-9. [DOI] [PubMed] [Google Scholar]
- 13.Salzberg BM, Obaid AL, Gainer H. Large and rapid changes in light scattering accompany secretion by nerve terminals in the mammalian neurohypophysis. J Gen Physiol. 1985;86:395–411. doi: 10.1085/jgp.86.3.395. [DOI] [PMC free article] [PubMed] [Google Scholar]
- 14.Watanabe A, Terakawa S. Alteration of birefringence signals from squid giant axons by intracellular perfusion with protease solution. Biochim Biophys Acta. 1976;436:833–842. doi: 10.1016/0005-2736(76)90410-7. [DOI] [PubMed] [Google Scholar]
- 15.Hodgkin AL, Huxley AF. A quantitative description of membrane current and its application to conduction and excitation in nerve. J Physiol. 1952;117:500–544. doi: 10.1113/jphysiol.1952.sp004764. [DOI] [PMC free article] [PubMed] [Google Scholar]
- 16.Dayan P, Abbott LF. Theoretical Neuroscience: Computational and Mathematical Modeling of Neural Systems. ch 5 Cambridge, MA: MIT Press; 2001. [Google Scholar]
- 17.Tasaki I, Byrne PM. Rapid structural chances in nerve fibers evoked by electric current pulses. Biochem Biophys Res Commun. 1992;188:559–564. doi: 10.1016/0006-291x(92)91092-5. [DOI] [PubMed] [Google Scholar]