

Abstract
Cell identity is determined by its gene expression programs. The ability of a cell to change its identity and produce cell types outside its lineage is achieved by the activity of transcription controllers capable of reprogramming differentiation gene networks. The synovial sarcoma (SS)-associated protein, SYT–SSX2, reprograms myogenic progenitors and human bone marrow-derived mesenchymal stem cells (BMMSCs) by dictating their commitment to a pro-neural lineage. It fulfills this function by directly targeting an extensive array of neural-specific genes as well as genes of developmental pathway mediators. Concomitantly, the ability of both myoblasts and BMMSCs to differentiate into their normal myogenic and adipogenic lineages was compromised. SS is believed to arise in mesenchymal stem cells where formation of the t(X/18) translocation product, SYT–SSX, constitutes the primary event in the cancer. SYT–SSX is therefore believed to initiate tumorigenesis in its target stem cell. The data presented here allow a glimpse at the initial events that likely occur when SYT–SSX2 is first expressed, and its dominant function in subverting the nuclear program of the stem cell, leading to its aberrant differentiation, as a first step toward transformation. In addition, we identified the fibroblast growth factor receptor gene, Fgfr2, as one occupied and upregulated by SYT–SSX2. Knockdown of FGFR2 in both BMMSCs and SS cells abrogated their growth and attenuated their neural phenotype. These results support the notion that the SYT–SSX2 nuclear function and differentiation effects are conserved throughout sarcoma development and are required for its maintenance beyond the initial phase. They also provide the stem cell regulator, FGFR2, as a promising candidate target for future SS therapy.
Keywords: Cancer, differentiation, gene expression
Introduction
Synovial sarcoma (SS) is an aggressive malignancy that afflicts adolescents and young adults. It is characterized by a recurrent chromosomal translocation t(X;18) where the SYT gene (also known as SS18) on chromosome-18 is fused with the SSX1, SSX2 or (in a few cases) SSX4 genes on the X chromosome, forming the SYT–SSX oncogene. The translocation protein is thought to regulate gene expression, however its mechanism of action and the resulting phenotypic consequences are still largely unclear (Ladanyi, 2001).
Binding of the SYT portion to the SWI/SNF chromatin-remodeling complex (Nagai et al., 2001) and direct association of the SSX segment with components of Polycomb (Barco et al., 2009) are considered at least partially responsible for its role in transcriptional regulation. SWI/SNF complexes may either activate or repress transcription, whereas Polycomb complexes silence genes through chromatin modification and compaction (Martens and Winston, 2003; Schuettengruber et al., 2007). As the SWI/SNF and Polycomb complexes are major regulators of differentiation-specific genes in development (Schuettengruber et al., 2007), it can be anticipated that such genes would be targeted by SYT–SSX, resulting either in their aberrant activation or repression, leading to tumorigenesis (Lubieniecka et al., 2008; Barco et al., 2009). Indeed the participation of developmental mediators in tumor formation and maintenance has been well-documented (Lobo et al., 2007). By nature of its interacting proteins, SYT–SSX is poised to mediate tumorigenesis through the transcriptional deregulation of developmental programs, however support for this hypothesis is lacking at the molecular level. The identities of SYT–SSX target genes are mostly unknown, and because SYT–SSX has no DNA-binding domain, the mechanism of its recruitment to specific loci is also unclear. Solving these questions will not only provide a deeper understanding of the nuclear function of SYT–SSX, but also illuminate potential therapeutic interventions for the treatment of SS.
Recently, a stem cell origin for SS was reported (Naka et al., 2010). In those studies, SYT–SSX silencing in SS cells permitted their differentiation into multiple mesenchymal lineages, supporting the hypothesis that SS arises in multipotent stem cells. Deregulation of normal differentiation driven by SYT–SSX is therefore believed to be the basis for multipotent stem cell transformation that leads to cancer development (Naka et al., 2010). However, it remains to be determined how SYT–SSX expression in normal somatic stem cells affects their differentiation. It will also be interesting to investigate if SYT–SSX expression results in the acquisition of additional features that influence tumor progression and behavior.
Here we report that the SS-associated protein, SYT–SSX2, reprograms mesenchymal progenitor and stem cells by dictating their lineage commitment. Expression of SYT–SSX2 results in the activation of a pro-neural program, while altering normal differentiation, in both murine myoblasts and human bone marrow-derived mesenchymal stem cells (BMMSCs). This programming was due to the occupancy of an extensive number of genes involved in neural differentiation and function by the SYT–SSX2 nuclear complex. Moreover, SYT–SSX2 appeared to target the network that controls stem cell lineage commitment and differentiation, resulting in autocrine signaling. One such direct target is the fibroblast growth factor receptor (Fgfr2) gene, whose activation, we believe, contributes to the differentiation effects driven by SYT–SSX2 in the mesenchymal stem/progenitor cells and which appear to be occurring in the SS tumor cells as well.
Stem cell differentiation is tightly controlled and its deregulation leads to disease formation. The SYT–SSX translocation is implicated in initiating the process of sarcomagenesis. The present studies provide an important insight into the primary events that unfold upon SYT–SSX expression in the undifferentiated stem cell from which the cancer is thought to arise.
Results
SYT–SSX2 expression deregulates developmental programs and differentiation in myoblasts
SYT–SSX expression is sufficient to drive tumorigenesis (Nagai et al., 2001; Haldar et al., 2007), and previous studies showed that SYT–SSX fusions might alter the differentiation potential of SS cells (Ishibe et al., 2008; Naka et al., 2010). What has been lacking, however, is a thorough analysis of the initial changes that occur in the mesenchymal precursor cell when SYT–SSX is expressed. We chose to conduct such analysis in C2C12 myoblasts because they are a well-characterized, untransformed system of mesenchymal lineage capable of differentiation into multiple cell types (Odelberg et al., 2000). Additionally, in a transgenic SS model, SYT–SSX2 expression in muscle progenitors formed tumors that recapitulated the human disease (Haldar et al., 2007), further indicating that myoblasts are a relevant model system.
After confirming their myogenic identity with a marker profile and myotube formation (Supplementary Figure S1), we transduced C2C12 myoblasts with HA-Flag-SYT–SSX2 or a vector control, to define their genetic programs. The microarray analysis generated 700 upregulated and over 800 downregulated genes (all microarray and chromatin immunoprecipitaton (ChIP)-Sequencing (ChIPSeq) data have been deposited in the Gene Expression Omnibus (Edgar et al., 2002; available at http://www.ncbi.nlm.nih.gov/geo/) and can be obtained through accession numbers GSE26562 (C2C12 microarray), GSE26563 (BMMSC microarray) and GSE26564 (C2C12 ChIPSeq)). Comparison of these data to a microarray of eight human SSs (Nielsen et al., 2002) identified nearly 100 upregulated genes shared between SYT–SSX2-expressing myoblasts and human tumors (Supplementary Table S1). Strikingly, many of these shared genes were lineage determinants (Pth1r, Ngfr, Hoxb5 and Sox9) and mediators of developmental pathways such as fibroblast growth factor (FGF) (Fgfr2 and Fgfr3), Notch (Dll1), Hedgehog (Gli2) and Wnt (Tle4) (Figure 1a). Their expression was validated by reverse transcription–PCR (RT–PCR) (Figure 1a, asterisks). Furthermore, upregulation of various Wnt ligands, (Figure 1a, Wnt4 and Wnt11; Nielsen et al., 2002) in both SYT–SSX2-expressing myoblasts and human SS tumors reflected a sustained activation of this pathway.
Figure 1.
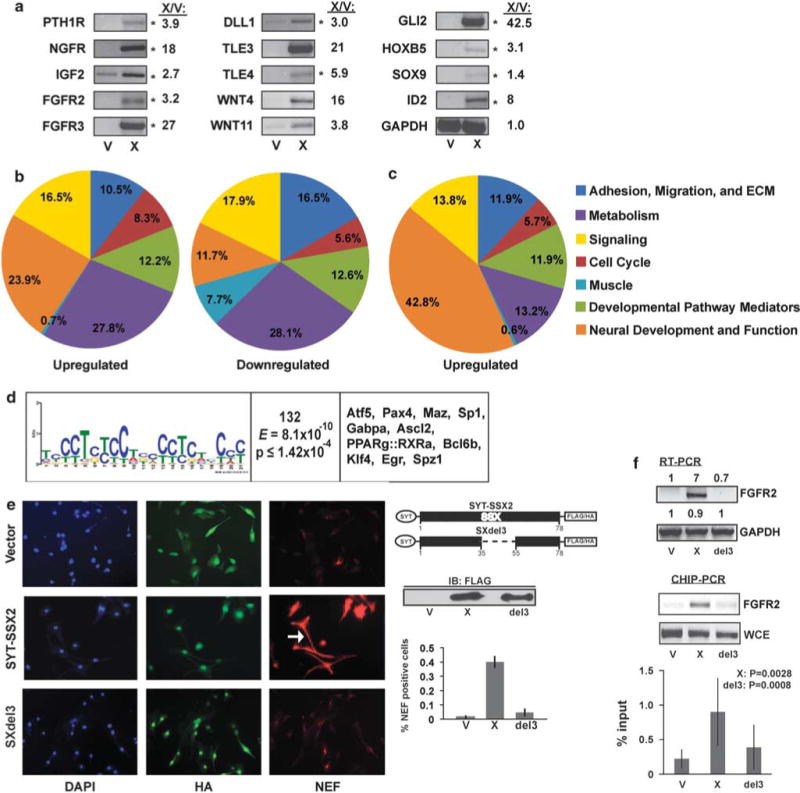
Alterations in cellular programs in myoblasts by SYT-SSX2. (a) RT–PCR in myoblasts expressing SYT–SSX2 (X) or vector control (V). Of 17 genes tested, 14 showed upregulated expression in SYT–SSX2 cells. The asterisks (*) denote genes shared by SYT–SSX2-expressing myoblasts and human SS tumors (Nielsen et al., 2002). GAPDH served as loading control. The X/V ratios represent fold increase in gene transcription, as measured by using the Fluorchem 8900 densitometer, with the AlphaEase FC program. ‘(b) Functional categorization of significantly (1.6-fold change) regulated genes in SYT–SSX2-positive cells. Of the total upregulated and downregulated genes, 695 upregulated (left) and 677 downregulated (right) genes had known functions and are represented in the pie charts. (c) Functional categorization of significantly upregulated genes that also have the SYT–SSX2 complex-binding sites between 0 and 10 kb upstream from their TSS. The functions of 159 genes were annotated and are represented in the pie chart. (d) Motif analysis of SYT–SSX2 ChIPSeq peaks. First column: A putative SYT–SSX2 complex-binding motif derived by MEME. Residue height is proportional to the probability of its presence at a given position. Second column: Number of peaks containing the motif. The E-score and P-value denote the statistical validity of the consensus sequence. Third column: Transcription factors that may bind to the given motif. (e) NEF formation in SYT–SSX2- and SXdel3-expressing myoblasts. Hemagglutinin (HA)-Flag-vector (top row), HA-Flag-SYT-SSX2 (middle row) and HA-Flag-SXdel3 cells were stained for HA (green) and NEF (red), and visualized by fluorescence microscopy. 4′,6-diamidino-2-phenylindole (DAPI, blue) is the nuclear stain. The arrow indicates a cell with a long projection. The images were taken at × 20 magnification. The diagram shows the deleted segment of SSX2 in SXdel3. A Flag immunoblot shows expression levels in V (vector), X (SYT–SSX2) and del3 (SXdel3) cellular lysates. The histogram represents the average ratio of NEF-positive cells to HA-positive cells in V control, X and del3 cells (n = 3). The error bars denote the standard deviation. (f) FGFR2 RT–PCR in myoblasts expressing vector control (V), SYT–SSX2 (X) or SXdel3 (del3). The numbers represent the ratios of expression levels in X and del3 over V cells. Signal intensities were measured by using the Fluorchem 8900 densitometer, with the AlphaEase FC program. Lower panel: ChIP of SYT–SSX2 and SXdel3 at the peak located upstream from the Fgfr2 gene, using the anti-Flag antibody, in V control, X and del3 myoblasts. Whole-cell extract DNA (WCE) served as positive control. The histogram represents the average of SYT–SSX2, SXdel3 and control vector binding to the Fgfr2 peak, measured as percent input. Results from four ChIP–PCR experiments were used for the analysis. The error bars are the standard deviations. X:P denotes the significance of X values relative to V. Del3:P denotes the significance of SXdel3 values relative to X.
An overall functional categorization of the upregulated genes revealed 85 (12.2%) to be involved in development (Figure 1b), the majority of which function in lineage specification (Supplementary Table S2). Similarly, 85 (12.6%) of the downregulated genes are involved in differentiation and development (Figure 1b). Most striking, however, was the upregulation of 166 genes (23.9%) normally involved in neural differentiation and function (Figure 1b and Supplementary Table S3). Notably, we observed a simultaneous downregulation of 52 (7.7%) myogenic genes (Figure 1b), including terminal differentiation markers (troponin and muscle myosins) as well as transcriptional controllers of myogenesis (Myf5, MyoD and myogenin; Supplementary Table S4 and Supplementary Figure S2A). These data suggested a myogenic differentiation block that was confirmed when SYT–SSX2-expressing myoblasts failed to form multinucleated myotubes and continued to grow as mononucleated cells (Supplementary Figure S1). Altogether, SYT–SSX2 expression in myoblasts led to the abrogation of myogenesis, with an apparent concomitant reprogramming toward neural lineages.
Targeting of SYT–SSX2 to chromatin is required for occupancy of neural genes and induction of the neural phenotype
To identify the specific subset of genes to which the SYT–SSX2 complex is recruited, we conducted ChIPSeq analysis and determined the genome-wide occupancy of SYT–SSX2. We used myoblasts transduced with HA-Flag-SYT–SSX2 owing to lack of an appropriate antibody that efficiently recognizes native SYT–SSX2 epitopes in ChIP experiments. ChIPSeq for SYT–SSX2 yielded over 19 million unique tags compared with over 16 million unique tags in the control (all microarray and ChIPSeq data have been deposited in the Gene Expression Omnibus (Edgar et al., 2002; available at http://www.ncbi.nlm.nih.gov/geo/) and can be obtained through accession numbers GSE26562 (C2C12 microarray), GSE26563 (BMMSC microarray) and GSE26564 (C2C12 ChIPSeq)). Putative SYT–SSX2 target sites were determined by the Model-based Analysis of ChIPSeq program. This analysis validates true peaks by calculating the significance of each candidate peak relative to the control using a significance threshold (Zhang et al., 2008). In our study, this method generated approximately 53000 peaks with a maximum false discovery rate of 2.8% (Gene Expression Omnibus accession GSM653014 provides direct access to SYT–SSX2 ChIPSeq peak data.). The ChIP peaks were categorized by their distance upstream from transcription start sites (TSSs, + 1) and the results are shown in Table 1. On the whole, the majority of peaks (approximately 60%) are located at distances greater than 50kb from TSSs. Closer to known genes, 20% of the peaks are located within 20kb upstream from TSSs, with over 6000 sites (11.5% of the total peaks) between 0 and 10 kb (Table 1). A total of 3440 sites are located within 5kb upstream from TSSs corresponding to 1352 genes (Table 1). Given that SYT–SSX2 associates with transcription regulators, we decided to analyze more closely genes with SYT–SSX2 occupancy near their TSS. As a starting point, we selected genes with SYT–SSX2 peaks situated up to 10kb upstream from their TSS, in the event the oncogene, like other known transcription regulators (Farnham, 2009), binds beyond the traditional promoter region. Moreover, by nature of their function, the Polycomb and SWI/SNF chromatinmodifying complexes SYT–SSX2 associates with, may direct its docking at sites farther from the traditional 5-kb proximal regulatory region (Mateos-Langerak and Cavalli, 2008).
Table 1.
Distribution of SYT–SSX2 ChIP peaks relative to gene TSSs and corresponding genes
| Distance (kb) | Number of peaks | Percentage of total peaks | Total number of genes |
|---|---|---|---|
| 0–5 | 3440 | 6.5 | 1352 |
| 5–10 | 2654 | 5 | 1076 |
| 10–15 | 2400 | 4.5 | 1016 |
| 15–20 | 2287 | 4.3 | 933 |
| 20–50 | 10230 | 19.3 | 2026 |
| 50–100 | 10312 | 19.5 | 1693 |
| 100–150 | 6035 | 11.4 | 973 |
| 150–200 | 3956 | 7.5 | 659 |
| > 200 | 11678 | 22 | 984 |
Abbreviations: ChIP, chromatin immunoprecipitaton; TSS, transcription start site.
Focusing on the window 10kb upstream from gene TSSs, cross-validation of the microarray with the ChIPSeq data revealed that SYT–SSX2 was physically recruited to approximately 200 of the upregulated genes and to only 51 of the downregulated genes. Functionally, the downregulated 51 genes followed the general distribution of genes in the overall microarray (Supplementary Figure S2B). Strikingly, genes associated with neural development and function were quite prevalent (42.8%; 68 genes) among the upregulated 200 genes bound by the SYT–SSX2 complex (Figure 1c). These genes are active in different aspects of neural differentiation, including patterning, axon guidance, signaling and growth (Table 2). This is remarkable as C2C12 cells are mesenchymal progenitors and do not naturally differentiate into neural lineages.
Table 2.
Selected list of upregulated genes bound by the SYT–SSX2 complex involved in neural development and function
| Symbol | Gene description | Symbol | Gene description |
|---|---|---|---|
| Development and differentiation | |||
| Bhlhe23 | Basic helix–loop–helix, e23 | Fezf2 | Fez family zinc finger |
| L1cam | Cell adhesion molecule | Olig2 | Oligodendrocyte lineage factor |
| Prox1 | Prospero homeobox | Ptpru | Protein tyrosine phosphatase |
| Zcchc12 | Zinc finger with CCHC domain | Zic2 | Zinc-finger protein of cerebellum |
| Patterning and axon guidance | |||
| Crmp1 | Collapsin response mediator | Dpysl5 | Dihydropyrimidinase-like-5 |
| Epha8 | Eph receptor-A8 | Efnb1 | Ephrin-B1 |
| Ephb1 | Eph receptor-B1 | Slit3 | Slit homolog-3 |
| Unc5a | Netrin receptor | ||
| Neurotransmitter signaling and metabolism | |||
| Abat | Aminotransferase | Adra2c | Adrenergic receptor |
| Cacna1h | Calcium channel | Cacng5 | Calcium channel |
| Chrna4 | Cholinergic receptor | Grm4 | Glutamate receptor |
| Kcnip3 | Kv channel-interacting protein-3 | Nptx1 | Neuronal pentraxin-1 |
| Slc6a1 | GABA transporter | Th | Tyrosine hydroxylase |
| Neuropeptide, lipid and hormone signaling | |||
| Cck | Cholecystokinin | Faah | Fatty acid amide hydrolase |
| Gpr50 | G-protein-coupled receptor-50 | Gal | Galanin |
| Mgll | Monoglyceride lipase | Ntsr1 | Neurotensin receptor-1 |
| Pdyn | Prodynorphin | Sst | Somatostatin |
| Adhesion, growth and survival | |||
| Amigo2 | Adhesion molecule | Bai1 | Brain angiogenesis inhibitor-1 |
| Bai2 | Brain angiogenesis inhibitor-2 | Cdh23 | Cadherin-23 |
| Gjb2 | Gap junction protein | Ngfr | Nerve growth factor receptor |
Further analysis of the ChIPSeq peaks located upstream from the 200 genes (approximately 500 peaks total) derived a recruitment motif for SYT–SSX2, rich in C and T residues (Figure 1d, first column), and contained in 132peaks. This motif contains potential binding sites for a group of transcription factors belonging to the homeodomain, nuclear receptor and Sp1 families (Figure 1d, third column) known to be involved in stem cell programming and differentiation.
The extensive association of SYT–SSX2 with neural genes led us to question if these myoblasts showed a matching phenotype. In a background of 80–90% infection efficiency, 40% of SYT–SSX2-expressing myoblasts expressed neurofilament (NEF; Figure 1e, middle row, right panel and histogram) whereas control cells showed minimal (< 2%) NEF staining (Figure 1e, top row, right panel). The empty vector produces a short HA-Flag-peptide that allows the visualization of positively infected control cells (Figure 1e, top row, middle panel). Moreover, oncogene-expressing cells showed long projections (Figure 1e, arrow), similar to a phenotype we observed in SYT–SSX2-expressing fibroblasts (Barco et al., 2007) and consistent with the neurogenic features noted in SS cells (Ishibe et al., 2008). Overall, stimulation of a pro-neural program appears to be a pronounced feature of SYT–SSX2.
Mediators of the Wnt, Hedgehog and FGF pathways, and differentiation formed an additional 11.9% (19 genes) of the 200 genes occupied by SYT–SSX2 (Figure 1c; Supplementary Table S2, asterisks). In particular, we noticed the presence of FGF mediators throughout our analyses. By microarray, a number of FGF pathway members were upregulated (Supplementary Table S2), and increased expression of FGF receptors, Fgfr2 and Fgfr3, was confirmed by RT–PCR (Figure 1a). Importantly, the same FGFR2 and FGFR3 were also upregulated in human SSs (Supplementary Table S1; Nielsen et al., 2002). ChIPSeq analysis indicated that the Fgfr2 gene is directly targeted by SYT–SSX2, and further ChIP experiments confirmed the presence of SYT–SSX2 at the peak located 4.3kb upstream from the Fgfr2 gene (Figure 1f, ChIP–PCR panel). Notably, the Fgfr2 peak contains a sequence matching the SYT–SSX2 recruiting motif (Figure 1d). Thus, the FGF receptor appears to be a direct target of the oncogene.
SYT–SSX2 associates with Polycomb complexes, modulators of chromatin and lineage determination. To determine whether the ability of SYT–SSX2 to target chromatin is required for the observed effects, we tested SXdel3, an SYT–SSX2 mutant with a 20-residue deletion in its SSX-targeting module (Figure 1e, diagram). SXdel3 is unable to colocalize with Polycomb and antagonize its Bmi1 component in U2OS cells (Barco et al., 2009). When assayed in C2C12 cells, SXdel3 failed to induce NEF formation (Figure 1e, bottom row, right panel), indicating an inactive neural program. Furthermore, we observed that the ability of SXdel3 to upregulate FGFR2 expression (Figure 1e, RT–PCR panel), or bind upstream from the gene (Figure 1e, ChIP–PCR panel and histogram), was markedly diminished. To summarize, these studies demonstrate that SYT–SSX2 activates a pro-neural program and blocks normal myogenesis. Its ability to bind chromatin is required for its transcriptional and phenotypic effects.
SYT–SSX2 causes aberrant differentiation in human mesenchymal stem cells
Myoblast reprogramming by SYT–SSX2 prompted us to question whether dictating lineage commitment in undifferentiated precursors is an intrinsic feature of the oncogene. As SS is thought to arise in a mesenchymal stem cell (Mackall et al., 2004; Naka et al., 2010), we questioned whether SYT–SSX2 expression could elicit similar effects in multipotent, human BMMSCs (Colter et al., 2001; Sekiya et al., 2002; Supplementary Figure S3; Supplementary Materials and methods). Searching for a neural phenotype in SYT–SSX2-expressing BMMSCs, we observed a robust and heterogeneous NEF expression in a significant population (Figure 2a, bottom row, right panel and arrowheads). Neither naïve nor vector-expressing BMMSCs produced NEFs (Figure 2a, top and middle rows, right panels).
Figure 2.
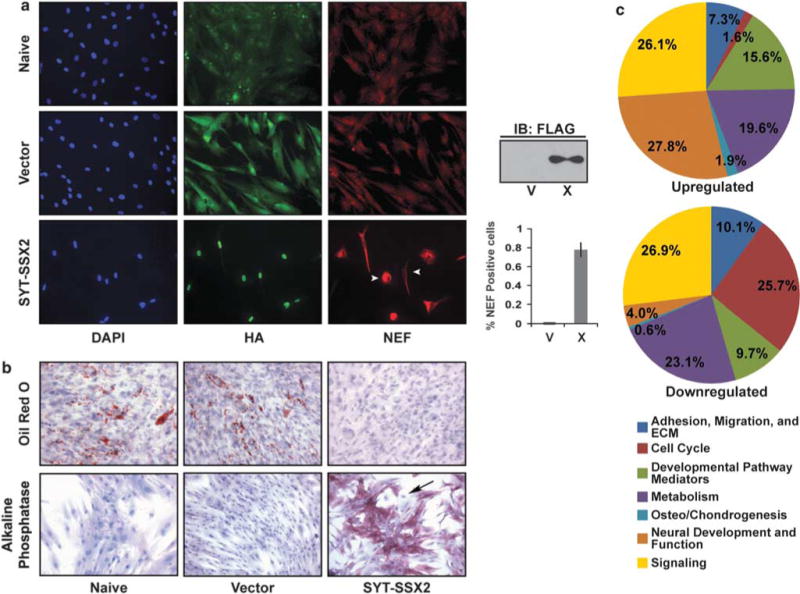
SYT-SSX2 deregulates differentiation in mesenchymal stem cells. (a) NEF expression in SYT-SSX2-expressing BMMSCs. Naïve, vector control (V) and SYT-SSX2 (X)-expressing BMMSCs were stained for HA (green) and NEF (red). The images were taken at × 20 magnification. The arrowheads indicate heterogenous expression of NEF. The Flag immunoblot shows SYT-SSX2 expression in X-expressing cells. The histogram represents the average ratio of NEF-positive cells to HA-positive V and X cells (n = 3). The error bars represent the standard deviation. (b) SYT-SSX2’s effects on BMMSCs differentiation. Bright-field microscopy of naïve, vector- and SYT-SSX2-expressing cells stained with Oil Red O after adipogenic stimulation (top row) or for alkaline phosphatase expression (bottom row) without osteogenic stimulation. The images were taken at × 20 magnification. The arrow indicates heterogeneous expression of alkaline phosphatase. (c) Functional categorization of significantly (2.0-fold change) regulated genes in SYT-SSX2-expressing BMMSCs. The functions of 735 upregulated (upper chart) and 506 downregulated (lower chart) genes were documented, and these genes are represented in the pie charts.
We next asked whether SYT–SSX2 influenced the ability of BMMSCs to differentiate into their normal lineages. We discovered that oncogene expression caused a marked inhibition of adipogenesis, whereas naïve and vector-expressing cells differentiated normally (Figure 2b, top row). By contrast, SYT–SSX2 expression accelerated osteogenesis as evidenced by an intense alkaline phosphatase staining 48 h after infection without addition of osteogenic factors (Figure 2b, bottom row, right panel). As expected, in the absence of inducing factors, naïve and vector-expressing BMMSCs showed minimal alkaline phosphatase staining, (Figure 2b, bottom row, left and middle panels). Alkaline phosphatase positivity was heterogeneous (Figure 2b, arrow), indicating that the early osteogenesis was activated at varying degrees across the cell population. Inhibition of adipogenesis and acceleration of osteogenesis by SYT–SSX2 were observed in two additional BMMSCs lines, one human (Supplementary Figure S4 and Materials and methods), and one murine (Alfaro et al., 2008; data not shown). Altogether, these data suggest that SYT–SSX2 induces a neural and/or osteogenic program(s) in BMMSCs, while inhibiting their adipogenic differentiation.
A full characterization of the gene expression profiles initiated by SYT–SSX2 in BMMSCs identified approximately 750 significantly upregulated and more than 500 significantly downregulated genes when compared with vector-transduced BMMSCs (all microarray and ChIP-Seq data have been deposited in the Gene Expression Omnibus (Edgar et al., 2002; available at http://www.ncbi.nlm.nih.gov/geo/) and can be obtained through accession numbers GSE26562 (C2C12 microarray), GSE26563 (BMMSC microarray) and GSE26564 (C2C12 ChIPSeq)). Functional categorization of the upregulated genes revealed nearly one-third (27.8%) to participate in neural differentiation and signaling (Figure 2c and Table 3). Notably, several of these genes were also shown to be occupied and upregulated by SYT–SSX2 in myoblasts (Table 3, footnote). This implies that SYT–SSX2 targets the same genes and promotes neural programs regardless of cell type. By contrast, promoters of osteoblast differentiation (BMP2, BMP6, FGFR3 and OSR2) represented 1.9% of the upregulated genes (Figure 2c and Supplementary Table S5). Taken together, these data suggest that SYT–SSX2 indeed activates programs of neural and osteogenic differentiation in BMMSCs.
Table 3.
Selected list of genes involved in neural development and function upregulated by SYT–SSX2 in human mesenchymal stem cells
| Symbol | Gene description | Symbol | Gene description |
|---|---|---|---|
| Development and differentiation | |||
| ENC1 | Ectodermal-neural cortex | EYA4 | Eyes absent homolog |
| FGF11 | Fibroblast growth factor-11 | GBX2 | Brain homeobox-2 |
| L1CAMa | Cell adhesion molecule | NEUROD1 | Neurogenic differentiation |
| NEUROG3 | Neurogenin-3 | PROX1a | Prospero homeobox-1 |
| Patterning and axon guidance | |||
| CRMP1a | Collapsin response mediator | DPYSL5a | Dihydropyrimidinase-like-5 |
| EFNA4 | Ephrin-A4 | EFNB1a | Ephrin-B1 |
| EPHA3 | EPH receptor-A3 | EPHB1a | EPH receptor-B1 |
| GLDN | Gliomedin | NRP2 | Neuropilin-2 |
| ROBO1 | Roundabout | SEMA3D | Semaphorin |
| SLIT1 | Slit homolog-1 | UNC5Aa | Netrin receptor |
| Neurotransmitter signaling and metabolism | |||
| ABATa | Aminotransferase | ADRA1D | Adrenergic, receptor |
| CHRNA4a | Cholinergic receptor | DRD2 | Dopamine receptor-D2 |
| GABRE | GABA receptor, epsilon | GATM | Glutamate decarboxylase |
| GRIK3a | Glutamate receptor | GRM4a | Glutamate receptor metabotropic |
| SLC18A3a | Acetylcholine transporter | ||
| Neuropeptide, lipid and hormone signaling | |||
| CRHR1a | Neuropeptide receptor | GALa | Galanin |
| GPR50a | G-protein-coupled receptor-50 | NPY | Neuropeptide-Y |
| NTSR1a | Neurotensin receptor-1 | PCSK1 | Convertase subtilisin/kexin |
| PNOC | Pronociceptin | SSTa | Somatostatin |
| Adhesion, growth and survival | |||
| AREG | Amphiregulin | BAI2a | Brain angiogenesis inhibitor-2 |
| GFRA2 | GDNF receptor | GPC4 | Glypican-4 |
| NCAM1 | Neural cell adhesion molecule-1 | NGFRa | Nerve growth factor receptor |
| PCDH10 | Protocadherin-10 | TPPP3 | Tubulin polymerization |
Upregulated genes in BMMSCs that are also occupied and upregulated by SYT–SSX2 in C2C12 myoblasts.
Stem cell controllers such as Wnt, Notch, transforming growth factor-β/bone morphogenetic protein (BMP), Shh and FGF (Figure 2c and Table 4) constituted 16% of the upregulated genes. Three of these genes, AXIN2, Shh and FGFR2, were also upregulated and occupied by SYT–SSX2 in myoblasts (Table 4, footnote).
Table 4.
Selected list of developmental pathway mediators upregulated by SYT–SSX2 in human mesenchymal stem cells
| Symbol | Gene description | Symbol | Gene description |
|---|---|---|---|
| WNT | |||
| AXIN2a | Conductin, axil | SFRP1 | Secreted frizzled-related protein |
| DACT1 | Antagonist of β-catenin | TLE1 | Transducin-like enhancer protein |
| FZD3 | Frizzled homolog | TLE2 | Transducin-like enhancer protein |
| FRZB | Frizzled-related protein | TLE3 | Transducin-like enhancer protein |
| KREMEN1 | Kringle-containing protein | WNT4 | WNT ligand-4 |
| LEF1 | Lymphoid enhancer-binding factor | WNT7B | WNT ligand-7B |
| PRICKLE1 | Prickle homolog | WNT11 | WNT ligand-11 |
| RSPO1 | R-spondin homolog | ||
| NOTCH | |||
| DLL1 | Delta-like | JAG1 | Jagged-1 |
| DTX1 | Deltex homolog | JAG2 | Jagged-2 |
| DTX4 | Deltex-4 homolog | LFNG | Lunatic fringe |
| HES1 | Hairy and enhancer of split | NOTCH1 | Notch homolog |
| HEY2 | HES-related with YRPW motif | SIX1 | SIX homeobox |
| TGFβ/BMP | |||
| BAMBI | BMP and activin inhibitor | FAM46C | Family with sequence similarity-46 |
| BMP3 | BMP ligand-3 | FSTL4 | Follistatin-like |
| BMP4 | BMP ligand-4 | GDF6 | Growth differentiation factor |
| BMP7 | BMP ligand-7 | SOST | Sclerosteosis |
| BMPER | BMP-binding endothelial regulator | TGFB2 | Transforming growth factor, β |
| SHH | |||
| PTCH1 | Patched homolog-1 | PTCHD2 | Patched domain-2 |
| PTCHD1 | Patched domain-1 | SHHa | Sonic hedgehog homolog |
| FGF | |||
| FGFBP2 | FGF-binding protein-2 | FGFR2a | Fibroblast growth factor receptor-2 |
Upregulated genes in BMMSCs that are also occupied and upregulated by SYT–SSX2 in C2C12 myoblasts.
Notably, the C2C12 and the BMMCs microarrays overlapped with 248 differentially expressed genes, 85 (34%) of which belonged to the neurogenic program and 54 (~ 22%) were developmental mediators and transcription factors (Supplementary Table S6).
The role of FGFR2 in SYT–SSX2’s differentiation effects
Throughout our analyses Fgfr2 held our interest as it was noticeably upregulated not only in BMMSCs and myoblasts but also in human SS tumors (Nielsen et al., 2002). Moreover, our ChIPSeq analysis revealed Fgfr2 as a direct target of SYT–SSX2. Importantly, FGFR2 is a major inducer of both osteogenesis and neurogenesis during development (Huang et al., 2007; Villegas et al., 2010) and could be contributing, in part, to the shift in lineage commitment seen in human BMMSCs. FGFR2 was, therefore, our prime candidate for an upstream signaling pathway whose activation would explain the induction of the neural cascade by SYT–SSX2. To assess the contribution of FGFR2 to the visible effects of SYT–SSX2, we decided to analyze the consequences of its inhibition in the stem cells. NEF formation and cell growth were both used as read-outs to measure the dependence of SYT–SSX2-expressing BMMSCs on FGFR2. We started by inhibiting FGFR activity with PD173074, a small molecule with high selectivity for the FGFR kinase (Pardo et al., 2009). A 2-day treatment with PD173074 led to a marked diminution of NEF signal in SYT–SSX2-expressing BMMSCs (Figure 3a, left histogram), reflecting the dependence of the neural marker on active FGFR. More specifically, infection of SYT–SSX2-expressing BMMSCs with two FGFR2-specific short-hairpin RNA (shRNA) vectors (833 and 703; Figure 3a, middle panel) showed significant growth retardation when compared with a non-targeting vector (2910; Figure 3a, right histogram, dark gray bars). Apart from growth inhibition, FGFR2 depletion caused a specific attenuation of the NEF signal in the SYT–SSX2-expressing BMMSCs cells (more pronounced with 703; Figure 3a, right histogram, light-gray bars). Importantly, the 2910, 833 and 703 vectors did not affect the growth of vector control BMMSCs. These findings suggest that FGFR2 signaling is required for the proper growth of SYT–SSX2-expressing mesenchymal stem cells and the expression of neural differentiation markers.
Figure 3.
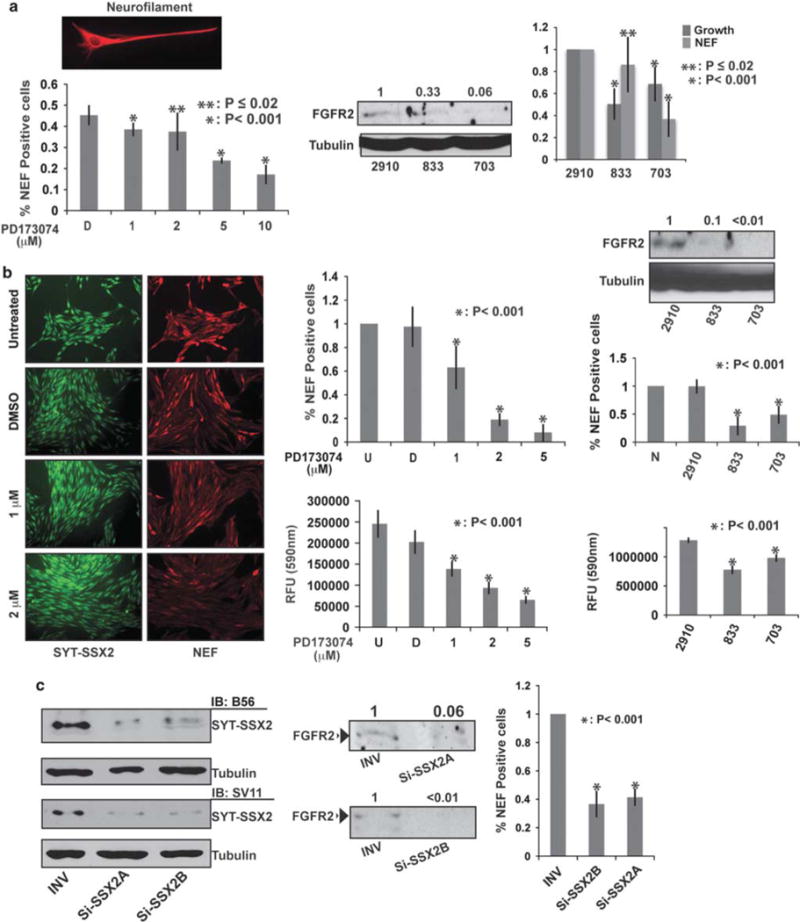
Contribution of FGFR2 to SYT-SSX2’s differentiation effects and to cell growth. (a) Loss of neurite extensions and NEF signal intensity after inhibition of FGF signaling in SYT-SSX2 (HA-positive) BMMSCs. The top left image depicts a reference NEF (red)-positive, SYT-SSX2-expressing BMMSC. The left histogram represents the average ratio of NEF-positive to HA-positive cells 2 days after treatment with PD173074 at the indicated concentrations (n = 4; approximately 1000 cells were included for each concentration). D is vehicle DMSO. The error bars denote the standard deviation. The P-values reflect the significance of the experimental values compared with the vehicle (D). Middle panel: Immunoblot of FGFR2 levels in SYT-SSX2-expressing BMMSCs infected with the indicated FGFR2-shRNAs. 2910 is the non-targeting vector and tubulin is loading control. The numbers indicate the ratio of FGFR2 signal in the cells expressing targeting shRNAs relative to non-targeting vector (value 1). Right histogram: The dark gray bars are the average of 833 and 703 cell number over 2910 (value 1). The 2910, 833 and 703 originated from the same SYT-SSX2-expressing BMMSCs pool (n = 3). The light-gray bars are the average ratio of NEF-positive 833 and 703 cells over 2910 NEF-positive (value 1) cells. The error bars indicate the standard deviation. The P-values indicate the significance of the experimental values with the targeting shRNAs as compared with non-targeting vector (2910). (b) Decreased NEF expression and growth of SS SYO-1 cells after inhibition of FGF signaling. The left image panel depicts the NEF signal (red) with increasing concentrations of PD173074in SYO-1 cells. Nuclear SYT-SSX2 (green) was visualized with the anti-SSX2 B56 antibody. DMSO was the vehicle control. The images were taken at × 20 magnification. Middle upper histogram: The average ratio of NEF-positive cells exposed to DMSO (D) or PD173074 to untreated (U; value 1) SYO-1 cells (n = 2; over 1000 cells were included in each category). The error bars indicate the standard deviation. The P-value reflects the significance of the experimental values as compared with the vehicle (D). The middle lower histogram shows growth inhibition of SYO-1 cells with increasing concentrations of PD173074 (n = 2). Cell growth was estimated by using the SRB colorimetric assay. The error bars represent the standard deviation. The P-value reflects the significance of the experimental values as compared with the vehicle (D). The immunoblot shows the FGFR2 levels in shRNA-treated SYO-1 cells. Tubulin is the loading control. The numbers indicate the ratio of FGFR2 signal in targeting shRNA cells relative to non-targeting vector (2910). Upper right histogram: The effect of 2910, 833 and 703 FGFR2-shRNAs on NEF expression in SYO-1 cells, relative to NEF-positive naïve (N; value 1) cells. The error bars represent the standard deviation (n = 3; approximately 1000 cells were included for each category). The P-value indicates significance of the experimental values with the targeting shRNAs as compared with the non-targeting vector (2910). The lower right histogram demonstrates the effect of the three FGFR2-shRNAs on SYO-1 growth by using the SRB assay (n = 2). The error bars represent the standard deviation. The P-value indicates the significance of the experimental values with the targeting shRNAs as compared with the non-targeting vector (2910). (c) Effect of SYT-SSX2 small interfering RNA in SYO-1 cells. Left immunoblot: SYT-SSX2 levels in INV control and two SSX2-targeting RNAs (Si-SSX2A and Si-SSX2B) in SYO-1 lysates detected with the antibodies B56 (anti-SSX2) and SV11 (anti-SYT). Tubulin is the loading control. Middle immunoblot: FGFR2 levels in the same lysates. The numbers indicate the ratio of FGFR2 signal with the targeting Si-SSX2 SiRNAs over a control RNA (INV). Histogram: The effect of SYT-SSX2 small interfering RNA on NEF formation in SYO-1 cells. The numbers indicate the average ratio of NEF-positive Si-SSX2A and Si-SSX2B cells to NEF-positive INV control cells (value 1). The error bars denote the standard deviation (n = 3; over 1000 cells were counted for each category). The P-value indicates the significance of the experimental values with the targeting Si-SSX2 SiRNAs as compared with the control RNA (INV). Measurements of FGFR2 depletion by the targeting shRNAs, or by the SYT-SSX2 SiRNAs, were performed by using the Fluorchem 8900 densitometer, and analyzed with the AlphaEase FC software.
We then repeated these analyses in the human SYO-1 SS cells that carry the SYT–SSX2 translocation (Kawai et al., 2004). We observed that approximately 15% of the SYO-1 cell population contained NEF, and PD173074 caused a graded disappearance of NEF-positive SYO-1 cells and an incremental inhibition of their growth (Figure 3b, left and middle panels). As in the SYT–SSX2-expressing BMMSCs, FGFR2 depletion with the 833 and 703 shRNAs also led to a marked decrease in the number of NEF-positive SYO-1 cells as well as a delay in their growth (Figure 3b, right panel). We next asked whether these events in SYO-1 cells are dependent on SYT–SSX2 expression. We found that depletion of SYT–SSX2 in SYO-1 cells with specific small interfering RNAs (Figure 3c, left panel) was accompanied by a concomitant decrease in FGFR2 levels (Figure 3c, middle panel) and a marked decrease in the relative number of NEF-positive cells (Figure 3c, histogram). We refrained from measuring the effect of SYT–SSX2 depletion on SYO-1 growth, as the inherent cell toxicity of RNA interference assays would interfere with its accuracy.
In summary, these studies suggest that SYT–SSX2 recruitment to the Fgfr2 gene results in the activation of FGF signaling, thereby driving the neural phenotype in BMMSCs and affecting their growth. This mechanism appears to be occurring in the human SS cells as well.
Discussion
In the present report, we show that the SS oncogene SYT–SSX2 reprograms mesenchymal stem/progenitor cells by activating a pro-neural gene network while disrupting normal differentiation. This was most likely due to the recruitment of SYT–SSX2 to an extensive array of neural genes, resulting in their activation. This corroborates previous reports in which a neural phenotype was observed in SYT–SSX-expressing SS cell lines (Ishibe et al., 2008). Furthermore, knockdown of SYT–SSX in SS cells led to a loss of neuronal features (the present study and Naka et al., 2010). We were also able to show the dependence of this neural phenotype on FGF signaling.
Genes with SYT–SSX2 binding within 10kb from their TSS were analyzed. An association between SYT–SSX2’s ability to target chromatin and its differentiation effects was established. However, the majority of the binding sites are situated farther than 20 kb away from the TSS, pointing to a likely long-range function of SYT–SSX2. This is to be expected, given its association with Polycomb. Thus, the oncogene may regulate gene expression at faraway distances, and/or is involved in nuclear patterning (Mateos-Langerak and Cavalli, 2008). Further analysis of SYT–SSX2 occupancy to clarify its long-range functions is underway.
Only a subset (17%) of regulated genes was bound by the SYT–SSX2 complex. This may be attributed to the affinity of SYT–SSX2 for mediators of stem cell pathways, as each may be responsible for altering the expression of numerous genes.
The remarkable number of neural and developmental genes shared by the myoblasts and the BMMSCs showcases the dominant programming effect of SYT–SSX2. Imposing a lineage commitment on stem/progenitor cells appears to be a recurrent feature of sarcoma-associated translocations (Mackall et al., 2004). One prominent example is PAX3-FKHR, the rhabdomyosarcoma fusion product that drove NIH-3T3 fibroblasts into a myogenic program (Khan et al., 1999). It is thought to induce tumorigenesis through stimulation of lineage commitment and simultaneous prevention of terminal differentiation (Charytonowicz et al., 2009). Whether SYT–SSX2 acts in a similar manner remains to be seen. Regardless, the dominant effect on cellular identity is thought to be a part of oncogenesis initiation by sarcoma-associated translocations and a necessary step toward malignant transformation (Mackall et al., 2004).
These observations allow us to speculate on the cell-of-origin for this malignancy. The capacity of SS cells to be differentiated into mesenchymal and neural cell types (Ishibe et al., 2008; Naka et al., 2010) implied that the disease originates in multipotent cells from either of these lineages. Our data indicate that the neural features are primarily caused by SYT–SSX2 itself, irrespective of the cellular context, so the target cell may not necessarily be of neural origin. Expression of SYT–SSX2 in multiple lineages in mice recapitulates human SS in all cases, attesting to the dominant program established by the oncogene and its capacity to transform different cell types (Haldar et al., 2009). Additionally, expression of SYT–SSX2 in committed myogenic progenitor cells resulted in tumor formation in mice (Haldar et al., 2007) suggesting that the cell-of-origin could be a more differentiated entity. However, in this model, genomic plasticity was essential, as SYT–SSX2 was non-tumorigenic in differentiated muscle cells (Haldar et al., 2007).
The upregulation of several mediators representing central pathways known to modulate stem cell behavior was another striking result. It uncovered a propensity of SYT–SSX2 for regulating developmental pathways. This may reflect an ability of SYT–SSX2 to create an imbalance in the microenvironment of the cancer cell in vivo, furthering malignancy. We have previously reported that SYT–SSX2 mediates the nuclear translocation and activation of β-catenin (Pretto et al., 2006). Consistent with this finding, upregulation of Wnt components was seen in our microarray studies. The crosstalk among Wnt, transforming growth factor-β/BMP, FGF, Hedgehog and Notch, and their impact on tumor cell behavior, are the focus of future studies.
Our high-throughput analyses identified FGFR2 as a critical signaling node in the behavior of SYT–SSX2-expressing cells. Its enhanced signaling by SYT–SSX2 may explain the accelerated osteoblastogenesis as well as the dominance of the pro-neural gene profile. With mitogen-activated protein kinase (MAPK)/extracellular signal-regulated kinase (ERK) and phosphatidylinositol-3-kinase (PI3K) activation, FGFR2 signaling promotes neurogenesis and skeletogenesis through crosstalk with Wnt, Hedgehog, Notch and BMP signals (Ever and Gaiano, 2005; Chadashvili and Peterson, 2006; Maric et al., 2007; Zhao et al., 2008; Miraoui and Marie, 2010). Furthermore, the benefit of FGF pathway attenuation to inhibit SS cell growth was reported previously (Ishibe et al., 2005) and corroborated by our studies. Chemical inhibition of FGFR2 signaling and its depletion using shRNA caused loss of NEF expression and decreased cell growth in both SYT–SSX2 BMMSCs and SS SYO-1 tumor cells. Significantly, upregulation of FGF ligands in the myoblast and BMMSC microarrays suggests that SYT–SSX2 establishes an autocrine FGF signaling loop. If this is the case, identification of FGFR2 as the mediator of these signals designates it as a candidate for potential SS tumor reversal. Increased FGFR2 activity is already linked to advanced malignant phenotypes in endometrial, uterine, ovarian, breast, lung and gastric cancers. Strategies designed to target FGFR2 in these cancers (Katoh, 2008; Katoh and Katoh, 2009) are ongoing.
The deregulation of differentiation in our model systems can also be explained by these findings. FGFR2-induced osteoblast maturation (Miraoui and Marie, 2010) inhibits adipogenesis in mesenchymal stem cells (Muruganandan et al., 2009). Similarly, the stimulation of a neural program by SYT–SSX2 may have abrogated myogenesis. In C2C12 cells, the two outcomes were shown to be mutually exclusive (Watanabe et al., 2004). Alternatively, direct silencing of myogenic genes could have also contributed to this phenotype. The ChIPSeq analysis revealed a putative SYT–SSX2-binding site upstream from the downregulated MyoD gene. Additional studies are underway to test this possibility and identify potential recruitment factors associated with transcriptional silencing by SYT–SSX2.
While SYT–SSX2 transgenic myoblasts equivalent to C2C12 (Asp et al., 2011) developed tumors in mice (Haldar et al., 2007), neither the C2C12 cells nor the BMMSCs were transformed by SYT–SSX2 in vitro. One interpretation is the requirement of a surrounding stroma to provide a self-renewing, tumor-promoting environment. Alternatively, our observations may represent a priming step in cancer initiation by SYT–SSX2, and a permissive epigenetic or genetic event is required for full transformation.
In summary, our studies in mesenchymal stem and progenitor cells have uncovered a function of SYT–SSX2 in differentiation programming, and our genome-wide analyses provided a glimpse into the early events of tumor initiation by the oncogene. The question is how SYT–SSX2 imposes a heritable gene-regulatory state that redirects cell fate (Gurdon and Melton, 2008). We will acquire a better understanding once the defined factors are identified.
Overall, we believe that the deregulation of differentiation is a manifestation of the ability of SYT–SSX2 to target lineage-specific programs. FGFR2 was identified as a cardinal player in SYT–SSX2-associated phenotypes, but it is likely that additional pathway mediators also contribute to SYT–SSX2-induced characteristics. Future investigation of other targets identified through this method will lead to a better understanding of the interplay among these pathways and SS pathology. This combination analysis also provides a powerful tool in the discovery of novel therapeutic targets and will be advantageous in understanding the biology of other oncogenic proteins directly affecting transcriptional programs.
Materials and methods
Cell culture and reagents
Lists of the cell lines, antibodies and chemicals are provided in the Supplementary Materials and methods.
Analysis of ChIP DNA by next-generation sequencing
Preparation of DNA to be sequenced by the Illumina Genome Analyzer II in the Vanderbilt Genome Technology Core is detailed in the Supplementary Materials and methods.
Analysis of SYT–SSX2 ChIPSeq
The Illumina Analysis Pipeline was used for image analysis and base calling. Analysis of the Sequence Alignment/Map (SAM) files by the Model-based Analysis of ChIPSeq program and calculations of nearest distance of peaks to annotated gene TSSs are described in the Supplementary Materials and methods.
Cross-validation of C2C12 microarray by ChIPSeq
Annotation of peaks to regulated genes is described in the Supplementary Materials and methods.
Motif analysis
Use of the MEME program to derive the consensus motif for binding is detailed in the Supplementary Materials and methods.
Additional methods
Retroviral infections, microarray, ChIP, RT–PCR and ChIP–PCR, immunofluorescence, differentiation, SRB, small interfering RNA and shRNA experiments were performed by using standard protocols. Please refer to Supplementary Materials and methods for details.
Supplementary Material
Acknowledgments
Funding was provided by the Alex’s Lemonade Stand Foundation (Innovation Award) and the Sarcoma Foundation of America. Microarrays were performed at the Vanderbilt Functional Genomics Shared Resource core supported by the VICC (P30 CA68485), the VDCC (P30 DK58404) and the Vanderbilt Vision Center (P30 EY08126). Some of the materials used in this work were provided by the Texas A&M Health Science Center College of Medicine Institute for Regenerative Medicine at Scott & White through a grant from NCRR of the NIH (grant no. P40RR017447). We thank BV Mary and H Trinity for assistance; T Ito and M Ladanyi for SYO-1 cells and A Sandelin and S Wilhite for technical support.
Footnotes
Conflict of interest
The authors declare no conflict of interest.
Supplementary Information accompanies the paper on the Oncogene website (http://www.nature.com/onc)
References
- Alfaro MP, Pagni M, Vincent A, Atkinson J, Hill MF, Cates J, et al. The Wnt modulator sFRP2 enhances mesenchymal stem cell engraftment, granulation tissue formation and myocardial repair. Proc Natl Acad Sci USA. 2008;105:18366–8371. doi: 10.1073/pnas.0803437105. [DOI] [PMC free article] [PubMed] [Google Scholar]
- Asp P, Blum R, Vethantham V, Parisi F, Micsinai M, Cheng J, et al. Genome-wide remodeling of the epigenetic landscape during myogenic differentiation. Proc Natl Acad Sci USA. 2011;108:E149–158. doi: 10.1073/pnas.1102223108. [DOI] [PMC free article] [PubMed] [Google Scholar]
- Barco R, Hunt LB, Frump AL, Garcia CB, Benesh A, Caldwell RL, et al. The synovial sarcoma SYT–SSX2 oncogene remodels the cytoskeleton through activation of the ephrin pathway. Mol Biol Cell. 2007;18:4003–4012. doi: 10.1091/mbc.E07-05-0496. [DOI] [PMC free article] [PubMed] [Google Scholar]
- Barco R, Garcia CB, Eid JE. The synovial sarcoma-associated SYT–SSX2 oncogene antagonizes the polycomb complex protein Bmi1. PLoS One. 2009;4:e5060. doi: 10.1371/journal.pone.0005060. [DOI] [PMC free article] [PubMed] [Google Scholar]
- Chadashvili T, Peterson DA. Cytoarchitecture of fibroblast growth factor receptor 2 (FGFR-2) immunoreactivity in astrocytes of neurogenic and non-neurogenic regions of the young adult and aged rat brain. J Comp Neurol. 2006;498:1–15. doi: 10.1002/cne.21009. [DOI] [PubMed] [Google Scholar]
- Charytonowicz E, Cordon-Cardo C, Matushansky I, Ziman M. Alveolar rhabdomyosarcoma: is the cell of origin a mesenchymal stem cell? Cancer Lett. 2009;279:126–136. doi: 10.1016/j.canlet.2008.09.039. [DOI] [PubMed] [Google Scholar]
- Colter DC, Sekiya I, Prockop DJ. Identification of a subpopulation of rapidly self-renewing and multipotential adult stem cells in colonies of human marrow stromal cells. Proc Natl Acad Sci USA. 2001;98:7841–845. doi: 10.1073/pnas.141221698. [DOI] [PMC free article] [PubMed] [Google Scholar]
- Edgar R, Domrachev M, Lash AE. Gene expression omnibus: NCBI gene expression and hybridization array data repository. Nucleic Acids Res. 2002;30:207–210. doi: 10.1093/nar/30.1.207. [DOI] [PMC free article] [PubMed] [Google Scholar]
- Ever L, Gaiano N. Radial ‘glial’ progenitors: neurogenesis and signaling. Curr Opin Neurobiol. 2005;15:29–33. doi: 10.1016/j.conb.2005.01.005. [DOI] [PubMed] [Google Scholar]
- Farnham PJ. Insights from genomic profiling of transcription factors. Nat Rev Genet. 2009;10:605–616. doi: 10.1038/nrg2636. [DOI] [PMC free article] [PubMed] [Google Scholar]
- Gurdon JB, Melton DA. Nuclear reprogramming in cells. Science. 2008;322:1811–1815. doi: 10.1126/science.1160810. [DOI] [PubMed] [Google Scholar]
- Haldar M, Hancock JD, Coffin CM, Lessnick SL, Capecchi MR. A conditional mouse model of synovial sarcoma: insights into a myogenic origin. Cancer Cell. 2007;11:375–388. doi: 10.1016/j.ccr.2007.01.016. [DOI] [PubMed] [Google Scholar]
- Haldar M, Hedberg ML, Hockin MF, Capecchi MR. A CreER-based random induction strategy for modeling translocation-associated sarcomas in mice. Cancer Res. 2009;69:3657–3664. doi: 10.1158/0008-5472.CAN-08-4127. [DOI] [PMC free article] [PubMed] [Google Scholar]
- Huang W, Yang S, Shao J, Li YP. Signaling and transcriptional regulation in osteoblast commitment and differentiation. Front Biosci. 2007;12:3068–3092. doi: 10.2741/2296. [DOI] [PMC free article] [PubMed] [Google Scholar]
- Ishibe T, Nakayama T, Aoyama T, Nakamura T, Toguchida J. Neuronal differentiation of synovial sarcoma and its therapeutic application. Clin Orthop Relat Res. 2008;466:2147–2155. doi: 10.1007/s11999-008-0343-z. [DOI] [PMC free article] [PubMed] [Google Scholar]
- Ishibe T, Nakayama T, Okamoto T, Aoyama T, Nishijo K, Shibata KR, et al. Disruption of fibroblast growth factor signal pathway inhibits the growth of synovial sarcomas: potential application of signal inhibitors to molecular target therapy. Clin Cancer Res. 2005;11:2702–2712. doi: 10.1158/1078-0432.CCR-04-2057. [DOI] [PubMed] [Google Scholar]
- Katoh M. Cancer genomics and genetics of FGFR2. Int J Oncol. 2008;33:233–237. [PubMed] [Google Scholar]
- Katoh Y, Katoh M. FGFR2-related pathogenesis and FGFR2-targeted therapeutics. Int J Mol Med. 2009;23:307–311. doi: 10.3892/ijmm_00000132. [DOI] [PubMed] [Google Scholar]
- Kawai A, Naito N, Yoshida A, Morimoto Y, Ouchida M, Shimizu K, et al. Establishment and characterization of a biphasic synovial sarcoma cell line, SYO-1. Cancer Lett. 2004;204:105–113. doi: 10.1016/j.canlet.2003.09.031. [DOI] [PubMed] [Google Scholar]
- Khan J, Bittner ML, Saal LH, Teichmann U, Azorsa DO, Gooden GC, et al. cDNA microarrays detect activation of a myogenic transcription program by the PAX3-FKHR fusion oncogene. Proc Natl Acad Sci USA. 1999;96:13264–13269. doi: 10.1073/pnas.96.23.13264. [DOI] [PMC free article] [PubMed] [Google Scholar]
- Ladanyi M. Fusions of the SYT and SSX genes in synovial sarcoma. Oncogene. 2001;20:5755–5762. doi: 10.1038/sj.onc.1204601. [DOI] [PubMed] [Google Scholar]
- Lobo NA, Shimono Y, Qian D, Clarke MF. The biology of cancer stem cells. Annu Rev Cell Dev Biol. 2007;23:675–699. doi: 10.1146/annurev.cellbio.22.010305.104154. [DOI] [PubMed] [Google Scholar]
- Lubieniecka JM, de Bruijn DR, Su L, van Dijk AHA, Subramanian S, van de Rijn M, et al. Histone deacetylase inhibitors reverse SS18–SSX2-mediated polycomb silencing of the tumor suppressor early growth response 1 in synovial sarcoma. Cancer Res. 2008;68:4303–4310. doi: 10.1158/0008-5472.CAN-08-0092. [DOI] [PubMed] [Google Scholar]
- Mackall CL, Meltzer PS, Helman LJ. Focus on sarcomas. Cancer Cell. 2004;2:175–178. doi: 10.1016/s1535-6108(02)00132-0. [DOI] [PubMed] [Google Scholar]
- Maric D, Fiorio Pla A, Chang YH, Barker JL. Self-renewing and differentiating properties of cortical neural stem cells are selectively regulated by basic fibroblast growth factor (FGF) signaling via specific FGF receptors. J Neurosci. 2007;27:1836–1852. doi: 10.1523/JNEUROSCI.5141-06.2007. [DOI] [PMC free article] [PubMed] [Google Scholar]
- Martens JA, Winston F. Current advances in understanding chromatin remodeling by Swi/Snf complexes. Curr Opin Genet Dev. 2003;13:136–142. doi: 10.1016/s0959-437x(03)00022-4. [DOI] [PubMed] [Google Scholar]
- Mateos-Langerak J, Cavalli G. Polycomb group proteins and long-range gene regulation. Adv Genet. 2008;61:45–66. doi: 10.1016/S0065-2660(07)00002-8. [DOI] [PubMed] [Google Scholar]
- Miraoui H Marie PJ. Fibroblast growth factor receptor signaling crosstalk in skeletogenesis. Sci Signal. 2010;3:re9. doi: 10.1126/scisignal.3146re9. [DOI] [PubMed] [Google Scholar]
- Muruganandan S, Roman AA, Sinal CJ. Adipocyte differentiation of bone marrow-derived mesenchymal stem cells: crosstalk with the osteoblastogenic program. Cell Mol Life Sci. 2009;66:236–253. doi: 10.1007/s00018-008-8429-z. [DOI] [PMC free article] [PubMed] [Google Scholar]
- Nagai M, Tanaka S, Tsuda M, Endo S, Kato H, Sonobe H, et al. Analysis of transforming activity of human synovial sarcoma-associated chimeric protein SYT–SSX1 bound to chromatin remodeling factor hBRM/hSNF2α. Proc Natl Acad Sci USA. 2001;98:3843–3848. doi: 10.1073/pnas.061036798. [DOI] [PMC free article] [PubMed] [Google Scholar]
- Naka N, Takenaka S, Araki N, Miwa T, Nobuyuki H, Yoshioka K, et al. Synovial sarcoma is a stem cell malignancy. Stem Cells. 2010;28:1119–1131. doi: 10.1002/stem.452. [DOI] [PubMed] [Google Scholar]
- Nielsen TO, West RB, Linn SC, Alter O, Knowling MA, O’Connell JX, et al. Molecular characterisation of soft tissue tumours: a gene expression study. Lancet. 2002;359:1301–1307. doi: 10.1016/S0140-6736(02)08270-3. [DOI] [PubMed] [Google Scholar]
- Odelberg SJ, Kohlhoff A, Keating MT. Dedifferentiation of mammalian myotubes induced by msx1. Cell. 2000;103:1099–1109. doi: 10.1016/s0092-8674(00)00212-9. [DOI] [PubMed] [Google Scholar]
- Pardo OE, Latigo J, Jeffery RE, Nye E, Poulsom R, Spencer-Dene B, et al. The fibroblast growth factor receptor inhibitor PD173074 blocks small cell lung cancer growth in vitro and in vivo. Cancer Res. 2009;69:8645–8651. doi: 10.1158/0008-5472.CAN-09-1576. [DOI] [PubMed] [Google Scholar]
- Pretto D, Barco R, Rivera J, Neel N, Gustavson MD, Eid JE. The synovial sarcoma translocation protein SYT–SSX2 recruits b-catenin to the nucleus and associates with it in an active complex. Oncogene. 2006;25:3661–3669. doi: 10.1038/sj.onc.1209413. [DOI] [PubMed] [Google Scholar]
- Pruitt KD, Tatusova T, Maglott DR. NCBI Reference Sequence (RefSeq): a curated non-redundant database of genomes, transcripts and proteins. Nucleic Acids Res. 2007;35(Database issue):D61–D65. doi: 10.1093/nar/gki025. [DOI] [PMC free article] [PubMed] [Google Scholar]
- Schuettengruber B, Chourrout D, Vervoort M, Leblanc B, Cavalli G. Genome regulation by polycomb and trithorax proteins. Cell. 2007;128:735–745. doi: 10.1016/j.cell.2007.02.009. [DOI] [PubMed] [Google Scholar]
- Sekiya I, Larson BL, Smith JR, Pochampally R, Cui JG, Prockop DJ. Expansion of human adult stem cells from bone marrow stroma: conditions that maximize the yields of early progenitors and evaluate their quality. Stem Cells. 2002;20:530–541. doi: 10.1634/stemcells.20-6-530. [DOI] [PubMed] [Google Scholar]
- Villegas SN, Canham M, Brickman JM. FGF signaling as a mediator of lineage transitions—evidence from embryonic stem cell differentiation. J Cell Biochem. 2010;110:10–20. doi: 10.1002/jcb.22536. [DOI] [PubMed] [Google Scholar]
- Watanabe Y, Kameoka S, Gopalakrishnan V, Aldape KD, Pan ZZ, Lang FP, et al. Conversion of myoblasts to physiologically active neuronal phenotype. Genes Dev. 2004;18:889–900. doi: 10.1101/gad.1179004. [DOI] [PMC free article] [PubMed] [Google Scholar]
- Zhang Y, Liu T, Meyer CA, Eeckhoute J, Johnson DS, Bernstein BE, et al. Model-based analysis of ChIP-Seq (MACS) Genome Biol. 2008;9:R137. doi: 10.1186/gb-2008-9-9-r137. [DOI] [PMC free article] [PubMed] [Google Scholar]
- Zhao C, Deng W, Gage FH. Mechanisms and functional implications of adult neurogenesis. Cell. 2008;132:645–660. doi: 10.1016/j.cell.2008.01.033. [DOI] [PubMed] [Google Scholar]
Associated Data
This section collects any data citations, data availability statements, or supplementary materials included in this article.