

Abstract
We report a statistical mixed model for assessing the importance of climate and non-climate drivers of interannual variability in dengue fever in southern coastal Ecuador. Local climate data and Pacific sea surface temperatures (Oceanic Niño Index [ONI]) were used to predict dengue standardized morbidity ratios (SMRs; 1995–2010). Unobserved confounding factors were accounted for using non-structured yearly random effects. We found that ONI, rainfall, and minimum temperature were positively associated with dengue, with more cases of dengue during El Niño events. We assessed the influence of non-climatic factors on dengue SMR using a subset of data (2001–2010) and found that the percent of households with Aedes aegypti immatures was also a significant predictor. Our results indicate that monitoring the climate and non-climate drivers identified in this study could provide some predictive lead for forecasting dengue epidemics, showing the potential to develop a dengue early-warning system in this region.
Introduction
Dengue fever is the most important mosquito-borne viral disease affecting humans. In Latin America and the Caribbean, over 1.5 million cases were reported from 36 countries and territories in 2010.1 The burden of disease from dengue in this region is comparable to the burden of malaria, hepatitis B, or roundworm infection.2
Local climate and the El Niño–Southern Oscillation (ENSO) are potentially important drivers of the interannual variability (i.e., year-to-year variation) in dengue fever transmission. ENSO is a fluctuation between unusually warm (El Niño) and cold (La Niña) sea surface temperatures (SSTs) in the tropical Pacific Ocean.3 El Niño and La Niña events typically recur every 2–7 years and develop in association with large-scale oscillations in an atmospheric pressure pattern spanning the tropical Indian and Pacific Oceans, known as the Southern Oscillation. ENSO influences the interannual variability in weather patterns and the likelihood of regional extreme events, such as droughts and floods, across the globe.4
The theoretical causal mechanisms linking ENSO to dengue are based on the connections between ENSO and local climate anomalies in certain regions of the world and the influence of climate on the dengue mosquito vector and virus. Precipitation can influence the availability of mosquito larval habitat,5–7 and ambient temperatures influence rates of mosquito larval development,8–11 adult biting activity,12 the gonotrophic cycle,13 and viral replication in the mosquito (extrinsic incubation period).14,15
However, the influence of ENSO and local climate on dengue transmission is debated in the literature, with previous studies reporting inconsistent interannual associations. A previous study in Thailand found evidence that 2- to 3-year cycles of dengue incidence were linked to ENSO and climate, although the mechanisms were unclear, because they found that dengue increased prior to changes in ENSO.16 Dengue transmission in Mexico has been shown to be strongly associated with ENSO and minimum temperature, although not with precipitation.17 Dengue hemorrhagic fever (DHF) epidemics in Colombia, Suriname, French Guiana, and Indonesia were found to be associated with El Niño events, although the effects of El Niño on local climate varied by region.18
Other studies found that ENSO and local climate were not important determinants of interannual variability in dengue incidence in Mexico, Puerto Rico, and Thailand,19–22 highlighting the importance of identifying and assessing the effects of non-climate factors in analyses of interannual variability. Potential non-climate drivers include intrinsic factors (e.g., introduction of new serotypes, herd immunity, and strain-cross immunity)23 and other social–ecological drivers influencing vector populations and human exposure, such as vector control interventions, changes in urban poverty and infrastructure, land use change, and human movement.24,25
Despite the debate, it is generally understood that dengue is a climate-sensitive disease, and accordingly, the World Health Organization (WHO) has recommended developing climate-driven early-warning systems (EWSs) for dengue fever similar to those systems developed for malaria in Africa.26,27 In developing an EWS, researchers should consider the effects of both climate and non-climate factors, although climate is a key predictor, because climate conditions can be projected several months ahead of time (e.g., seasonal climate forecasts). An EWS that predicts seasons and regions with high or low disease transmission would allow the public health sector to conduct more effective vector control.28 To date, there has been limited success in developing an operational EWS for dengue, although several studies have shown the potential to develop such a system.29–31
Aims of the study.
The objective of this study is to assess the importance of climate and non-climate drivers of interannual variability in dengue fever in southern coastal Ecuador. We developed a statistical mixed model to quantify the impact of climatic variability on dengue transmission, while controlling for observed and unobserved confounding factors such as serotype circulation, mosquito abundance, and vector control interventions.
Study area.
El Oro is a coastal province in southern Ecuador, bordering Peru in the south, the Pacific Ocean in the west, and the Andean foothills in the east. The province has 14 districts with a total population of 600,659 and a land area of 5,818 km2 (3°03′ S to 3°53′ S, 80°16′ W to 79°21′ W). According to the National Institute of Statistics and Census (INEC), more than 85% of people in the province live in the coastal lowlands, where dengue transmission is concentrated. However, in recent years, dengue has been documented in mountain valleys up to 650 m above sea level (m.a.s.l). The Aedes aegypti mosquito is the only known dengue vector in Ecuador.
As in most of Latin America, dengue fever was eradicated from Ecuador in the 1950s. In 1988, the first new cases of dengue were reported in the country, and in 1990, the first cases of dengue were reported in El Oro province. Since 2003, all four serotypes have circulated through the province, and in 2005, the first cases of DHF were reported. In 2010, the province experienced its worst dengue epidemic, with approximately 3,900 cases of dengue fever and 108 cases of DHF. During the epidemic, 48% of cases from the province were reported from the capital city of Machala, where 41% of the population of the province resides.
Dengue fever transmission in El Oro follows a distinct seasonal pattern, with cases peaking during the rainy season from February to May (Figure 1). The climate of El Oro is characterized by a warmer, rainy season from December to May and a cooler, dry season the rest of the year. In the capital city of Machala, average annual rainfall is 675 mm, with 88% of the annual rainfall occurring during the rainy season. Temperatures vary slightly, with maximum temperatures in Machala ranging from 26°C during the dry season to 31°C during the wet season. The seasons are caused by the annual north–south movement of the intertropical convergence zone, which corresponds with the north–south movement of the interface of the cold Humboldt (Peru) Current with the warmer Southern Equatorial Current off the coast of Ecuador in the Pacific Ocean.32 On average, positive anomalies in Pacific SSTs are associated with positive anomalies in rainfall and air temperature in southern coastal Ecuador.32 ENSO events cause significant year-to-year variability in rainfall, with strong El Niño events leading to flooding and loss of life in coastal regions of Ecuador.33,34 During the exceptionally strong 1997–1998 El Niño, annual rainfall in Machala surpassed 1,800 mm. This pattern of rainfall is less clear in other regions of Ecuador that are also strongly influenced by atmospheric perturbations from the eastern Amazonian region.35
Figure 1.

Mean annual cycle of (A) dengue SMR for El Oro province and (B) precipitation (bars), mean temperature (solid line), maximum and minimum temperature (dashed lines) from Machala, El Oro (1995–2010).
Dengue control.
Reported cases of dengue fever in Ecuador have increased over the last decade despite ongoing vector control interventions. Dengue is managed by the National Service for the Control of Vector-Borne Diseases in the Ministry of Health and controlled primarily through year-round vector control campaigns that intensify leading up to and during the rainy season. Focal vector control is also conducted in neighborhoods with reported cases of dengue. Dengue control includes fumigation from trucks, indoor residual spraying, use of organophosphate larvicides, destruction of potential mosquito breeding containers, and community education campaigns.
Data and Methods
Epidemiological data.
Clinically suspected cases of dengue fever are reported to a mandatory disease surveillance system operated by the Ministry of Health, which started maintaining records of dengue in the early 1990s. Monthly cases of dengue reported to the Ministry of Health from El Oro province (1995–2010) are used in this study rather than laboratory-confirmed cases, because only a small proportion of reported cases were confirmed historically. The Virology Surveillance System, operated by the National Institute of Hygiene and Tropical Medicine in the Ministry of Health, reports the presence of dengue serotypes circulating in the country. We converted this information to the total number of dengue serotypes circulating in the country per month (2001–2010). No information was provided on the number of reported dengue cases for each serotype.
For ease of interpretation, we calculated the monthly dengue standardized morbidity ratio (SMR), the ratio of observed (yt) to expected (et) dengue cases, to compare observed results with model results. Expected cases are calculated as the population at risk (pt) for dengue each month multiplied by the overall ratio of dengue for the entire time period in El Oro 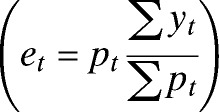 . The population of the province was obtained from national censuses (1990, 2001, and 2010) conducted by INEC, and the population in the intervening years was estimated assuming linear growth. The model formulated below predicts the counts of dengue cases (yt) but includes the expected number of cases as an offset, therefore predicting the dengue SMR (or relative risk) at each time step.
Entomological data.
The National Service for the Control of Vector-Borne Diseases provided quarterly (2001–2010) estimates of various indicators of vector abundance for El Oro: Breteau Index (BI), House Index (HI), and an estimate of vector control efforts. The BI is the number of containers with Ae. aegypti immatures per 100 households, and the HI is the number of households with Ae. aegypti immatures per 100 households. Monthly vector control efforts were estimated by the average number of vector control technician labor days and kilograms of larvicide used.
Climate data.
Daily precipitation, mean temperature (Tmean), maximum temperature (Tmax), and minimum temperature (Tmin) for the study period were provided by the National Institute of Meteorology and Hydrology from the Granja Santa Ines weather station located in Machala (3°17′26″ S, 79°54′5″ W, 5 m.a.s.l.). This station provided the most complete climatological time series for the coastal region of El Oro. To fill gaps in the time series, a linear statistical model was formulated to predict missing station data using gridded temperature and rainfall data from the grid box within which the meteorological station is located. Rainfall data were obtained from the Global Precipitation Climatology Project (GPCP).36 Temperature data were obtained from the European Re-Analysis (ERA)–Interim Reanalysis daily from the European Center for Medium-Range Weather Forecasts (ECMWF) Data Server.
SST data.
The National Oceanic and Atmospheric Administration (NOAA) Climate Prediction Center of NOAA/National Weather Service provided a time series of the Oceanic Niño Index (ONI) defined as the 3-month running mean of SST anomalies (1971–2000 base period) in the Niño 3.4 region (5°N to 5° S, 170° to 120° W).37 The Climate Prediction Center defines ENSO events when SST anomalies are greater than or equal to +0.5°C for 5 consecutive months for warm (El Niño) events and less than or equal to −0.5°C for cold (La Niña) events. During the study period (1995–2010), six El Niño and five La Niña events were recorded, including the 1997–1998 El Niño, one of the strongest events ever recorded (Figure 2C).
Figure 2.

Three-month running mean anomalies of (A) the dengue SMR in El Oro province, (B) precipitation and mean temperature from Machala, El Oro, and (C) SST in the Niño 3.4 region, also known as ONI.
Statistical analysis.
We analyzed the role of climatic and non-climatic factors in interannual variability in dengue SMR in El Oro by developing two sets of statistical models using data from 1995 to 2010 (climate only) and from 2001 to 2010 (climate and non-climate).
We first calculated monthly anomalies for precipitation, Tmin, Tmean, and Tmax using the monthly means of each variable from the 16-year time series (1995–2010) (Figure 1B). We then used exploratory data analysis to identify the climate variables (lagged up to 6 months) that were most strongly correlated to the log of dengue SMR for inclusion in the model (Figure 3). We also tested non-linear terms and interactions in the model.
Figure 3.

Scatter matrix showing the relations between log dengue SMR and anomalies in climate variables at the most significant lags: SMR versus precipitation at a 1-month lag, SMR versus minimum temperature at a 2-month lag, and SMR versus ONI at a 3-month lag. Solid line = linear regression curves for 1995–2010; dashed line = linear regression curves for 2001–2010.
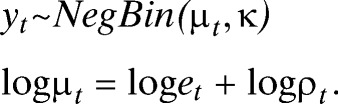
Using the modeling framework proposed in recent studies of dengue in Brazil, a generalized linear mixed model (GLMM) was formulated to assess the importance of significant climate variables and other non-climatic confounding factors as drivers of interannual variability in dengue transmission in El Oro province.30,38 A negative binomial model was used to account for overdispersion found in the dengue count data (extra-Poisson variation),39,40 where yt is monthly dengue cases, μt is mean cases, et is expected cases, and ρt is the dengue relative risk (Eq. 1). By including the expected number of cases of dengue as an offset, we estimated the relative risk (SMR) of dengue using a linear combination of local climate covariates, a large-scale climate driver (ONI), and non-climatic confounding factors:
 |
Using climate and dengue data from 1995 to 2010, we developed a set of models to understand the influence of each factor on dengue relative risk (log SMR), starting with a seasonal base model and gradually adding climate and random effects (Figure 6A and B and Tables 1 and 2 show results). The inclusion of random effects in the model framework allowed us to account for unknown or unobserved confounding factors in the disease system by introducing an extra source of variability into the model.41 Model parameters were estimated within a Bayesian framework using Markov Chain Monte Carlo (MCMC) and were considered to be statistically significant if their 95% credible interval did not contain zero. The Bayesian approach accounts for parameter uncertainty by assigning prior distributions to the parameters.42 An advantage of this approach is that the associated MCMC sampling yields samples from full posterior predictive distributions, which automatically incorporate all components of variance at the different levels in the model. Therefore, a full assessment of prediction uncertainty can be more easily obtained with the Bayesian MCMC estimation than the more traditional maximum likelihood approach.
Figure 6.

Observed dengue SMR (solid line) and predicted SMR (dashed/dotted line; shaded area = 95% prediction interval) for best models (not including yearly random effects): (A and B) the 1995–2010 model including climate information and (C and D) the 2001–2010 model including climate, vector, and serotype information (dashed line) and only vector and serotype information (dotted line).
Table 1.
Adequacy results for models to predict dengue SMR from 1995 to 2010 and from 2001 to 2010
| Model | log ρt | DIC | R2LR |
|---|---|---|---|
| 1995–2010 model | |||
| Base | α + βt′(t) | 2,079.52 | 0.30 |
| Climate effects | α + βt′(t) + ∑γjxjt | 2,032.13 | 0.46 |
| Yearly random effects | α + βt′(t) + δT′(t) | 1,996.45 | 0.57 |
| Climate and random effects | α + βt′(t) + ∑γjxjt + δT′(t) | 1,980.12 | 0.62 |
| 2001–2010 model | |||
| Base | α + βt′(t) | 1,313.18 | 0.44 |
| Climate effects | α + βt′(t) + ∑γjxjt | 1,305.28 | 0.49 |
| Non-climate effects | α + βt′(t) + ∑εjzjt | 1,286.63 | 0.56 |
| Climate and non-climate effects | α + βt′(t) + ∑γjxjt + ∑εjzjt | 1,276.67 | 0.61 |
| Climate, random, and non-climate effects | α + βt′(t) + ∑γjxjt + δT′(t) + ∑εjzjt | 1,242.21 | 0.72 |
Models are ranked by the DIC and a likelihood ratio R2LR statistic.
Table 2.
Posterior means and 95% credible intervals (CIs) for the parameters associated with the explanatory variables in the best models (allowing for random effects) fitted to data from 1995 to 2010 and from 2001 to 2010
| Parameter | Posterior mean (95% CI) 1995–2010 model | Posterior mean (95% CI) 2001–2010 model | |
|---|---|---|---|
| Precipitation | x1 | 0.09 (0.03, 0.16) | 0.08 (−0.01, 0.18) |
| Tmin | x2 | 0.02 (−0.02, 0.09) | −0.08 (−0.42, 0.28) |
| ONI | x3 | 0.24 (0.05, 0.42) | 0.25 (0.00, 0.52) |
| HI | z1 | – | 0.39 (0.17, 0.60) |
| Number of circulating serotypes | |||
| One known serotype | z2 | – | 0.20 (−0.12, 0.53) |
| Two or more known serotypes | z2 | – | 0.48 (−0.04, 0.97) |
The base model included an intercept(α) and temporally autocorrelated random effects (βt′(t)) for each calendar month to account for the annual cycle of dengue (Figure 4). Because only part of the dengue annual cycle may be attributable to climatic conditions, the inclusion of this effect allowed us to account for other seasonal confounding variables, such as seasonal population movements. This seasonal term is included as a structured first-order autoregressive month effect to account for temporal serial correlation in dengue transmission (e.g., dengue relative risk in 1 month may depend on the risk in the previous month). Because the model is implemented in a Bayesian framework, the month effect is assigned a random walk or first difference prior distribution, in which each effect is derived from the immediately preceding effect.42 To test the significance of the autocorrelation, a posterior distribution of the autocorrelation function (ACF) of the month effects was calculated. The mean ACF at a 1-month lag was 0.82 with 95% credible interval (0.75, 0.85). The positive and statistically significant temporal structure in the seasonal term indicated that it was appropriate to include autocorrelation in the month effect.
Figure 4.

Posterior means and 95% credible intervals at log-linear level for (A) autocorrelated monthly and (B) yearly random effects in the 1995–2010 model.
Next, a climate model was fitted that included the base model and the important climate variables identified through exploratory data analysis  . We then developed a non-climate model by removing the climate variables and replacing these variable with exchangeable non-structured random effects for each year (δT′(t)) to account for interannual changes in dengue risk attributable to factors that we are unable to measure for the time period 1995–2010, such as changes in vector control practices (Figure 4B). Note that we tested autocorrelation in the yearly random effects to potentially account for the effects of lasting immunity between dengue outbreaks. However, when assessing the posterior distribution of the ACF at 1-year lag, the correlation was found to be weak (−0.09) and not statistically significant (i.e., the 95% credible interval contained zero [−0.33, 0.14]). In the final model, we included both climate variables and yearly random effects with the base model.
The goodness of fit of all models was assessed using the deviance information criterion (DIC)43 and an R2LR statistic for mixed effects models based on a likelihood ratio test.44 Smaller values of DIC indicate a better-fitting model, whereas 0 ≤ R2LR ≤ 1, with R2LR = 1 corresponding to a perfect fit and R2LR ≥ 0 valid for any reasonable model specification. We also assessed the model fitness by comparing the observed historical dengue SMR with the posterior predictive distribution of dengue SMR.45 The posterior predictive distribution of dengue served as a reference distribution and was obtained by simulating new pseudo-observations using samples from the posterior distribution of the parameters in the model.
We developed a second set of models to further investigate potential non-climatic drivers of interannual variability in dengue risk using a subset of the data (2001–2010) for which additional information on non-climate factors  was available, including the number of dengue serotypes circulating in the country, entomological indices (HI and BI), and vector control intensity (number of worker days and kilograms of larvicide) (Figure 5). Dengue serotype data were converted into a categorical variable with three levels (0 = no information [aliased to the intercept], 1 = one known serotype in circulation, 2 = two or more known serotypes in circulation). We conducted exploratory analyses to identify the most important non-climate variables and lags for inclusion in the model, and then, we developed this set of models using the same procedure described above. We tested the relative influence of the 1997–1998 El Niño on the ONI parameter by comparing the 1995–2010 data with the 2001–2010 data.
Figure 5.

Non-climate variables included in the 2001–2010 model. Log dengue SMR versus (A) the HI (percent of households with Ae. aegypti immatures) at a 1-month lag and (B) the number of dengue serotypes circulating in Ecuador at a 3-month lag.
Results
From 1995 to 2010, 18,761 cases of dengue were reported from El Oro province, with 13,852 cases reported from 2001 to 2010. The best 1995–2010 model explained 62% of the variability in dengue transmission, and the best 2001–2010 model explained 72% of the variability. ONI and HI were the most important predictors of dengue in this region. Details on these findings follow.
1995–2010 model.
The most important climate variables associated with dengue were anomalies in precipitation at a 1-month lag, anomalies in Tmin at a 2-month lag, and ONI at a 3-month lag. These variables had positive and statistically significant associations with dengue SMR. Precipitation, Tmin, and ONI had significant associations at other lags but at lower magnitudes. Anomalies in Tmax and Tmean were positively associated with dengue at a lower magnitude than Tmin and did not improve the model fit. Polynomial terms and interactions were not found to be statistically significant.
The best model explained 62% of the variability in dengue transmission and included climate effects, yearly random effects, and monthly random effects (Tables 1 and 2). The seasonal base model (monthly random effects) alone explained 30% of the variation in dengue transmission. When climate effects were added to the base model, an additional 16% of variation was explained (46% total), and the goodness of fit improved. In the final model, adding yearly random effects to climate effects and the base model explained an additional 16% of the variation in dengue (62% total). The influence of yearly random effects can be interpreted as the effect of unobservable non-climate annual factors, such as population immunity or vector control campaigns. Tmin was not significant in the final model.
To assess the predictive ability of the model, posterior predictive distributions (posterior predictive mean and 95% prediction intervals) of dengue SMR were simulated using parameter estimates from the best model (that also account for unknown random effects) but omitting the yearly random effects from the prediction calculation (Figure 6). The random effects are important to allow more accurate parameter estimates for climate and other variable. However, they are not useful in a prediction model, because they represent unknown factors. The 1995–2010 model was able to correctly capture the interannual and intraseasonal variability in dengue risk, although in some instances, the model predicted higher dengue risk than was observed (Figure 6A and B).
2001–2010 model.
The most important non-climate variables associated with dengue were HI at a 1-month lag and the number of dengue serotypes at a 3-month lag. These variables were included in the model as non-climate effects, and the same climate variables were included as in the 1995–2010 model. Variables accounting for vector control efforts were not statistically significant.
The best model explained 72% of the variability in dengue transmission and included climate, non-climate, yearly, and monthly random effects (Tables 1 and 2). The seasonal base model alone explained 44% of dengue transmission. The goodness of fit of the model improved when climate and non-climate effects were added to the base model independently, although non-climate effects explained 7% more of the variation than climate effects. Climate and non-climate effects together explained 61% of the variability in dengue, the same proportion explained by the best 1995–2010 model. In the final 2001–2010 model, yearly random effects explained an additional 11% of the variability. Anomalies in precipitation, anomalies in Tmin, and the number of dengue serotypes were not statistically significant in the final model. The lack of association between dengue and local climate factors for this time period is apparent in Figure 3. The association between dengue and the serotype variables remained positive, although the serotype variables were not significant.
To assess the predictive ability of the 2001–2010 model, we also simulated the posterior predictive distributions of dengue SMR using parameter estimates from the best model but omitting the yearly random effects (Figure 6C and D). This model captured some of the interannual variability in dengue risk, although it predicted higher dengue risk than was observed in some instances, similar to the 1995–2010 model. Predictions including both climate and non-climate information (Figure 6D, dashed line) and only non-climate information (Figure 6D, dotted line) are shown, highlighting years where the inclusion of climate information improved the dengue prediction (for example, in 2003, 2009, and 2010).
ONI parameter.
Our comparison of the ONI parameter from 1995 to 2010 and from 2001 to 2010 time periods indicated that it is a potentially robust predictor of dengue. For both time periods, the parameter had similar positive associations with dengue (Figure 3), posterior means (Table 2), and posterior distributions, although the uncertainty in the ONI parameter in the 2001–2010 model was greater (Figure 7). This result suggests that the strong 1997–1998 El Niño event did not influence the 1995–2010 model.
Figure 7.

Posterior distribution of the ONI parameter from the 1995–2010 model (dashed curve; includes the 1997–1998 El Niño event) and the 2001–2010 model (solid curve).
To compare the effect of the ONI parameter with the other model parameters, we estimated the relative risk for a one-unit increase in xjt by calculating eγj (where j = 3). According to the 1995–2010 model, a 1°C increase in SST anomaly in the Niño 3.4 region (ONI) would result in approximately a 27% (e0.24 = 1.27) increase in dengue cases 3 months later, and similarly, the 2001–2010 model predicted a 28% increase. In comparison, a 1% increase in the proportion of households with Ae. aegypti immatures (HI) would result in a 48% increase in dengue cases 1 month later, and a 1-mm increase in rainfall anomaly would result in an 8% increase in dengue cases 1 month later according to the 2001–2010 model.
Discussion
The results of this study indicate that ENSO, local climate, vector densities, and the number of serotypes circulating influence interannual variability in dengue fever transmission in southern coastal Ecuador, highlighting the importance of considering both climate and non-climate information in developing predictive models for dengue. The modeling approach adopted in this study allowed us to separate the seasonal, climate, and non-climate effects influencing dengue variability in this region and quantify the potential influence of unobserved factors on the dengue transmission system.
Climate drivers.
ONI was the most important climate variable. More cases of dengue were reported than expected during El Niño events, which was indicated by a positive association with the ONI. Monitoring the evolution of ENSO in the Pacific Ocean could provide a lead time of at least 3 months to forecast dengue epidemics in this region. Additionally, ONI remains the most important climate variable when Tmin and precipitation are included in the models, indicating that the influence of ENSO on dengue extends beyond these variables, which was found in a previous study in Mexico.17
We found that ENSO has a strong influence on anomalies in Tmin, which was indicated by a positive association during both time periods (1995–2010 and 2001–2010) (Figure 3). Anomalies in Tmax and Tmean were also positively associated with ENSO, although the association was weaker. Although Tmin had significant positive associations with dengue in preliminary analyses, it was not significant in either final model, possibly because the effect of Tmin was captured by ONI.
The influence of ENSO on precipitation was less clear. We found a weak positive association between precipitation and ENSO from 1995 to 2010 and no association from 2001 to 2010, suggesting that precipitation may be positively associated with only very strong ENSO events, such as the 1997–1998 El Niño apparent in Figure 2. Similarly, precipitation was weakly associated with dengue from 1995 to 2010 but not from 2001 to 2010. The effect of strong rainfall events on dengue risk in this region should be investigated further.
Previous studies from the Americas found that Tmin and precipitation were significant predictors of dengue risk.17,46–48 Likewise, field studies in this region found that Tmin and precipitation were the most important local climate predictors of seasonal Ae. aegypti population dynamics (Stewart-Ibarra AM and others, unpublished data). Other studies have shown that Tmin plays an important role in regulating Ae. aegypti feeding behavior12 and influences Ae. aegypti adult and immature abundance.49,50 Air temperature also influences dengue virus replication in the mosquito,15 with shorter extrinsic incubation periods at elevated temperatures.14 Daily temperature fluctuations also influence dengue transmission dynamics by reducing vector life spans and vector susceptibility to viral infection,51 although the effect may be minor in this region, because average diurnal temperature ranges are relatively small (maximum of 8.6°C in April and minimum of 5.8°C in October). The average monthly minimum temperature in this region ranges from 20.8°C in August (dengue low season) to 23.9°C in April (dengue high season), temperatures that fall at the lower end of the optimal range for endemic dengue transmission (20–30°C).10 This finding suggests that dengue transmission in this region may be especially sensitive to changes in the minimum temperature caused by ENSO or other climate forcings.
The effect of precipitation on dengue risk is confounded by interactions with human behavior (e.g., water storage) and local social–ecological conditions (e.g., housing condition and piped water infrastructure) influencing vector abundance. It is generally understood that rainfall can increase dengue risk by increasing the availability of mosquito larval habitats. However, studies in Puerto Rico showed that, in communities where the key Ae. aegypti breeding sites are year-round water storage containers, vector densities were less sensitive to seasonal variation in rainfall.52 Other studies found that rainfall shortages can increase dengue risk by increasing the need for water storage around the household.53,54 Therefore, to understand and predict the effect of rainfall on dengue risk may require a finer-scale modeling approach that incorporates these context-specific social–ecological parameters.
Although precipitation and Tmin were not statistically significant after we added non-climatic factors in the 2001–2010 model, we believe that these local meteorological variables should remain in the model formulation because of the mechanistic importance of these variables, and the strength of the relationship should be continually assessed as new data become available.
Non-climate drivers.
Non-climatic factors (i.e., HI and serotypes) also had an important effect on dengue transmission, explaining an additional 12% of the variability when added to the seasonal base model for 2001–2010. Dengue risk was positively associated with Ae. aegypti immature abundance at a 1-month lag, indicated by the HI, which was significant even with the inclusion of climate factors and seasonality. This result suggests that interannual variability in Ae. aegypti abundance may be influenced by non-climatic factors, such as changes in urban infrastructure and vector control interventions, although the vector control variables were not significant in the model. Given that HI is a crude measure of vector abundance, better measures, such as pupal indices, could potentially improve the model prediction.
Dengue risk was also positively associated with the number of serotypes circulating in the country at a 3-month lag, likely because of outbreaks caused by the introduction of new serotypes to susceptible populations and increased reporting of severe cases caused by secondary infections. However, in the final model, the serotype variable was no longer statistically significant; the lack of an observed effect may be because of the coarse scale of the serological data (country level). Ideally, we would analyze a time series of the serotype-specific cases of dengue reported in the province each month; however, these data are not yet available. Nonetheless, it is interesting to note the positive relationship with the number of serotypes and dengue relative risk, suggesting that improved serological surveillance data could provide additional predictive lead time in a dengue EWS.
Yearly random effects explained an additional 11% of the variability in the 2001–2010 model with climate and non-climate information, indicating the potential to improve the model fit by investigating these currently unknown annual factors (e.g., herd immunity and intensive fumigation efforts). The inclusion of the yearly random effects allowed us to identify specific time periods where additional investigations should try to isolate confounding factors that may alter dengue risk. Figure 4 shows the posterior mean and 95% credible intervals for the autocorrelated monthly and yearly random effects, illustrating the annual cycle present in the dengue data (Figure 4A) and the years that contributed to the interannual variability in dengue (Figure 4B). For example, 2002 was an unusually low dengue year, despite the fact that an ENSO event did not take place in late 2001 or early 2002. DENV3, first introduced to the country in 2000, was the dominant strain circulating in 2001 and 2002. It is possible that there were fewer cases of dengue in 2002 because of herd immunity. Future studies could explore such hypotheses through the use of simulation models.
Developing a dengue EWS.
Statistical and dynamical models that predict patterns of dengue transmission are important decision support tools that can ultimately become part of a dengue EWS by linking models to real-time information from seasonal climate forecasts, disease surveillance systems, and monitoring of other social–ecological risk factors.26 Probabilistic predictions of dengue risk produced by these models are translated into epidemic warnings that trigger a public health preparedness plan for actions at different warning levels. A dengue EWS would provide public health decision-makers with greater lead time to proactively prevent dengue outbreaks through targeted vector control interventions and rapid response actions, such as media and community outreach campaigns to eliminate breeding containers.
The findings from this study provide evidence for the role of climate and non-climate drivers in interannual variability in dengue transmission in this region, laying the groundwork for developing a dengue EWS. The next steps will be to (1) investigate the yearly random effects described above and (2) quantify how much predictive lead time can be gained by replacing observed climate information with seasonal (3 month) hindcasts (i.e., retrospective forecasts) of both local climate conditions and the evolution of Pacific SSTs. The use of seasonal climate forecasts is promising given that Ecuador is located in a region of the world where seasonal forecasts show some skill (accuracy) because of the strong influence of ENSO events in the region.55,56 Forecasting centers such as the ECMWF produce such forecasts with lead times up to 6 months. However, the greater the forecast lead time, the greater the uncertainty in the predictions of both the climate and the disease.
After the predictive model is developed, the next step is to evaluate its efficacy for the decision-making process by assessing the ability of the model to predict epidemics successfully and the tendency of the system to issue false alarms or miss an epidemic. Out-of-sample data should be used to test how well future unobserved epidemics can be forecast.38 In addition, there must be careful consideration of how the probabilistic forecasts are communicated to the public health end-users to ensure that the information is appropriately interpreted and that the uncertainties associated with climate and disease forecasts are well-understood.57
Disentangling the extrinsic and intrinsic drivers of dengue to develop an EWS is a major challenge given the relatively short time series of dengue data available in most countries. Ultimately, understanding the mechanisms linking ENSO and other factors to dengue risk will require a finer-scale analysis of local social–ecological conditions. However, it is clear from this study that both climatic and non-climatic factors should be considered when developing a dengue EWS.
Conclusions.
Despite vector control efforts, dengue is a growing public health problem in Ecuador and across the tropics and subtropics. This research is contributing to an ongoing collaborative effort by the National Institute of Meteorology and Hydrology and Ministry of Health of Ecuador to develop decision support tools that integrate climate and non-climate data to better manage dengue. This study is the first published study of dengue fever and climate and non-climate drivers in Ecuador, showing important interrelationships among ENSO, local climate, vector, virus, and dengue dynamics that provide the foundation to develop a dengue EWS.
ACKNOWLEDGMENTS
Many thanks to M. Borbor of the Ministry of Environment; E. Beltran, J. Palomeque, J. Real, M. Silva, and T. Ordoñez of the Ministry of Health; and R. Mejia, V. Borbor, and C. Recalde of the National Institute of Meteorology and Hydrology for providing data and supporting ongoing climate–health initiatives in Ecuador. The authors thank C. Hall and T. Endy for their insightful comments in preparation of this manuscript and T. Bailey for advice regarding the statistical model. The authors would like to thank the coordinators of the Columbia University International Research Institute's summer institute on Climate Information for Public Health where this collaboration first developed. We also acknowledge support from the Universidad de Especialidades Espiritu Santo.
Footnotes
Financial support: A.M.S.-I. received partial support from a Fulbright Institute of International Education fellowship. R.L. received partial funding from European Union Projects Quantifying Weather and Climate Impacts on Health in Developing Countries (QWeCI) Grant 243964 and Dengue Research Framework for Resisting Epidemics in Europe (DENFREE) Grant 282 378 funded by the European Commission's Seventh Framework Research Programme.
Authors' addresses: Anna M. Stewart-Ibarra, Center for Global Health and Translational Science, State University of New York Upstate Medical University, Syracuse, NY, E-mail: stewarta@upstate.edu. Rachel Lowe, The Catalan Institute of Climate Sciences (IC3), Barcelona, Spain, E-mail: rachel.lowe@ic3.cat.
References
- 1.PAHO Number of Reported Cases of Dengue and Severe Dengue (DS) in the Americas by Country (1995–2011) 2011. www.who.int/denguenet Available at. Accessed November 15, 2011.
- 2.WHO . The Global Burden of Disease: 2004 Update. Geneva: World Health Organization; 2008. [Google Scholar]
- 3.Philander SG. El Niño, La Niña, and the Southern Oscillation. San Diego, CA: Academic Press; 1990. [DOI] [PubMed] [Google Scholar]
- 4.Lyon B, Barnston AG. ENSO and the spatial extent of interannual precipitation extremes in tropical land areas. J Clim. 2005;18:5095–5109. [Google Scholar]
- 5.Moore CB, Cline BL, Ruiz-Tiben E, Lee D, Romney-Joseph H, Rivera-Correa E. Aedes aegypti in Puerto Rico: environmental determinants of larval abundance and relation to dengue virus transmission. Am J Trop Med Hyg. 1978;27:1225–1231. doi: 10.4269/ajtmh.1978.27.1225. [DOI] [PubMed] [Google Scholar]
- 6.Barrera R, Amador M, Clark GG. Use of the pupal survey technique for measuring Aedes aegypti (Diptera: Culicidae) productivity in Puerto Rico. Am J Trop Med Hyg. 2006;74:290–302. [PubMed] [Google Scholar]
- 7.Montgomery BL, Ritchie SA. Roof gutters: a key container for Aedes aegypti and Ochlerotatus notoscriptus (Diptera: Culicidae) in Australia. Am J Trop Med Hyg. 2002;67:244–246. doi: 10.4269/ajtmh.2002.67.244. [DOI] [PubMed] [Google Scholar]
- 8.Bar-Zeev M. The effect of temperature on the growth rate and survival of the immature stages of Aedes aegypti (L) Bull Entomol Res. 1958;49:157–163. [Google Scholar]
- 9.Rueda LM, Patel KJ, Axtell RC, Stinner RE. Temperature-dependent development and survival rates of Culex quinquefasciatus and Aedes aegypti (Diptera: Culicidae) J Med Entomol. 1990;27:892–898. doi: 10.1093/jmedent/27.5.892. [DOI] [PubMed] [Google Scholar]
- 10.Tun-Lin W, Burkot TR, Kay BH. Effects of temperature and larval diet on development rates and survival of the dengue vector Aedes aegypti in north Queensland, Australia. Med Vet Entomol. 2000;14:31–37. doi: 10.1046/j.1365-2915.2000.00207.x. [DOI] [PubMed] [Google Scholar]
- 11.Mohammed A, Chadee DD. Effects of different temperature regimens on the development of Aedes aegypti (L.) (Diptera: Culicidae) mosquitoes. Acta Trop. 2011;119:38–43. doi: 10.1016/j.actatropica.2011.04.004. [DOI] [PubMed] [Google Scholar]
- 12.Yasuno M, Tonn RJ. A study of biting habits of Aedes aegypti in Bangkok, Thailand. Bull World Health Organ. 1970;43:319–325. [PMC free article] [PubMed] [Google Scholar]
- 13.Pant CP, Yasuno M. Field studies on the gonotrophic cycle of Aedes aegypti in Bangkok, Thailand. J Med Entomol. 1973;10:219–223. doi: 10.1093/jmedent/10.2.219. [DOI] [PubMed] [Google Scholar]
- 14.Watts DM, Burke DS, Harrison BA, Whitmire RE, Nisalak A. Effect of temperature on the vector efficiency of Aedes aegypti for dengue 2 virus. Am J Trop Med Hyg. 1986;36:143–152. doi: 10.4269/ajtmh.1987.36.143. [DOI] [PubMed] [Google Scholar]
- 15.Thu HM, Aye KM, Thein S. The effect of temperature and humidity on dengue virus propagation in Aedes aegypti mosquitoes. Southeast Asian J Trop Med Public Health. 1998;29:280–284. [PubMed] [Google Scholar]
- 16.Cazelles B, Chavez M, McMichael AJ, Hales S. Nonstationary influence of El Niño on the synchronous dengue epidemics in Thailand. PLoS Med. 2005;2:e106. doi: 10.1371/journal.pmed.0020106. [DOI] [PMC free article] [PubMed] [Google Scholar]
- 17.Colón-González FJ, Lake IR, Bentham G. Climate variability and dengue fever in warm and humid Mexico. Am J Trop Med Hyg. 2011;84:757–763. doi: 10.4269/ajtmh.2011.10-0609. [DOI] [PMC free article] [PubMed] [Google Scholar]
- 18.Gagnon AS, Bush ABG, Smoyer-Tomic KE. Dengue epidemics and the El Niño Southern Oscillation. Clim Res. 2001;19:35–43. [Google Scholar]
- 19.Hay SI, Myers MF, Burke DS, Vaughn DW, Endy T, Ananda N, Shanks GD, Snow RW, Rogers DJ. Etiology of interepidemic periods of mosquito-borne disease. Proc Natl Acad Sci USA. 2000;97:9335–9339. doi: 10.1073/pnas.97.16.9335. [DOI] [PMC free article] [PubMed] [Google Scholar]
- 20.Keating J. An investigation into the cyclical incidence of dengue fever. Soc Sci Med. 2001;53:1587–1597. doi: 10.1016/s0277-9536(00)00443-3. [DOI] [PubMed] [Google Scholar]
- 21.Thammapalo S, Chongsuwiwatwong V, McNeil D, Geater A. The climatic factors influencing the occurrence of dengue hemorrhagic fever in Thailand. Southeast Asian J Trop Med Public Health. 2005;36:191–196. [PubMed] [Google Scholar]
- 22.Johansson MA, Cummings DAT, Glass GE. Multiyear climate variability and dengue—El Niño Southern Oscillation, weather, and dengue incidence in Puerto Rico, Mexico, and Thailand: a longitudinal data analysis. PLoS Med. 2009;6:e1000168. doi: 10.1371/journal.pmed.1000168. [DOI] [PMC free article] [PubMed] [Google Scholar]
- 23.Wearing HJ, Rohani P. Ecological and immunological determinants of dengue epidemics. Proc Natl Acad Sci USA. 2006;103:11802–11807. doi: 10.1073/pnas.0602960103. [DOI] [PMC free article] [PubMed] [Google Scholar]
- 24.Gubler DJ. Epidemic dengue/dengue hemorrhagic fever as a public health, social and economic problem in the 21st century. Trends Microbiol. 2002;10:100–103. doi: 10.1016/s0966-842x(01)02288-0. [DOI] [PubMed] [Google Scholar]
- 25.Focks DA, Barrera R. Dengue Transmission Dynamics: Assessment and Implications for Control. Report on the Scientific Working Group on Dengue, 2006. Geneva: World Health Organization; 2006. pp. 92–109. [Google Scholar]
- 26.Kuhn K, Campbell-Lendrum D, Haines A, Cox J. Using Climate to Predict Infectious Disease Epidemics. 2005. http://www.who.int/globalchange/publications/infectdiseases/en/index.html Available at. Accessed July 24, 2012.
- 27.Thomson MC, Mason SJ, Phindela T, Connor SJ. Use of rainfall and sea surface temperature monitoring for malaria early warning in Botswana. Am J Trop Med Hyg. 2005;73:214–221. [PubMed] [Google Scholar]
- 28.Kovats RS, Bouma MJ, Hajat S, Worrall E, Haines A. El Niño and health. Lancet. 2003;362:1481–1489. doi: 10.1016/S0140-6736(03)14695-8. [DOI] [PubMed] [Google Scholar]
- 29.Schreiber KV. An investigation of relationships between climate and dengue using a water budgeting technique. Int J Biometeorol. 2001;45:81–89. doi: 10.1007/s004840100090. [DOI] [PubMed] [Google Scholar]
- 30.Lowe R, Bailey TC, Stephenson DB, Graham RJ, Coelho CAS, Sa Carvalho M, Barcellos C. Spatio-temporal modeling of climate-sensitive disease risk: towards an early warning system for dengue in Brazil. Comput Geosci. 2011;37:371–381. [Google Scholar]
- 31.Yu H-L, Yang S-J, Yen H-J, Christakos G. A spatio-temporal climate-based model of early dengue fever warning in southern Taiwan. Stochastic Environ Res Risk Assess. 2011;25:485–494. [Google Scholar]
- 32.Pourrut P, Nouvelot JF. Anomalies and extreme climate phenomena. In: Pourrut P, editor. Water in Ecuador: Climate, Precipitation, Runoff. Quito, Ecuador: RR Associated Editors; 1995. pp. 67–76. [Google Scholar]
- 33.Rossel F, Le Goulven P, Cadier E. Areal distribution of the influence of ENSO on the annual rainfall in Ecuador. Journal of Water Science. 1999;12:183–200. [Google Scholar]
- 34.Rossel F, Cadier E, Gómez G. Flooding in coastal Ecuador: causes; exisiting and future protection projects. Bulletin of the French Institute of Andean Studies. 1996;25:399–420. [Google Scholar]
- 35.INAMHI . Guayaquil, Ecuador: National Institute of Meteorology and Hydrology (INAMHI) Decentralized Process, Guayas Watershed; 2012. Rainfall during the trimester January – March 2012 on the coast of Ecuador. [Google Scholar]
- 36.Adler RF, Huffman GJ, Chang A, Ferraro R, Xie P, Janowiak J, Rudolf B, Schneider U, Curtis S, Bolvin D, Gruber A, Susskind J, Arkin P. The Version 2 Global Precipitation Climatology Project (GPCP) monthly precipitation analysis (1979–present) Journal of Hydrometeorology. 2003;4:1147–1167. [Google Scholar]
- 37.NOAA National Oceanic and Atmospheric Administration (United Stated Department of Commerce) Climate Prediction Center. Cold and Warm Episodes by Season (1951–present) 2012. http://www.cpc.ncep.noaa.gov/products/analysis_monitoring/ensostuff/ensoyears.shtml Available at. Accessed July 24, 2012.
- 38.Lowe R, Bailey TC, Stephenson DB, Jupp TE, Graham RJ, Barcellos C, Carvalho MS. The development of an early warning system for climate-sensitive disease risk with a focus on dengue epidemics in Southeast Brazil. Stat Med. 2013;32:864–883. doi: 10.1002/sim.5549. [DOI] [PubMed] [Google Scholar]
- 39.Cameron AC, Trivedi PK. Regression Analysis of Count Data. Econometric Society Monograph No 30. New York, NY: Cambridge University Press; 1998. p. 434. [Google Scholar]
- 40.Hilbe JM. Negative Binomial Regression. New York, NY: Cambridge University Press; 2011. p. 264. [Google Scholar]
- 41.McCulloch CE, Neuhaus JM. Generalized Linear Mixed Models. New York, NY: John Wiley & Sons, Inc.; 2001. p. 358. [Google Scholar]
- 42.Gilks WR, Richardson S, Spiegelhalter DJ. Markov Chain Monte Carlo in Practice. Boca Raton, FL: Chapman & Hall/CRC; 1996. p. 486. [Google Scholar]
- 43.Spiegelhalter DJ, Best NG, Carlin BP, Van Der Linde A. Bayesian measures of model complexity and fit. J R Stat Soc Series B Stat Methodol. 2002;64:583–639. [Google Scholar]
- 44.Kramer M. R2 statistics for mixed models. Proceedings of the Conference on Applied Statistics in Agriculture. 2005;17:148–160. [Google Scholar]
- 45.Gelman A, Meng X, Stern H. Posterior predictive assessment of model fitness via realized discrepancies. Stat Sin. 1996;6:733–759. [Google Scholar]
- 46.Chowell G, Sanchez F. Climate-based descriptive models of dengue fever: the 2002 epidemic in Colima, Mexico. J Environ Health. 2006;68:40. [PubMed] [Google Scholar]
- 47.Hurtado-Díaz M, Riojas-Rodríguez H, Rothenberg SJ, Gomez-Dantés H, Cifuentes E. Impact of climate variability on the incidence of dengue in Mexico. Trop Med Int Health. 2007;12:1327–1337. doi: 10.1111/j.1365-3156.2007.01930.x. [DOI] [PubMed] [Google Scholar]
- 48.Chowell G, Torre CA, Munayco-Escate C, Suarez-Ognio L, Lopez-Cruz R, Hyman JM, Castillo-Chavez C. Spatial and temporal dynamics of dengue fever in Peru: 1994–2006. Epidemiol Infect. 2008;136:1667–1677. doi: 10.1017/S0950268808000290. [DOI] [PMC free article] [PubMed] [Google Scholar]
- 49.Scott TW, Amerasinghe PH, Morrison AC, Lorenz LH, Clark GG, Strickman D, Kittayapong P, Edman JD. Longitudinal studies of Aedes aegypti (Diptera: Culicidae) in Thailand and Puerto Rico: blood feeding frequency. J Med Entomol. 2000;37:89–101. doi: 10.1603/0022-2585-37.1.89. [DOI] [PubMed] [Google Scholar]
- 50.Nagao Y, Thavara U, Chitnumsup P, Tawatsin A, Chansang C, Campbell-Lendrum D. Climatic and social risk factors for Aedes infestation in rural Thailand. Trop Med Int Health. 2003;8:650–659. doi: 10.1046/j.1365-3156.2003.01075.x. [DOI] [PubMed] [Google Scholar]
- 51.Lambrecht L, Paaijmans KP, Fansiri T, Carrington LB, Kramer LD, Thomas MB, Scott TW. Impact of daily temperature fluctuations on dengue virus transmission by Aedes aegypti. Proc Natl Acad Sci USA. 2011;108:7461–7465. doi: 10.1073/pnas.1101377108. [DOI] [PMC free article] [PubMed] [Google Scholar]
- 52.Barrera R, Amador M, MacKay AJ. Population dynamics of Aedes aegypti and dengue as influenced by weather and human behavior in San Juan, Puerto Rico. PLoS Negl Trop Dis. 2011;5:e1378. doi: 10.1371/journal.pntd.0001378. [DOI] [PMC free article] [PubMed] [Google Scholar]
- 53.Hayden MH, Uejio CK, Walker K, Ramberg F, Moreno R, Rosales C, Gameros M, Mearns LO, Zielinski-Gutierrez E, Janes CR. Microclimate and human factors in the divergent ecology of Aedes aegypti along the Arizona, US/Sonora, MX border. Ecohealth. 2010;7:64–77. doi: 10.1007/s10393-010-0288-z. [DOI] [PubMed] [Google Scholar]
- 54.Pontes RJ, Freeman J, Oliveira-Lima JW, Hodgson JC, Spielman A. Vector densities that potentiate dengue outbreaks in a Brazilian city. Am J Trop Med Hyg. 2000;62:378–383. doi: 10.4269/ajtmh.2000.62.378. [DOI] [PubMed] [Google Scholar]
- 55.Bamston AG, Chelliah M, Goldenberg SB. Documentation of a highly ENSO-related SST region in the equatorial Pacific: research note. Atmosphere-ocean. 1997;35:367–383. [Google Scholar]
- 56.Rossel F, Cadier E. El Niño and prediction of anomalous monthly rainfalls in Ecuador. Hydrol Process. 2009;23:3253–3260. [Google Scholar]
- 57.Jupp TE, Lowe R, Coelho CA, Stephenson DB. On the visualization, verification and recalibration of ternary probabilistic forecasts. Philos Transact A Math Phys Eng Sci. 2012;370:1100–1120. doi: 10.1098/rsta.2011.0350. [DOI] [PubMed] [Google Scholar]