

Abstract
This chapter outlines protocols that produce homogenous preparations of oligomeric and fibrillar amyloid -β peptide (Aβ). While there are several isoforms of this peptide, the 42 amino acid form is the focus because of its genetic and pathological link to Alzheimer’s disease (AD). Past decades of AD research highlight the dependence of Aβ42 function on its structural assembly state. Biochemical, cellular and in vivo studies of Aβ42 usually begin with purified peptide obtained by chemical synthesis or recombinant expression. The initial steps to solubilize and prepare these purified dry peptide stocks are critical to controlling the structural assembly of Aβ. To develop homogenous Aβ42 assemblies, we initially monomerize the peptide, erasing any “structural history” that could seed aggregation, by using a strong solvent. It is this starting material that has allowed us to define and optimize conditions that consistently produce homogenous solutions of soluble oligomeric and fibrillar Aβ42 assemblies. These preparations have been developed and characterized by using atomic force microscopy (AFM) to identify the structurally discrete species formed by Aβ42 under specific solution conditions. These preparations have been used extensively to demonstrate a variety of functional differences between oligomeric and fibrillar Aβ42. We also present a protocol for fluorescently labeling oligomeric Aβ42 that does not affect structure, as measured by AFM, or function, as measured by a cellular uptake assay. These reagents are critical experimental tools that allow for defining specific structure/function connections.
Keywords: Amyloid-beta, Oligomer, Fibril, Aggregation, Atomic force microscopy
1. Introduction
Currently, research is focused on soluble oligomeric assemblies of Aβ42 as the proximate cause of the neuropathology that defines AD. Controlling Aβ assembly is critically important as Aβ structure determines its function (Figs. 1 and 2). Numerous experiments have addressed methods to characterize Aβ structure (for review, refs. (1, 2)). These studies demonstrate that peptide conformation and aggregation behavior are highly dependent on initial solvent conditions (Fig. 3) and subsequent solution conditions (Fig. 1a). Oligomer preparations are defined using a variety of different methods, including neurotoxic activities, isolation techniques (primarily size exclusion chromatography (SEC)), size estimation such as by SDS or native PAGE, imaging techniques, and reactivity with various Aβ conformation-specific antibodies. These multiple operative definitions of oligomeric Aβ have resulted in a literature that is often difficult to interpret and almost impossible to compare. A rigorous approach is particularly important with Aβ42, which aggregates faster and to a significantly greater extent than Aβ40 and other shorter forms of the peptide (Fig. 1a, b).
Fig. 1.

Structure and neurotoxicity of oligomeric or fibrillar Aβ42 and Aβ40 assemblies. (a, b) Aβ42, but not Aβ40, forms oligomeric and fibrillar assemblies. 5 mM HFIP-treated Aβ42 (a) or Aβ40 (b) in DMSO was diluted to 100 μM in ice-cold F-12 culture media for oligomers, or 10 mM HCl for fibrils. Oligomer and fibril preparations were incubated for 24 h at 4°C and 37°C, respectively. Samples before (0 h) and after incubation (24 h) were mounted for AFM analysis at 10 μM. Representative 2 × 2 μm x–y, 10 nm total z-range AFM images. Inset images 200 × 200 nm x–y, 2 nm total z-range. Reprinted from Stine et al., JBC, 2003, with permission from ASBMB. (c, d) Oligomeric Aβ42, but not Aβ40, reduces neuronal viability significantly more than fibrillar and unaggregated species. Unaggregated, oligomeric, and fibrillar preparations of Aβ42 (c) or Aβ40 (d) were incubated with N2A cells for 20 h. Oligomeric and fibrillar preparations of Aβ were prepared as described above. For unaggregated peptide preparations, the 5 mM Aβ in DMSO was diluted directly into cell culture media. The MTT assay was used as an indicator of cell viability. Graph represents the mean ± SEM for n ≥ 10 from triplicate wells from at least three separate experiments using different Aβ preparations. * Significant difference between Aβassemblies prepared in oligomers and fibrils conditions (p < 0.001). ** Significantdifference between unaggregated and both Aβ assemblies prepared oligomers and fibrils conditions (p < 0.001). Reprinted from Dahlgren et al., JBC 2002, with permission from ASBMB.
Fig. 2.

Structure and neurotoxicity of oligomeric or fibrillar wild type (WT), Dutch (E22Q), and Arctic (E22G) Aβ42. (a) Oligomeric and fibrillar preparations of Aβ were prepared as described in Subheadings 3.3 and 3.4 and imaged at 10 μM. Both E22Q and E22G Aβ42 exhibit enhanced fibril formation, even under oligomer-forming conditions. Representative 2 × 2 μm, 10 nm total z-range AFM images of 100 μM Aβ. Reprinted from Dahlgren et al., JBC, 2002, with permission from ASBMB. (b) The “toxic fibrils” formed by E22Q and E22G are significantly more toxic than WT oligomers. Changes to structural assembly states of mutant Aβ42 observed by AFM (above) translate into changes in function as measured by cellular toxicity. N2A cells were treated for 20 h with 0.1 μM of WT Aβ42 oligomers and fibrils, or mutant E22Q Aβ42 or mutant E22G Aβ42 assemblies from oligomer and fibril-forming conditions. MTT assay was used as an indicator of cell viability. The data represent n ≥ 8 triplicate wells from at least two separate experiments using different Aβ preparations. * Significant difference between oligomers and fibrils (p < 0.01). Reprinted with modifications from Dahlgren et al., JBC, 2002, with permission from ASBMB.
Fig. 3.
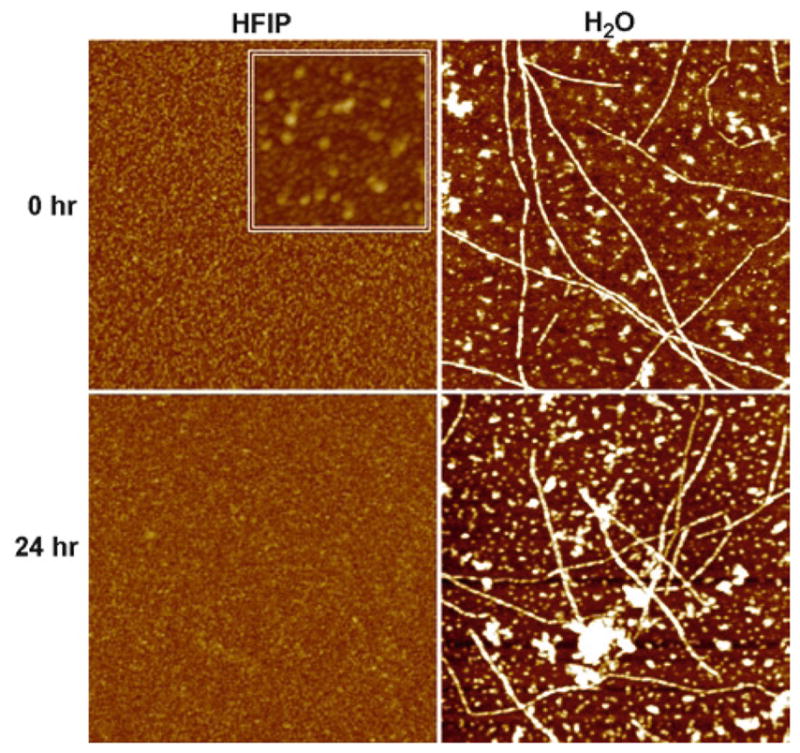
AFM analysis of Aβ42 solubilized in HFIP and H2O. Lyophilized synthetic Aβ42 was solubilized to 5 mM in 100% HFIP or deionized H2O. 5 mM stock solutions were incubated for 24 h at RT. Samples before (0 h) and after incubation (24 h) were mounted for AFM analysis at 10 μM. Representative 1 × 1 μm x–y, 5 nm total z-range AFM images. Inset image 390 × 390 nm x–y, 5 nm total z-range. Reprinted with modifications from Stine et al., JBC, 2003, with permission from ASBMB.
AFM is particularly well suited to the analysis of amyloidogenic peptides and proteins that can assemble into a variety of structurally discrete species, specifically those like Aβ. Polydispersity of morphologies and sizes often complicates or precludes the use of other biophysical techniques (such as NMR or light scattering methods), or is masked by solvent incompatibilities of the bulk solution (as for secondary structure detected by far-UV circular dichroism). Techniques based on separation by size (SDS-PAGE, Native PAGE and SEC) may lead to apparent multimers/sizes arising from technical artifacts due to matrix effects. AFM is one of the few techniques that provide direct, high-resolution, 3-dimensional morphological images of the broad range of structures present in a single scan without the need for chemical manipulation of the sample. Numerous studies have demonstrated several advantages of tapping mode AFM for Aβ42 morphological characterization (3–8). We have used AFM for developing conditions that consistently produce homogenous preparations of oligomeric or fibrillar assemblies of Aβ42 (9, 10). We have used these preparations extensively to demonstrate significant functional differences between Aβ42 oligomers and fibrils using a variety of experimental models (for example, Figs. 1c and 2b) (9, 11–14).
1.1. Overview of Experimental Methods to Prepare and Characterize Defined Aβ Assemblies (Unaggregated, Oligomers, Fibrils, and “Plaques-in-a-Dish”)
To directly assess the conformation-dependent differences among Aβ assemblies, we have developed protocols for the preparation of homogeneous unaggregated, oligomeric, and fibrillar Aβ42 (9, 10) (Figs. 1 and 4). Because Aβ42 is the isoform of the peptide most associated with AD, we chose to utilize it almost exclusively, with Aβ40 used occasionally as a negative control (Fig. 1b, d). Using AFM to image Aβ42, we remove preexisting aggregates and β-sheet secondary structure from Aβ42 with a strong fluorinated alcohol, hexafluoroisopropanol (HFIP) (Fig. 3), followed by solubilization of the now monomerized peptide in dimethylsulfoxide (DMSO). Starting with this monomeric peptide preparation, we further developed two aggregation protocols that consistently produce extensively oligomeric or fibrillar populations of Aβ42 (Fig. 1). For the “unaggregated” peptide preparation, the DMSO-solubilized peptide is diluted in the experimental solution (for example, culture media) and used immediately (Fig. 1a, 0 h). To grow a “plaque in a dish,” follow the fibril forming procedure, with the addition of salt at physiological concentrations (Fig. 5a2). Note that AFM is an optimal method for determining the aggregation state of Aβ42 as it is difficult to consistently identify Aβ42 assemblies by Western analysis of SDS-PAGE (Fig. 5) (15).
Fig. 4.

Schematic diagram summarizing the solubilization and aggregation conditions developed for preparing oligomeric and fibrillar Aβ42. Synthetic Aβ42 is dissolved to 1 mM in 100% HFIP, HFIP is evaporated, and the dry peptide is stored at -20°C. For the aggregation protocols, the peptide is first resuspended in dry DMSO to 5 mM. For oligomeric conditions, F-12 (without phenol red) culture media is added to bring the peptide to a final concentration of 100 μM, and incubated at 4°C for 24 h. For fibrillar conditions, 10 mM HCl is added to bring the peptide to a final concentration of 100 μM, and incubated for 24 h at 37°C. Reprinted from Dahlgren et al., JBC, 2002, with permission from ASBMB.
Fig. 5.
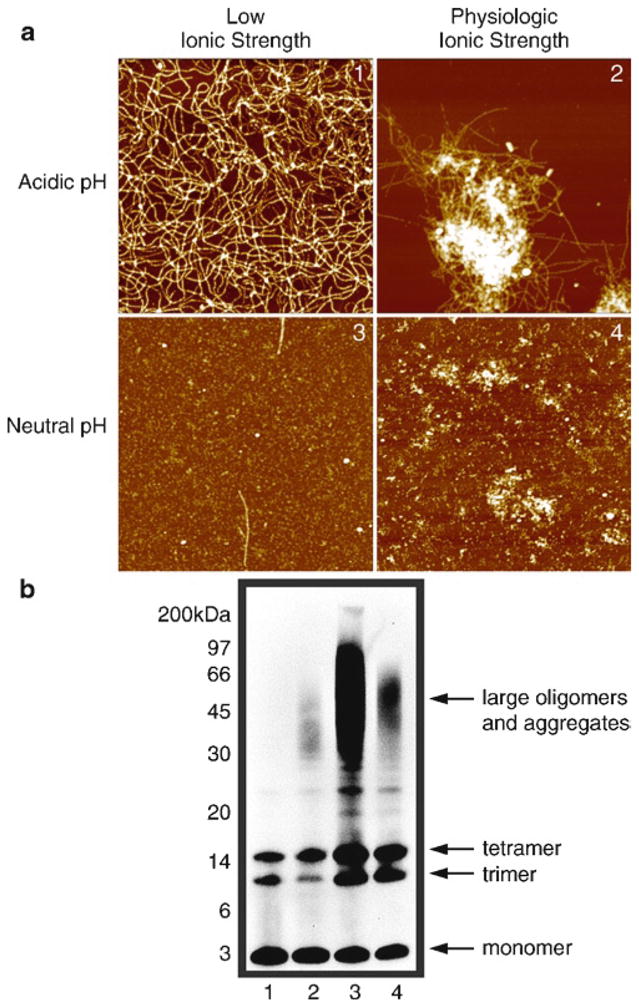
Diverse Aβ42 assemblies imaged by AFM are not preserved by SDS-PAGE. (a) AFM images of Aβ42 fibrils, “plaque in a dish,” oligomers, and coalesced oligomers. 5 mM Aβ42 in DMSO was diluted to 100 μM in either 10 mM HCl (1, acidic pH, low ionic strength), 10 mM HCl + 150 mM NaCl (2, acidic pH, physiologic ionic strength), 10 mM Tris, pH 7.4 (3, neutral pH, low ionic strength), or 10 mM Tris, and pH 7.4 + 150 mM NaCl (4, neutral pH, physiologic ionic strength). Samples were prepared after a 2 h incubation at 37°C. Representative 2 × 2 μm x–y, 10 nm total z-range AFM images are shown, except for panel 2, which is scaled to 2 × 2μm x–y, 25 nm total z-range. Reprinted from Stine et al., JBC, 2003, with permission from ASBMB. (b) Western analysis of SDS-PAGE does not produce an immunoreactive pattern that correlates with AFM images in Panel A. Representative Western blots of Aβ42 assemblies prepared as described above, separated by SDS-PAGE on a 12% NuPAGE BisTRIS gel and probed with the monoclonal antibody 6E10 (recognizing residues 1–16 of Aβ). Samples were visualized by enhanced chemiluminescence. Lanes numbers correspond to panel numbers in (a): HCl (lane 1), HCl + NaCl (lane 2), Tris (lane 3), and Tris + NaCl (lane 4). Reprinted from Stine et al., JBC, 2003, with permission from ASBMB.
These distinct assemblies are derived from chemically identical and structurally homogeneous starting materials and are thus particularly well suited for comparative structure–function studies. We have demonstrated that in vitro, oligomeric Aβ42 is ~10-fold more neurotoxic than the fibrillar (plaque-forming) assembly, and ~40-fold more toxic than the unaggregated peptide, with oligomeric Aβ42-induced toxicity significant at 10 nM (Fig. 1c). Under Aβ42 oligomer- and fibril-forming conditions, Aβ40 remains predominantly as unassembled monomer (Fig. 1b) and had significantly less effect on neuronal viability than preparations of Aβ42 (Fig. 1d). We applied the aggregation protocols developed for wild type (WT) Aβ42 to Aβ42 with the Dutch (E22Q) or Arctic (E22G) mutations (Fig. 2). Oligomeric preparations of the mutant peptides exhibited extensive protofibril and fibril formation, respectively, but were not consistently different from WT Aβ42 in terms of inhibition of neuronal viability. However, fibrillar preparations of the mutants appeared larger in diameter and induced significantly more inhibition of neuronal viability than WT Aβ42 fibril preparations. These data demonstrate that protocols developed to produce oligomeric and fibrillar Aβ42 are useful in distinguishing the structural and functional differences between Aβ42, Aβ40, and Aβ containing known genetic mutations.
1.2. Preparation and Use of Fluorophore-Labeled Aβ42 Assemblies
As researchers become increasingly conscientious of utilizing structurally uniform, well-characterized Aβ preparations, the same criteria need to be applied to fluorophore-labeled-Aβ, prior to their widespread use as experimental tools. Numerous recent studies utilizing fluorophore-labeled Aβ42 peptides demonstrate this need for defined methods of consistently preparing well-characterized fluorescent Aβ assemblies (16–31). The fluorescent Aβ42 reagents used to date are prepared from different sources of Aβ assemblies, in many cases using Aβ42 preparations that have not yet been structurally/morphologically characterized. Thus, structural comparisons between the unlabeled and labeled Aβ assemblies are not possible. Establishing the specific structural form of the assemblies, by AFM and other methods, is necessary to be able to interpret and compare results from the various fluorescent Aβ42 species. We present a method for preparing Alexa Fluor® 488-labeled Aβ oligomers, extending our structural and functional characterization to fluorophore-labeling of Aβ42 oligomers. Structural characterization by AFM establishes a method for labeling uniform oligomeric assemblies that is comparable to unlabeled oligomeric Aβ42 (Fig. 6a). To compare function, we demonstrate that the uptake of labeled and unlabeled oligomeric Aβ42 by neurons in vitro is also similar (Fig. 6b) (see Note 1). These well-characterized fluorophore-Aβ42 oligomers are an exciting new reagent for use in a variety of studies designed to elucidate critical cellular and molecular mechanisms underlying the functions of this Aβ42 assembly form in AD.
Fig. 6.
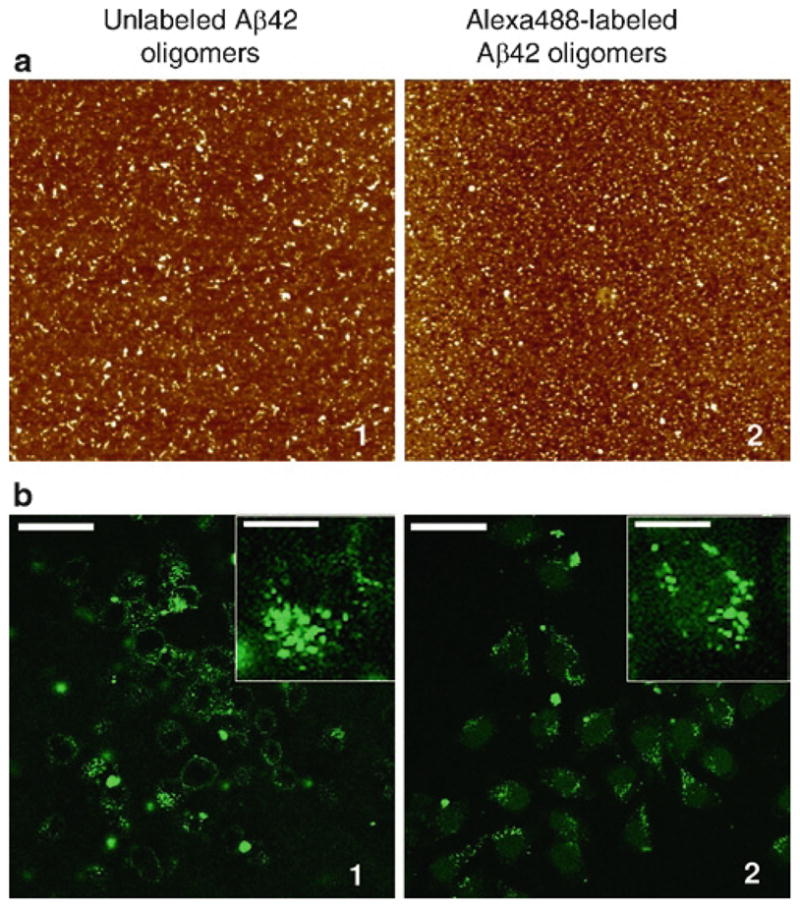
Structure and neuronal uptake of Alexa Fluor® 488-labeled Aβ42 oligomers compared to unlabeled Aβ42 oligomers. (a) AFM analysis shows that oligomer assemblies are preserved after fluorophore-labeling. Aβ42 oligomers were prepared from unlabeled synthetic Aβ42 HFIP films (100 μM, PBS pH 7.4, 4°C) and analyzed by AFM (a1). Fluorophore-labeling of the oligomers with Alexa Fluor® 488 was performed using the Microscale Protein Labeling Kit and analyzed by AFM (a2). Unlabeled oligomers were diluted to 20 μM for analysis and Alexa-labeled oligomers were analyzed without dilution (estimated concentration of 25 μM). All AFM images shown are 2 × 2 μm x–y, 10 nm total z-range. (b) Following uptake, Alexa Fluor® 488-labeled oligomers (b2) appear as punctate fluorescence within the cell, similar to immunodetection of unlabeled Aβ42 oligomers (b1). Following 16 h treatment, Aβ uptake in N2A cells was analyzed using laser-scanning confocal microscopy. Panel B1 shows the image of cells treated with unlabeled Aβ42 oligomers, immunodetected with anti-Aβ monoclonal antibody 6E10 and Alexa488-rabbit-anti-mouse antibody. Panel B2 shows N2A cells treated for 16 h with 2 μM Alexa Fluor® 488-labeled Aβ42 oligomers. Scale bar = 44 μm. The insets show a single-cell magnification, scale bar = 12 μm. Reprinted from Jungbauer et al., Preparation of fluorescently labeled amyloid-beta peptide assemblies: the effect of fluorophore conjugation on structure and function, J. Mol. Recog., 2009, with permission from Wiley.
2. Materials
2.1. Preparation of HFIP-Treated Aβ Peptide Stocks
Chemical fume hood.
Synthetic human amyloid-β (1–42), (California Peptide Research, Inc., Napa, CA) (see Note 2).
1,1,1,3,3,3-Hexafluoro-2-Propanol.
2.5 mL glass Hamilton syringe with Teflon plunger and sharp non-coring needle tip (point style 5).
Bath sonicator, e.g., benchtop ultrasonic cleaner.
Needle, 16–18 gauge.
0.65 mL and 1.7 mL microcentrifuge tubes, untreated (not siliconized).
Repeating Pipettor and tips.
SpeedVac.
Dessicant.
Plastic screw-top containers.
2.2. Unaggregated Aβ42 Preparation
Dimethylsulfoxide (DMSO) (see Note 3).
Ultrapure 18.2 MΩ H2O.
2.3. Oligomeric Aβ42 Preparation
Ham’s F-12, phenol red-free cell culture media, supplemented with 146 mg/L L-Glutamine (see Note 4).
2.4. Fibrillar Aβ42 Preparation
10 mM hydrochloric acid solution (prepared in ultrapure H2O from a 1 M HCl stock).
2.5. “Plaques in a Dish” Preparation
10 mM HCl containing 150 mM NaCl.
2.6. Fluorophore-Labeled Aβ42 Oligomer Preparation
1× PBS, pH 7.4.
Alexa Fluor® 488 TFP Ester Microscale Protein labeling kit (Invitrogen/Molecular Probes).
2.7. Structural Characterization of Aβ42 Preparations
2.7.1. Western Blot Analysis by SDS-PAGE
NuPAGE 4–12% BisTris gels, MES running buffer, LDS sample buffer, and Transfer Buffer.
Electrophoresis power supply.
Molecular weight standards.
PVDF membrane.
Filter paper packs.
Methanol.
Tween-20.
Tris-buffered saline (TBS): 25 mM Tris-HCl, pH 7.4, 137 mM NaCl, 2.7 mM KCl.
Carnation Instant Nonfat dry milk (NFDM).
Anti-Aβ antibodies 6E10 and 4G8 (Covance).
Rabbit anti-mouse IgG, HRP conjugate.
ECL Western blotting substrate.
Imaging system to detect chemiluminescence.
2.7.2. Atomic Force Microscopy Structural Analysis
Mica sheets (Ted Pella) die-punched into 7/16 in. to ½ in. discs using a punch and die set and mounted on 12 mm stainless steel pucks (Ted Pella) with 2-ton epoxy adhesive.
Adhesive tape.
Magnetic sample disc holder, sample disc grippers, and cantilever tweezers.
1 M HCl.
0.02 μm syringe filter.
10 mL Luer lock non-siliconized syringe.
Ultrapure H2O.
Tetrafluoroethane.
Veeco Multimode with NanoScope IIIa controller equipped with a MultiMode head using a Vertical Engage EV piezoceramic scanner.
Atomic force microscopy (AFM) probes: Al-coated Si cantilevers (42 N/m spring constant; ~300 kHz resonance frequency; tetrahedral tip with 7 nm radius).
NanoScope Software vs. 5.31R1.
2.8. Functional Characterization of Aβ42 Preparations
2.8.1. Neurotoxicity Assay (For Example, Figs.1 c, d and 2b). (See Note 5)
Neuro-2a (N2A) mouse neuroblastoma cells.
Opaque, white 96-well culture plates.
Earle’s minimum essential medium (EMEM).
Liquid penicillin-streptomycin.
0.05% trypsin solution with EDTA.
Fetal bovine serum (FBS).
N2 supplement.
Unaggregated (Subheading 3.2), oligomeric (Subheading 3.3), or fibrillar (Subheading 3.4) Aβ42.
Dulbecco’s phosphase-buffered saline (DPBS).
CellTiter-Glo® Luminescent Cell Viability Assay (Promega).
96-well luminescence plate reader.
2.8.2. Neuronal Uptake Assay (Fig. 6 b)
Poly-D-Lysine 8-well culture slides.
16% paraformaldehyde solution.
Blocking buffer: DPBS with 50 mM NH4Cl, 10 mM glycine, 3% BSA.
Alexa Fluor® 488 donkey anti-mouse IgG.
VectaShield mounting medium for fluorescence.
Laser scanning confocal microscope.
3. Methods
3.1. Preparation of HFIP-Treated Aβ Peptide Stocks (Figs.3 and 4)
Steps 1–7 need to be done in a fume hood.
Prepare a 1 mM Aβ solution by adding HFIP directly to the vial containing lyophilized powder through the rubber septum using a 2.5 mL glass Hamilton syringe with a Teflon plunger and sharp (not blunt-end) needle. For Aβ42, add 2.217 mL to 10 mg peptide (see Note 6).
After the peptide is completely dissolved, pierce the septum with a syringe needle to release the vacuum (see Note 7).
Incubate the Aβ – HFIP solution at room temperature (RT) for at least 30 min (see Note 8).
Decap the glass vial (pliers work well) and remove the rubber septum being careful not to allow the HFIP to come in contact with the septum. Have a rack of 0.5 mL or 1.7 mL micro-centrifuge tubes ready.
Using a positive-displacement repeating pipette, aliquot the solution into 10 μL (0.045 mg for Aβ42) or 100 μL (0.45 mg for Aβ42) aliquots in either 0.5 mL or 1.7 mL microcentrifuge tubes (see Note 9).
Allow HFIP to evaporate in the open tubes overnight in the fume hood.
Transfer tubes to a SpeedVac and dry down for 1 h without heating to remove any remaining traces of HFIP and moisture.
Remove tubes from SpeedVac. The resulting peptide should be a thin clear film at the bottom of the tubes (see Note 10).
Store dried peptide films over desiccant in glass jars at −20°C (see Note 11).
Prior to use, remove peptide film from −20°C freezer and allow sample to come to RT.
Prepare a 5 mM Aβ DMSO stock by adding 20 μL fresh dry DMSO to 0.45 mg Aβ42 peptide (2 μL to 0.045 mg Aβ42). Pipette thoroughly, scraping down the sides of the tube near the bottom to ensure complete resuspension of peptide film (see Note 12).
Vortex well (~30 s) and pulse in a microcentrifuge to collect solution at the bottom of the tube (see Note 13).
Sonicate 5 mM Aβ DMSO solution for 10 min in a bath sonicator.
Use this preparation as the starting material for unaggregated Aβ (Subheading 3.2), oligomeric Aβ (Subheading 3.3), fibrillar Aβ (Subheading 3.4), “plaque in a dish” (Subheading 3.5), or fluorophore-labeled oligomeric Aβ (Subheading 3.6).
3.2. Unaggregated Aβ Preparation (see Note 14)
3.3. Oligomeric Aβ Preparation
Start with a tube of freshly resuspended 5 mM Aβ42 in DMSO at RT (see Note 15).
To this Aβ aliquot, add cold phenol-free F-12 cell culture media, diluting to a final concentration of 100 μM Aβ. For example, to 2 μL of 5 mM Aβ in DMSO, add 98 μL cold F-12. Remember to use proper sterile technique. When using F-12 media, avoid prolonged exposure to light and keep F-12 solutions on ice.
Vortex for 15 s, transfer to 4°C and incubate for 24 h.
The expected AFM pattern for this preparation is shown in Fig. 1a, lower left panel.
3.4. Fibrillar Aβ Preparation
Start with a tube of freshly resuspended 5 mM Aβ42 in DMSO at RT (see Note 15).
To this Aβ aliquot, add 10 mM HCl at RT, diluting to a final concentration of 100 μM Aβ. For example, to 2 μL of 5 mM Aβ in DMSO, add 98 μL of 10 mM HCl.
Vortex for 15 s, transfer to 37°C and incubate for 24 h.
The expected AFM pattern for this preparation is shown in Fig. 1a, lower right panel.
3.5. “Plaque in a Dish” Preparation
Start with a tube of freshly resuspended 5mM Aβ42 in DMSO at RT (see Note 15).
To this Aβ aliquot, add 10 mM HCl + 150 mM NaCl, diluting to a final concentration of 100 μM Aβ.
Vortex for 15 s, transfer to 37°C and incubate for 24 h.
The expected AFM pattern for this preparation is shown in Fig. 5a, panel 2.
3.6. Fluorophore-Labeled Aβ42 Oligomer Preparation (Fig. 6)
Start with a tube of freshly resuspended 5 mM Aβ42 in DMSO at RT (see Note 15).
To this Aβ aliquot, add cold 1× PBS buffer, pH 7.4, diluting to a final concentration of 100 μM Aβ.
Incubate under oligomer-forming conditions (4°C, 24 h as in Subheading 3.3).
Prepare solution for labeling using the Alexa Fluor® 488 Microscale Protein labeling kit (Molecular Probes/Invitrogen) according to the manufacturer instructions by adding 10% volume of 1 M NaHCO3.
Dissolve the provided Alexa Fluor® 488 TFP Ester into 10 μL ultrapure H2O immediately before adding to Aβ oligomers. Use 8 μL dye for every 100 μL oligomer solution.
Incubate the labeling reaction for 15 min in the dark at RT.
In the meantime, prepare the spin columns by delivering 425 μL of the kit-provided Bio-Gel P-6 fine resin slurry into the provided spin column tubes. Prepare two spin columns for every 100 μL of oligomers. One minute before the end of the labeling incubation, centrifuge the spin columns at RT for 15 s at 16,000 × g per the manufacturer recommendations.
Add 55 μL of the crude labeling reaction to the top of the resin and centrifuge for 1 min at 16,000 × g to removed unincorporated fluorophore. The leftover crude reaction solution can be analyzed by gel.
Store the labeled product at 4°C protected from light. Avoid prolonged storage.
3.7. Structural Characterization of Aβ42 Preparations
3.7.1. Western Analysis by SDS-PAGE (see Note 16)
Prepare dilutions of Aβ solutions in LDS sample buffer without reducing agent to deliver 50–200 pmoles Aβ per lane.
Perform electrophoresis on NuPAGE 4–12% BisTris gels in 1× MES running buffer until the dye front reaches the bottom of the gel (see Note 17).
Prepare the gel for transfer to PVDF membrane in the transfer cassette using filter paper, pads, and membrane pre-equilibrated in chilled 1× transfer buffer containing 10% methanol.
Set power supply limits for the transfer for 20–30 min at very low current (such as 15 mA) followed by 25 V, 160 mA for 1 h.
After transfer, incubate the membrane in TBST for 5 min.
Block for 30–60 min in TBST + 5% NFDM.
Perform incubation with primary antibody (1:5,000 dilutions of mouse monoclonal antibody 4G8 (anti-Aβ 17–24) or 6E10 (anti-Aβ 1–16) prepared in TBST + 5% NFDM) overnight at 4°C.
Perform 3 × 10 min washes in TBST + 5% NFDM.
Incubate in secondary antibody for 1 h at RT (1:10,000 dilutions of rabbit anti-mouse IgG-HRP conjugate).
Wash 3 × 10 min in TBST + 5% NFDM.
Rinse in TBST.
Incubate in ECL substrate for 1 min followed by the immediate detection of chemiluminescence.
For representative example of expected results, see Fig. 5b.
3.7.2. Atomic Force Microscopy
Fill a 10 mL syringe with ultrapure water and equip with a 0.02 μm filter. Discard the initial 1–2 mL syringe filter output. All subsequent steps use 0.02 μm-filtered water.
Prepare samples for spotting on mica by diluting to final concentrations of 10–30 μM in water.
Immediately before sample delivery, cleave away the top one to four layers of mica using adhesive tape to reveal a clean, flat, featureless surface.
For mica pre-treatment, add ~3 μL (enough to cover the surface) of 1 M HCl to mica for 30 s and rinse with two drops of water by letting water out of the syringe filter roll over the mica, held at a 45° angle on a magnetic surface (see Note 18).
Immediately deliver sample onto mica and incubate for 3 min.
Rinse with three drops of water and blow dry with several gentle pulses of compressed air.
Incubate on benchtop for a few minutes to hours (covered to protect from dust) at RT until analysis (see Note 19).
When AFM tip engages, optimize instrument parameters for each scan keeping contact force at a minimum, with scan rates between 1 and 2 Hz, drive amplitude between 20 and100 mV (depending on cantilever), and amplitude set point between 1.4 and 1.5 V.
Process data to remove vertical offset between scan lines by applying zero order flattening polynomials using NanoScope Software vs. 5.31R1.
For representative examples of expected results, see Figs. 1–3, 5 and 6.
3.8. Functional Characterization of Aβ42 Preparations
3.8.1. Neurotoxicity/Viability Assay (Figs.1 c, d and 2b) (see Note 5)
Cell Culture
-
1
Mouse neuroblastoma N2A cells are routinely grown in 100-mm tissue culture dishes containing 10 mL of complete growth medium, consisting of EMEM supplemented with 10% FBS and 1% penicillin/streptomycin. The cells are maintained in a humidified incubator at 37°C with a 5% CO2 atmosphere.
-
2
Cells are split such that 0.5 × 10⁶ cells were seeded in a new dish each time the cells reached 80–90% confluency. Briefly, when the cells reach this confluency (approximately once a week), the old growth medium is removed, and DPBS is used to wash cells. 1.5 mL of 0.05% Trypsin-EDTA solution is added to cells, and the dish is returned to the incubator for 2–5 min without disturbance. When cells are detached from the dish, 6 mL of the complete growth medium is added to halt the trypsinization of cells. Cells are collected in a sterile 15 mL conical tube, and pelleted in a clinical centrifuge with the setting of 168 × g for 2 min. The supernatant is decanted and cells are resuspended in 6 mL of complete growth medium. The cell density in a 12 μL aliquot of this cell suspension is counted using a hemocytometer. Based on the counted cell density, an appropriate volume to deliver 0.5 × 10⁶ cells is then added to a new 100 mm dish containing 10 mL of complete growth medium. The dishes are then placed back into the incubator.
Neurotoxicity Assay (see Note 5)
Day 1: Preparing Cells and Aβ
-
3
Start fresh oligomeric or fibrillar Aβ preparations so that they will be ready to use the next day.
-
4
Prepare a 96-well plate of N2A cells to be treated. N2A cells from a healthy growing dish are seeded at 5,000 cells/well on an all-white 96-well plate in complete growth medium. An accurate multichannel pipette is ideal to dispense cells. In experimental planning, calculate the minimal number of wells required. For example, within a 96-well plate, we typically perform five to six replicate treatments of the same dose of Aβ assembly (e.g., 10 μM oligomers). Do not use corner wells in the plate as these wells do not have consistent luminescence values. Also include control wells containing medium without cells to measure the background luminescence of the wells. Cells are allowed to grow for 24 h before the start of treatments for the neurotoxicity assay.
Day 2: Cell Treatment
-
5
Prepare the 96-well plate cultures for treatment. Cells are washed twice with 90 μL of prewarmed plain EMEM medium using a 12-channel pipette. Take care not to touch the well bottom to minimize cell loss during this washing step. 90 μL of fresh EMEM medium supplemented with 1% N2 Supplement is added to each well.
-
6
Add the appropriate volumes of prepared oligomeric or fibrillar Aβ to the wells being treated according to the desired experimental design (e.g., comparing oligomers versus fibrils at 10 μM Aβ concentration). The final volume of medium is 100 μL. Add the same volume of F-12 or 10 mM HCl + DMSO to other wells to serve as the vehicle control. Cells are returned to the incubator for 24 h.
Day 3: Measuring Toxicity
-
7
At the end of the 24-h treatment, leave the plate at the bench for 10 min to allow it to equilibrate to RT. The neurotoxicity assay is performed by measuring the cellular ATP value with CellTiter-Glo® reagent according to the manufacturer’s instruction. Briefly, the reagent is thawed to reach RT and an equal volume (100 μL) of the reagent is added directly to the cells. The plate is then gently rotated in an orbital shaker for 10 min. The luminescence intensity is then measured in a luminescent plate reader.
-
8
To calculate the neurotoxicity, the data set is normalized to the vehicle-treated cells, which is set to 100% for viability, and the relative values of treated cells versus control cells is calculated accordingly.
3.8.2. Neuronal Uptake Assay (Fig. 6 b)
N2A cells are seeded at 30,000 cells/well on poly-D-lysine coated 8-well culture slides for 8 h in phenol red-free DMEM + 10% FBS.
Cells are washed with plain DMEM medium. Alexa Fluor® 488-labeled (1–2 μM) or unlabeled (10 μM) synthetic Aβ42 oligomers are added to cells in the fresh media of DMEM supplemented with 1% N2, and incubated for 2–16 h at 37°C.
At the end of the treatment, cells are washed extensively with blocking buffer without BSA, and then fixed in 4% paraformaldehyde for 20 min at RT.
Cells treated with unlabeled Aβ42 oligomers are permeabilized with 0.2% Triton X-100 in DPBS for 5 min, and then blocked for 15 min with 3% BSA in the blocking buffer. Cells are then incubated overnight with anti-Aβ(1–16) antibody 6E10 (1:500) at 4°C. After several washes with DPBS, cells are incubated 1 h at RT with Alexa488-labeled donkey anti-mouse IgG (1:500). Cells are further washed several rounds with DPBS. Wells are mounted with VectaShield mounting medium and covered with glass coverslips.
Immunofluorescence images are acquired on a laser scanning confocal microscope using a Plan-Apochromate Zeiss 40×/1.3 oil immersion objective. To visualize the 488 nm excited fluorophores from the directly fluorophore-labeled Aβ42 oligomers, or the Alexa488-immunolabeled Aβ42 oligomers, 488 nm laser light (krypton-argon laser), a 488/543 two notch dichroic excitation mirror, and a 505–530 nm bandpass emission filter are used with optimized PMT parameters.
Acknowledgments
We gratefully acknowledge financial support for these studies from NIH 1F32AG030256-01 (LMJ), Alzheimer’s Association NIRG-06-26957 (CY), NIH R01 AG19121 (MJL), NIH PO1AG030128-A2 (MJL), Alzheimer’s Association Zenith Award ZEN-08-89900 (MJL), and NIH (NIA) PO1AG021184 (MJL). We also gratefully acknowledge Kevin Laxton and Amy Pham for technical and intellectual contributions.
Footnotes
Cellular uptake by neurons is reported only for oligomeric Aβ42, as treatment with fibrillar Aβ42 does not result in any detectable uptake in the model described (data not shown).
In-house synthetic peptide or peptide from other vendors will also work, but it must be of very high purity and quality. The TFA salt (as opposed to the acetate or ammonium salt) is preferred. In-house material should be accurately weighed in clean glass vials with a HFIP-resistant closure.
Dry DMSO stocks can be made by transferring DMSO from a freshly opened ampule to a 1–2 mL glass vial with a DMSO-resistant closure (such as Teflon – VWR, Cat. No. 66009-556). Store vials containing the dry DMSO in a dessicated glass jar in the dark at RT and discard after 2 weeks.
The glutamine supplementation is to match the composition of the Biosource phenol red-free F-12 media, which was described in the original oligomer protocol (10) but is no longer available.
Originally, we used the 3-[4,5-dimethylthiazol-2-yl]-2,5-di-phenyl tetrazolium bromide (MTT) assay (Roche Molecular Biochemicals) as a measure of neurotoxicity (9, 11) (Figs. 1c, d and 2b). This method is based on the reduction of internalized MTT tetrazolium to a colored formazan compound by cellular redox potential. The formazan production is proportional to viable cells in culture. However, MTT reduction does not necessarily reflect cellular metabolic activity, as some Aβ assemblies may also enhance exocytosis of MTT formazan (32). This assay also requires relatively long staining and extraction times. Therefore, we now use the Promega CellTiter-Glo® Luminescent Cell Viability Assay as a measure of in vitro neurotoxicity. This has resulted, as one would predict, in lower toxicity for comparable doses of Aβ, and so higher doses of Aβ42 are now required to achieve the same toxicity (12).
HFIP is corrosive and very volatile. Avoid contact and work in the fume hood; take care not to contact septum or other surfaces during solubilization.
Peptide comes stored under vacuum, and the peptide in the bottom of the vial needs to be in solution before the vacuum is broken. After the peptide is in solution, pierce the septum with a syringe needle to release the vacuum. For other peptides, add enough HFIP such that the final peptide concentration is 1 mM. Use proper sterile technique to avoid any bacterial contamination when the peptide stocks are resuspended in culture media or buffer.
Solution should be clear and colorless. Any trace of yellow color or cloudy suspension indicates poor peptide quality and should not be used. Some peptides may require brief (~5 min) bath sonication.
Do not use siliconized tubes for the preparation of HFIP stocks. Be careful when dispensing HFIP solution and watch for bubbles. Leave tubes open when evaporating HFIP overnight.
The peptide should not be white or chunky. An even clear film is a strong indicator of good peptide quality.
These stocks should be stable for several months to years.
DMSO stock should be clear and colorless. Remember to use proper sterile technique.
Do not store peptide as a DMSO stock for more than 1 h to avoid protofibril formation.
While the “unaggregated” prep is an ideal control for conformation, it is most useful in assays that require either a very low concentration of peptide (9) or a short incubation period (14). Prolonged incubation at higher concentrations result in the uncontrolled aggregation of the peptide and unpredictable functional activity.
Do not keep 5 mM Aβ stock on ice because the DMSO will solidify.
Western analysis by SDS-PAGE is not a method for assessing the conformation/assembly of Aβ42 (Fig. 5) (15). However, it is useful for visualizing the relative amount of peptide for comparison between samples.
Depending on the age of the electrode/power supply equipment, voltage, and current settings may affect the pattern and abundance of bands typically observed for Aβ (monomer, dimer, trimer, and tetramer). We have found that power supply limits set at 90–100 V, 80 mA for 80–90 min for electrophoresis yield consistent results.
For Aβ preparations in F-12, the HCl pretreatment of the mica improves consistent and uniform peptide adsorption to the mica. For Aβ preparations in HCl or PBS, including the Alexa Fluor® 488-labeled oligomers, no mica pretreatment is performed.
Dried sample disks can be stored in a helium-purged desiccator for several months.
References
- 1.Roychaudhuri R, Yang M, Hoshi MM, Teplow DB. Amyloid beta-protein assembly and Alzheimer disease. The Journal of biological chemistry. 2009;284:4749–53. doi: 10.1074/jbc.R800036200. [DOI] [PMC free article] [PubMed] [Google Scholar]
- 2.Rahimi F, Shanmugam A, Bitan G. Structure-function relationships of pre-fibrillar protein assemblies in Alzheimer’s disease and related disorders. Curr Alzheimer Res. 2008;5:319–41. doi: 10.2174/156720508784533358. [DOI] [PMC free article] [PubMed] [Google Scholar]
- 3.Mastrangelo IA, Ahmed M, Sato T, Liu W, Wang C, Hough P, Smith SO. High-resolution atomic force microscopy of soluble Abeta42 oligomers. J Mol Biol. 2006;358:106–19. doi: 10.1016/j.jmb.2006.01.042. [DOI] [PubMed] [Google Scholar]
- 4.Huang TH, Yang DS, Plaskos NP, Go S, Yip CM, Fraser PE, Chakrabartty A. Structural studies of soluble oligomers of the Alzheimer beta-amyloid peptide. J Mol Biol. 2000;297:73–87. doi: 10.1006/jmbi.2000.3559. [DOI] [PubMed] [Google Scholar]
- 5.Harper JD, Wong SS, Lieber CM, Lansbury PT. Observation of metastable Abeta amyloid protofibrils by atomic force microscopy. Chem Biol. 1997;4:119–25. doi: 10.1016/s1074-5521(97)90255-6. [DOI] [PubMed] [Google Scholar]
- 6.Harper JD, Wong SS, Lieber CM, Lansbury PT., Jr Assembly of A beta amyloid protofibrils: an in vitro model for a possible early event in Alzheimer’s disease. Biochem. 1999;38:8972–80. doi: 10.1021/bi9904149. [DOI] [PubMed] [Google Scholar]
- 7.Roher AE, Chaney MO, Kuo YM, Webster SD, Stine WB, Haverkamp LJ, Woods AS, Cotter RJ, Tuohy JM, Krafft GA, Bonnell BS, Emmerling MR. Morphology and toxicity of Abeta-(1-42) dimer derived from neuritic and vascular amyloid deposits of Alzheimer’s disease. J Biol Chem. 1996;271:20631–35. doi: 10.1074/jbc.271.34.20631. [DOI] [PubMed] [Google Scholar]
- 8.Legleiter J, Czilli DL, Gitter B, DeMattos RB, Holtzman DM, Kowalewski T. Effect of different anti-Abeta antibodies on Abeta fibrillogenesis as assessed by atomic force microscopy. J Mol Biol. 2004;335:997–1006. doi: 10.1016/j.jmb.2003.11.019. [DOI] [PubMed] [Google Scholar]
- 9.Dahlgren KN, Manelli AM, Stine WB, Jr, Baker LK, Krafft GA, LaDu MJ. Oligomeric and fibrillar species of amyloid-beta peptides differentially affect neuronal viability. J Biol Chem. 2002;277:32046–53. doi: 10.1074/jbc.M201750200. [DOI] [PubMed] [Google Scholar]
- 10.Stine WB, Jr, Dahlgren KN, Krafft GK, LaDu MJ. In vitro characterization of conditions for amyloid-beta peptide oligomerization and fibrillogenesis. J Biol Chem. 2003;278:11612–22. doi: 10.1074/jbc.M210207200. [DOI] [PubMed] [Google Scholar]
- 11.Manelli AM, Stine WB, Van Eldik LJ, LaDu MJ. ApoE and Abeta1-42 interactions: effects of isoform and conformation on structure and function. J Mol Neurosci. 2004;23:235–46. doi: 10.1385/JMN:23:3:235. [DOI] [PubMed] [Google Scholar]
- 12.Manelli AM, Bulfinch LC, Sullivan PM, LaDu MJ. Abeta42 neurotoxicity in primary co-cultures: effect of apoE isoform and Abeta conformation. Neurobiol Aging. 2007;28:1139–47. doi: 10.1016/j.neurobiolaging.2006.05.024. [DOI] [PMC free article] [PubMed] [Google Scholar]
- 13.White JA, Manelli AM, Holmberg KH, Van Eldik LJ, LaDu MJ. Differential effects of oligomeric and fibrillar amyloid-beta1-42 on astrocyte-mediated inflammation. Neurobiol Dis. 2005;18:459–65. doi: 10.1016/j.nbd.2004.12.013. [DOI] [PubMed] [Google Scholar]
- 14.Trommer BL, Shah C, Yun SH, Gamkrelidze G, Pasternak ES, Stine WB, Manelli A, Sullivan P, Pasternak JF, LaDu MJ. ApoE isoform-specific effects on LTP: blockade by oligomeric amyloid-beta1-42. Neurobiol Dis. 2005;18:75–82. doi: 10.1016/j.nbd.2004.08.011. [DOI] [PubMed] [Google Scholar]
- 15.Bitan G, Fradinger EA, Spring SM, Teplow DB. Neurotoxic protein oligomers – what you see is not always what you get. Amyloid. 2005;12:88–95. doi: 10.1080/13506120500106958. [DOI] [PubMed] [Google Scholar]
- 16.Jiang Q, Lee CY, Mandrekar S, Wilkinson B, Cramer P, Zelcer N, Mann K, Lamb B, Willson TM, Collins JL, Richardson JC, Smith JD, Comery TA, Riddell D, Holtzman DM, Tontonoz P, Landreth GE. ApoE promotes the proteolytic degradation of Abeta. Neuron. 2008;58:681–93. doi: 10.1016/j.neuron.2008.04.010. [DOI] [PMC free article] [PubMed] [Google Scholar]
- 17.Hickman SE, Allison EK, El Khoury J. Microglial dysfunction and defective beta-amyloid clearance pathways in aging Alzheimer’s disease mice. J Neurosci. 2008;28:8354–60. doi: 10.1523/JNEUROSCI.0616-08.2008. [DOI] [PMC free article] [PubMed] [Google Scholar]
- 18.El Khoury J, Toft M, Hickman SE, Means TK, Terada K, Geula C, Luster AD. Ccr2 deficiency impairs microglial accumulation and accelerates progression of Alzheimer-like disease. Nature Med. 2007;13:432–8. doi: 10.1038/nm1555. [DOI] [PubMed] [Google Scholar]
- 19.Giunta B, Zhou Y, Hou H, Rrapo E, Fernandez F, Tan J. HIV-1 TAT inhibits microglial phagocytosis of Abeta peptide. Int J Clin Exp Pathol. 2008;1:260–75. [PMC free article] [PubMed] [Google Scholar]
- 20.Majumdar A, Chung H, Dolios G, Wang R, Asamoah N, Lobel P, Maxfield FR. Degradation of fibrillar forms of Alzheimer’s amyloid beta-peptide by macrophages. Neurobiology of aging. 2008;29:707–15. doi: 10.1016/j.neurobiolaging.2006.12.001. [DOI] [PMC free article] [PubMed] [Google Scholar]
- 21.Chung H, Brazil MI, Soe TT, Maxfield FR. Uptake, degradation, and release of fibrillar and soluble forms of Alzheimer’s amyloid beta-peptide by micro-glial cells. J Biol Chem. 1999;274:32301–8. doi: 10.1074/jbc.274.45.32301. [DOI] [PubMed] [Google Scholar]
- 22.Brazil MI, Chung H, Maxfield FR. Effects of incorporation of immuno-globulin G and complement component C1q on uptake and degradation of Alzheimer’s disease amyloid fibrils by microglia. J Biol Chem. 2000;275:16941–7. doi: 10.1074/jbc.M000937200. [DOI] [PubMed] [Google Scholar]
- 23.Paresce DM, Ghosh RN, Maxfield FR. Microglial cells internalize aggregates of the Alzheimer’s disease amyloid beta-protein via a scavenger receptor. Neuron. 1996;17:553–65. doi: 10.1016/s0896-6273(00)80187-7. [DOI] [PubMed] [Google Scholar]
- 24.Parvathy S, Rajadas J, Ryan H, Vaziri S, Anderson L, Murphy GM., Jr Abeta peptide conformation determines uptake and interleukin-1alpha expression by primary microglial cells. Neurobiology of aging. 2009;30:1792–1804. doi: 10.1016/j.neurobiolaging.2008.01.011. [DOI] [PubMed] [Google Scholar]
- 25.Li R, Shen Y, Yang LB, Lue LF, Finch C, Rogers J. Estrogen enhances uptake of amyloid beta-protein by microglia derived from the human cortex. J Neurochem. 2000;75:1447–54. doi: 10.1046/j.1471-4159.2000.0751447.x. [DOI] [PubMed] [Google Scholar]
- 26.Chafekar SM, Baas F, Scheper W. Oligomer-specific Abeta toxicity in cell models is mediated by selective uptake. Biochim Biophys Acta. 2008;1782:523–31. doi: 10.1016/j.bbadis.2008.06.003. [DOI] [PubMed] [Google Scholar]
- 27.Simakova O, Arispe NJ. The cell-selective neurotoxicity of the Alzheimer’s Abeta peptide is determined by surface phosphatidylserine and cytosolic ATP levels. Membrane binding is required for Abeta toxicity. J Neurosci. 2007;27:13719–29. doi: 10.1523/JNEUROSCI.3006-07.2007. [DOI] [PMC free article] [PubMed] [Google Scholar]
- 28.Saavedra L, Mohamed A, Ma V, Kar S, de Chaves EP. Internalization of beta-amyloid peptide by primary neurons in the absence of apolipoprotein E. J Biol Chem. 2007;282:35722–32. doi: 10.1074/jbc.M701823200. [DOI] [PubMed] [Google Scholar]
- 29.Clifford PM, Zarrabi S, Siu G, Kinsler KJ, Kosciuk MC, Venkataraman V, D’Andrea MR, Dinsmore S, Nagele RG. Abeta peptides can enter the brain through a defective blood-brain barrier and bind selectively to neurons. Brain Res. 2007;1142:223–36. doi: 10.1016/j.brainres.2007.01.070. [DOI] [PubMed] [Google Scholar]
- 30.Smits HA, van Beelen AJ, de Vos NM, Rijsmus A, van der Bruggen T, Verhoef J, van Muiswinkel FL, Nottet HS. Activation of human macrophages by amyloid-beta is attenuated by astrocytes. J Immunol. 2001;166:6869–76. doi: 10.4049/jimmunol.166.11.6869. [DOI] [PubMed] [Google Scholar]
- 31.Kuhnke D, Jedlitschky G, Grube M, Krohn M, Jucker M, Mosyagin I, Cascorbi I, Walker LC, Kroemer HK, Warzok RW, Vogelgesang S. MDR1-P-Glycoprotein (ABCB1) Mediates Transport of Alzheimer’s amyloid-beta peptides – implications for the mechanisms of Abeta clearance at the blood-brain barrier. Brain Pathol. 2007;17:347–53. doi: 10.1111/j.1750-3639.2007.00075.x. [DOI] [PMC free article] [PubMed] [Google Scholar]
- 32.Liu Y, Schubert D. Cytotoxic amyloid peptides inhibit cellular 3-(4,5-dimethylthiazol-2-yl)-2,5-diphenyltetrazolium bromide (MTT) reduction by enhancing MTT formazan exocytosis. J Neurochem. 1997;69:2285–93. doi: 10.1046/j.1471-4159.1997.69062285.x. [DOI] [PubMed] [Google Scholar]