

Abstract
Background & Aims
2-Deoxy-2-[18F]fluoro-D-glucose (FDG) uptake by positron emission tomography (PET), a measure of glucose transporter activity, has been used to detect mucosal inflammation. However, there is limited understanding of the biologic basis of mucosal FDG uptake.
Methods
A contrast-based computed tomographic isocontour method was developed to identify intestinal anatomic regions, and FDG uptake was integrated over these regions to achieve reproducible quantification during longitudinal assessment of individual mice. Intestinal FDG uptake was compared with histologic scores and with glucose transporter 1 levels in mucosal immune cells by flow cytometry.
Results
Intestinal FDG uptake quantitatively correlated with disease activity in mild (C3H/HeJ.IL-10−/−) and severe (129.Gαi2−/−, CD4+ CD45RBhigh, and Gαi2−/− CD3+ transfer) murine colitis models at all time points examined (P < .05) and was sufficiently sensitive to detect preclinical inflammation. FDG uptake was correlated by flow cytometric detection of glucose transporter 1 levels in mucosal CD4+ T lymphocyte but not other intestinal immune cell types. CD4+ T-cell transfer in vivo confirmed that mucosal FDG uptake was associated with the activated but not quiescent state. When intestinal inflammation was increased by treatment with piroxicam and decreased with anti-TL1A treatment, FDG uptake was correspondingly altered.
Conclusions
This study clarifies the cellular basis of FDG signal in intestinal inflammation and introduces computed tomographic isocontour analysis of FDG-PET imaging for standardized quantitation of immune colitis.
Inflammatory bowel disease reflects the disruption of the homeostasis between intestinal immune cells and commensal enteric bacteria.1,2 The localization and mode of inflammation within the gastrointestinal tract fluctuates over the course of disease in inflammatory bowel disease and is further complicated by progression to mucosal destruction, fibrosis, stricture, or perforation.3 These different phases and types of inflammation occur recurrently or even concurrently in different intestinal segments, complicating the interpretation of biopsy or endoscopic examination.
Noninvasive methods that biologically categorize and quantitate inflammation can enhance the study of disease pathogenesis and may refine assessment and treatment planning in the management of intestinal inflam-mation.3 As a molecular imaging technique, positron emission tomography (PET) is used to visualize a variety of in vivo biological processes, including cell interactions, gene expression, and drug metabolism.4 Clinically, 2-Deoxy-2-[18F]fluoro-D-glucose (FDG) has emerged as an important molecular biomarker, particularly in PET imaging of cancer, based on increased glucose transport activity in the malignant state. Similarly, immune cell activation requires increased glucose import, primarily through glucose transporter 1 (Glut-1), and a corresponding acceleration of glycolysis to meet its new energy requirements. Glut-1 synthesis and translocation to the cell surface are mediated though the phosphatidylinosi-tol 3-kinase and Akt pathways,5 including antigen-mediated T-cell receptor signaling.6
Accordingly, imaging of FDG uptake by activated lymphocytes is an appealing strategy to detect immune-mediated inflammation in vivo. Early studies showed that concanavalin A or turpentine oil resulted in an increased FDG uptake by lymphoid and granulation tissues.7,8 FDG-PET permitted monitoring of inflammation and therapeutic intervention in experimental autoimmune encephalomyelitis.9 FDG-PET has previously been used to assess intestinal inflammation in murine and human subjects. Clinical studies have reported the ability of FDG-PET to detect intestinal lesions visualized by colonoscopies or histology,10–13 and a murine study evaluating free FDG and FDG-tagged white blood cells distinguished colitic and healthy mice.14 In the latter study, intestinal signal from tagged white blood cells but not free FDG correlated with intestinal inflammation. Thus, there is little information defining the biologic correlates of increased intestinal FDG uptake in inflammatory bowel disease.
In the present study, genetic murine models of inflammatory bowel disease were used to refine the methodology of FDG-PET and to clarify the cellular basis of this noninvasive assessment of immune colitis. To address the relationship of FDG uptake to categorical and longitudinal changes in disease activity, we used interleukin (IL)-10−/− to assess mild colitis and Gαi2−/−, CD4+ CD45RBhigh, or Gαi2−/− CD3+ transfer mice to examine severe colitis, respectively. We also used nonsteroidal antiinflammatory drug (NSAID) treatment to exacerbate colitis and anti-TL1A to alleviate inflammation to test the sensitivity of FDG uptake to short-term changes in inflammation. Finally, we isolated mucosal immune cell types and analyzed their Glut-1 expression by flow cytometry to evaluate the cellular sources of the intestinal FDG signal. Our findings establish a standardized methodology for FDG uptake that reflects both disease-associated inflammation and intestinal activity that precedes clinical inflammation. They also show that increased expression of Glut-1 in CD4+ T cells is an excellent correlate for the FDG signal in these settings of chronic colitis.
Materials and Methods
Mice
C3H/HeOuJ, IL-10−/− (C3Bir.129P2(B6)-Il10tm1Cgn/Lt)15 mice were obtained from Jackson Laboratory (Bar Harbor, ME). Gαi2−/− and Gαi2+/− (129Sv background) mice16 were bred at the UCLA Department of Laboratory and Animal Medicine. Unless otherwise specified, animals examined were all female and were age matched to controls within each experiment. All procedures involving animals were performed under approved protocols of the UCLA Animal Research Committee.
For Gαi2−/− CD3+ transfer experiments,17,18 lymphocytes were harvested from the spleen and mesenteric lymph nodes and Gαi2−/− CD3+ T cells were isolated using CD90 positive selection (Miltenyi Biotec, Auburn, CA). Eight-week-old B6.129 RAG1−/− mice (Jackson Laboratory) were injected intravenously with 1 × 10⁶ cells suspended in 100 μL saline. Anti-TL1A or isotype control antibody (500 μg) was administered intraperitoneally on the day of T-cell transfer and once weekly for 4 weeks before PET scans and terminal histology.
For CD4+ CD45RBhigh transfer experiments,19,20 CD4+ T cells were isolated from Balb/cJ spleen (Charles River, Wilmington, MA) using a CD4+ T-cell isolation kit (Miltenyi Biotec) and sorted into CD45RBhigh and CD45RBhigh + low populations using 2-color fluorescence-activated cell sorting (Becton Dickinson FACSVantage SE Sorting Flow Cytometer; San Jose, CA). The CD45RBhigh population was >98% pure. C.B-17 scid mice were intravenously injected with 8 × 10⁵ CD4+ CD45RBhigh or CD4+ CD45RBhigh + low T cells resuspended in 100 μL saline. Blood samples from mice at 2-week intervals posttransfer were used to perform blood counts performed by the UCLA Division of Laboratory Animal Medicine diagnostic laboratory.
For piroxicam experiments,21,22 4-week-old IL-10−/− mice were dish fed (ad libitum) mouse chow supplemented with piroxicam (200 ppm, by geometric dilution with powdered mouse chow) or plain ground chow (negative control) for either 1 or 2 weeks.
Cellular Assessment by Flow Cytometry and Histologic Studies
Small intestine (including jejunum and ileum) and large intestine (including cecum and colon) were harvested from euthanized mice. Superficial lamina propria cells were isolated from these compartments as previously described.23 In some cases, tissue was paraffin embedded and sectioned, stained with H&E, and scored by an experienced research pathologist using a histologic scoring system for inflammation and epithelial parameters.20
For flow cytometry, lamina propria cells were stained using standard 96-well microtiter plate staining technique. For Glut-1 analysis, cells were blocked with 5% goat serum (Sigma Chemical Co, St Louis, MO) for 30 minutes, plated at 1 × 10⁶/well (100 μL), incubated with 0.75 μg of anti-GLUT-1 (ab14683; Abcam, Cambridge, MA) for 30 minutes, and then incubated with other surface markers for an additional 30 minutes. Washed cells were incubated with 0.5 μg goat anti-rabbit immunoglobulin (Jackson Immunotech, West Grove, PA) for 30 minutes, washed, and fixed in 200 μL 2% paraformaldehyde. Anti-mouse monoclonal surface marker antibodies for CD4, CD8a, CD3, and CD11b were from PharMingen-BD (San Diego, CA) and F4/80 antibody was from eBioscience (San Diego, CA). Isotype- and species-matched antibodies were used as negative controls. Data acquisition was performed using a BD FACSCalibur (BD Biosciences, San Jose, CA) and analyzed using FCS Express 3 software (DeNovo Software, Ontario, Canada).
Statistics
Statistical analysis used GraphPad Prism software (GraphPad Software, San Diego, CA). Comparison of 2 groups was performed by 2-sided Student t test with 95% confidence interval. Linear regression was used to compare standard uptake value (SUV) and background subtracted Glut-1 mean fluorescence intensity values, or percent injected dose (ID)/g and histology score, derived from individual mice (Prism software; www.graphpad.com). For all statistical tests, significance was defined as P < .05.
microPET and microCT Scanning and Analysis
FDG synthesis was performed at the UCLA Cyclotron Facility. Mice were fasted for at least 4 hours before tracer injection. Age-matched experimental groups were anesthetized with 2% isoflurane gas before 200 μCi FDG intraperitoneal injection, throughout the 1-hour uptake, and during scans. For conscious uptake scans, mice were anesthetized 1 hour following injection. For studies requiring small intestine analysis, mice were oral gavaged with 100 μL of diatrizoate meglumine and diatrizoate sodium solution (MD-Gastroview; Mallinckrodt Inc, St Louis, MO) 1 hour before PET scanning. For studies involving large intestines, mice were also administered 200 μL MD-Gastroview rectally via a 3.5F catheter immediately before scan initiation. For all studies, each mouse’s bladder was expressed to minimize bladder signal interference due to normal excretion pathways. Mice were imaged using the microPET FOCUS 220 PET scanner (Siemens Preclinical Solutions, Knoxville, TN) and microCAT II CT scanner (Siemens Preclinical Solutions) in the Crump Institute for Molecular Imaging at UCLA. Each mouse experienced a 10-minute static PET scan followed by an 8-minute computed tomographic (CT) scan on 30°C heated scan beds. Upon completion of both scans, mice were allowed recovery time before being returned to vivarium.
Aligned PET and CT overlays were imported into AMIDE (amide.sourceforge.net) for analysis. Using a combination of whole-body CT cropping and contrast-based isocontour region of interest (ROI) definitions, small and large intestines ROIs were created (Figure 1). Individual decay-corrected FDG dosage, cylinder calibration factor, and animal weight were inputted into AMIDE for each mouse. PET statistics for ROIs were exported from AMIDE, and the mean per voxel SUV and percent ID/g were graphed and analyzed. SUV is distinct from percent ID/g by taking into account the weight of the animal, which can vary dramatically in mice with colitis. For ROIs that were not continuous, a combined value was obtained through a weighed average as follows: (Meani × Number of Fraction Voxelsi)/(Number of Fraction Voxelsi).
Figure 1.
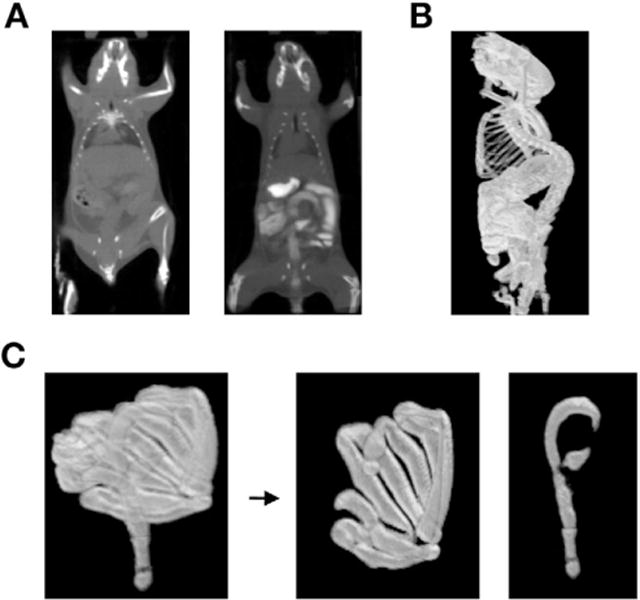
Definition of intestine ROI using AMIDE isocontour function and contrast agent. (A) CT imaging of mice with and without contrast agent. (B) Default CT isocontour ROI generated with contrast agent. (C) Processed whole intestines ROI separated into large and small intestines’ ROIs.
Results
Identifying and Quantifying FDG Uptake in the Small and Large Intestines
The intestine is a large, serpiginous, and mobile organ, and thus it is a challenge to create an objective and reproducible method to define regions of the intestine for microPET imaging. Clinically, intestinal segments are efficiently visualized by ingestion of x-ray contrast material. Adopting this approach, we found that a combination of gavaged and rectally administered intestinal contrast agent successfully imaged the intestines by CT (Figure 1A).
A second issue was to establish a standardized ROI for uptake measurements. Predefined ROIs could not be used, because the intestinal diameter, curvature, position, and length are dynamic and change even in a single mouse over time. As our first approach, we used a series of adjacent cylindrical ROIs across the intestines. However, this approach was labor intensive, was subjective, and underestimated the PET signal mean. Instead, we used the isocontour feature of an image analysis program (AMIDE) to highlight all areas above a CT threshold value. This resulted in an ROI containing the skeleton and digestive system, from which the skeleton was digitally removed (Figure 1B). As a further refinement, the whole intestine ROI was segmented using the cecum as the boundary to separate the small and large intestine for individual analysis (Figure 1C).
FDG uptake was represented using 2 values. First, mean percent ID/g was determined as a direct representation of mean uptake for small and large intestine ROIs. However, several factors affect intestine segmental ROIs: retained contrast agent volume, mouse age, inflammation-induced intestinal changes, gavage processing time, and mass of luminal contents. Therefore, we also calculated mean SUV, which corrects for these factors by representing percent ID/g on a per-voxel basis. Together, this set of detection and analytic procedures created a reproducible and reliable methodology to measure FDG signal in various intestinal regions.
Relationship of FDG Uptake and Inflammation in Gαi2−/− Mice
Gαi2−/− mice develop spontaneous colitis with variable age of onset that originates in the cecum and progresses over time distally into the large intestine. While a mild form of ileitis is often apparent, the predominating phenotype (fibrosis, lymphocyte inflammation, crypt abscess formation, mucus loss) as measured by histology is restricted to the large intestine.16 We therefore evaluated whether FDG uptake in intestinal ROIs could distinguish colitic Gαi2−/− mice from age-matched littermate heterozygous controls. In early trials, it became apparent that Gαi2−/− mice had increased susceptibility to death when anesthetized during the 1-hour uptake of FDG. Although less ideal due to increased muscle uptake of FDG, conscious uptake was used in these mice (and controls) to decrease mortality during scans.
As seen in Figure 2A and B, a clear distinction in FDG signal was readily observed by unaided comparison of pseudo-colored heat maps of FDG signal. Small and large intestine ROIs were quantitated for mean SUV and percent ID/g signal of single terminal scans in individual 12-to 24-week-old Gαi2−/− and control Gαi2+/− mice (Figure 2C). The FDG values of control Gαi2+/− mice had low FDG uptake and clustered tightly regardless of weight or age. In contrast, FDG uptake was heterogeneous among individual Gαi2−/− mice, with an increased mean FDG uptake in this group that was statistically significant compared with controls. Because the timing and degree of disease onset in Gαi2−/− mice are variable, the heterogeneity of FDG uptake suggested that it might reflect the authentic variation in disease state. A similar pattern of increased FDG uptake was also observed in Gαi2−/− small intestine. This was unexpected, because clinical or histologic enteritis of the small intestine is not prominent in this model. In young knockouts before onset of disease, FDG uptake was comparable to age-matched controls. Thus, the FDG signal was inflammation specific (data not shown).
Figure 2.

FDG-PET in Gαi2−/− and control mice. (A) Coronal and (B) sagittal views of CT-PET overlays and PET images of Gαi−/− and heterozy-gote control mice with large intestine contrast agent. (C) Quantitation of mean SUV and mean percent ID/g per voxel in small and large intestine ROIs for individual mice. Gαi2−/−, squares; Gαi2+/− controls, triangles.
Severe colitis can be induced by transfer of Gαi2−/− CD3+ T cells into RAG−/− recipients but with the advantage of more predictable onset of disease.18 TL1A is a tumor necrosis factor-like molecule that promotes lymphocyte activation in the intestinal mucosa. Colitis is associated with elevated TL1A in inflamed mucosa,24,25 and targeting this molecule reduces the severity of intestinal inflammation.26 We therefore tested the relationship of an-ti-TL1A treatment with histologic inflammation and FDG uptake.
The anti-TL1A-treated mice had significantly lower FDG uptake compared with mice treated with control antibody by visual inspection (Figure 3A and B) and by quantitation using percent ID/g and SUV (Figure 3C). Elevated histologic scores in both sets of mice showed the presence of severe colitis. However, both percent ID/g and histologic score for colitis were decreased in anti-TL1A-treated mice (Figure 3D). The correlation of reduced histologic score and FDG signal with this antiinflammatory agent was highly significant (r2 = 0.92, P = .003), showing that FDG-PET reflected histologic assessment of response to treatment.
Figure 3.

FDG-PET in Gd2−/−CD3+ cell transfer colitis. (A) Coronal and (B) sagittal views of PET-CT overlays and PET images of mice treated with anti-TL1A or control antibody. (C) Quantification of mean percent ID/g and mean SUV per voxel in the large intestine for individual mice. (D) Values for histology score and percent ID/g in the large intestine were plotted and analyzed by linear regression. (C and D) Anti-TL1A and control antibody values are represented by closed and open squares, respectively.
FDG Uptake in Young IL-10−/− Mice With Mild Immune Colitis
While FDG-PET distinguished colitic mice from controls in a severe model of colitis, we investigated whether the same divergence would be observable in a model of milder colitis. Mice bearing the IL-10−/− genotype on a susceptible background predictably develop mild spontaneous colitis at a young age (~6 weeks).15 These traits allowed us to follow disease and evaluate FDG uptake longitudinally in individual mice. Using unconscious FDG uptake, tolerated by IL-10−/− mice, we analyzed 3 independent sets of mice, serially measured multiple times from early age (5–6 weeks) to mature adult age (13–14 weeks).
In C3H/OuJ mice, FDG uptake for both small intestine and large intestine was high in very young mice (5–6 weeks), which declined to a lower level in adult mice (>9 weeks) (Figure 4C and D). This finding agreed with high abundance and subsequent decline of activated T cells during normal intestinal ontogeny.27 In IL-10−/− mice, FDG uptake was similarly elevated in 5- to 6-week-old mice before evidence of colitis. However, in contrast to C3H/OuJ controls, they did not decline with age. In the large intestine, elevated FDG uptake was statistically significant for IL-10−/− versus control mice by mean SUV and percent ID/g values at all ages (Figure 4C and D). An example of the imaging is shown in Figure 4A and B. In the small intestine, FDG uptake was also statistically elevated for IL-10−/− versus control mice (after the period of physiologic decline). Notably, enterocolitis in IL-10−/− mice can affect the duodenum, jejunum, and colon,28 which may account for FDG uptake in the small intestine. Thus, the IL-10−/− condition either prevents the ontogenic reduction of intestinal CD4+ T-cell activation or initiates a local process that induces their activation.
Figure 4.
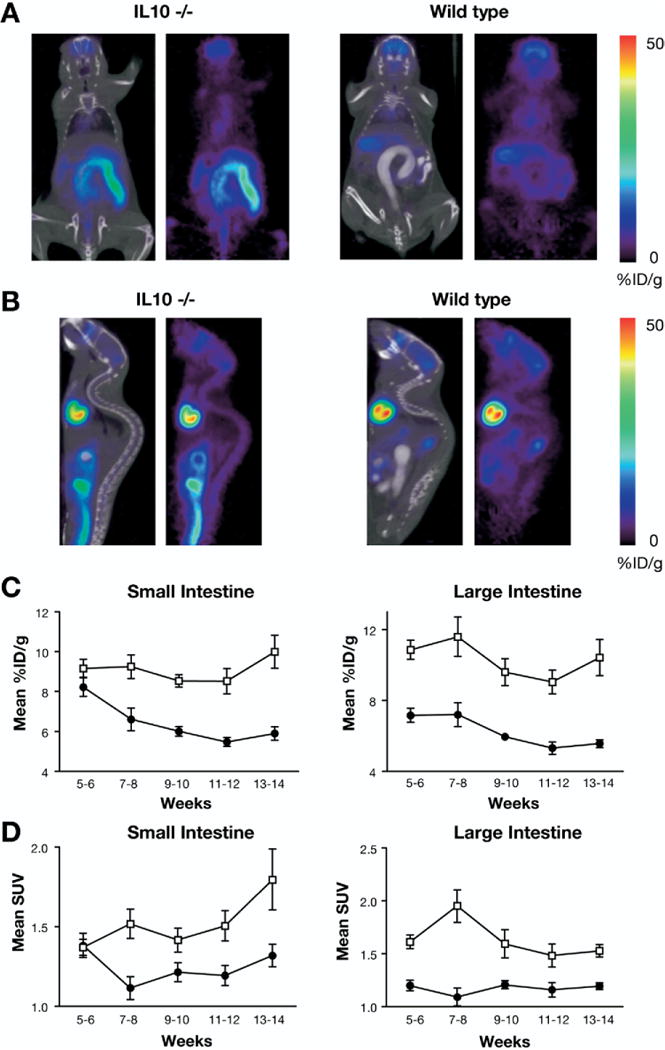
FDG-PET in IL-10−/− and control mice. (A) Coronal and (B) sagittal views of CT and PET overlays of L-10−/− and C3H/OuJ control mice with large intestine contrast agent. Average (±SEM) of (C) mean percent D/g and (D) mean SUV for all mice scanned in indicated time interval. IL-10−/−, open squares; C3H/OuJ control, closed circles.
The effect of augmented inflammation in IL-10−/− mice was assessed with the NSAID piroxicam, which intensifies colitis by impairing intestinal barrier function and altering cytokine profiles.22 After 1 week, FDG SUV and percent ID/g were increased in treated versus untreated IL-10−/− mice (Figure 5A and B). The severe inflammation in piroxicam-treated mice also was accompanied with FDG uptake in the mesenteric lymph nodes (Figure 5C–E). These findings indicated that FDG-PET quantitatively delineated inflammation ranging from the preclinical state of young IL-10−/− mice to the exacerbated inflammation associated with piroxicam treatment.
Figure 5.

Effect of piroxicam-in-duced inflammation on FDG uptake by IL-10−/− mice. (A) Quantitation of mean SUV and (B) percent ID/g in small and large intestine ROIs for IL-10−/− mice treated or untreated with piroxicam. (C) Coronal, (D) sagittal, and (E) transverse views of piroxicam-treated mice. (F) Correlation of histology and mean percent ID/g for individual C3H/OuJ (closedcircles), IL-10−/− (open squares), and piroxicam-treated L-10−/− mice (closedsquares). ns, not significant.
The correlation of colonic FDG uptake and inflammation (histology score) was assessed in IL-10−/− and control C3H/OuJ mice (age 5–20 weeks) and in young IL-10−/− mice (age 5 weeks) with piroxicam treatment (Figure 5F). As expected, percent ID/g and histology score were low and tightly clustered in C3H/OuJ controls. However, in young IL-10−/− mice (age 5–14 weeks), with or without piroxicam, the 2 measurements were not significantly correlated by linear regression (r2 < 0.15; P < .10). It should be noted that the acute colitis elicited by piroxicam resulted in 60%–70% animal mortality at 1 week, and those alive at that point did not survive anesthesia associated with imaging. Two IL-10−/− mice surviving to later age (~20 weeks of age) had both elevated percent ID/g and histology, indicating that histologic change was a late correlate of disease activity.
Cellular Source of Intestinal FDG Uptake
A variety of inflammatory cell types are recruited to the intestine in colitis associated with IL-10 and Gαi2 genetic deficiencies and with NSAID treatment.21,29 We therefore performed a series of measurements to delineate the cellular source of the FDG signal. First, we isolated and enumerated small and large intestinal mononuclear cell types known to uptake FDG (macrophages8 and T-cell subsets) from individual mice under these different conditions after scanning and correlated absolute numbers with FDG SUV and percent ID/g measurements. However, no significant correlations were observed in numbers of immune cell subpopulations and PET measurements (data not shown).
We therefore considered the idea that FDG uptake reflected increased levels of Glut-1 expression (presumably due to activation levels) in the intestinal immune cell types. To test this idea, intestinal mononuclear cells were isolated from individual mice after FDG-PET and stained for Glut-1 and subset markers. By flow cytometric analysis, macrophages and CD8+ T cells showed no significant elevation in Glut-1 levels in colitic mice over control; in fact, macrophages in all noncolitic mice had higher Glut-1 levels (Figure 6A–C). In contrast, CD4+ T cells displayed significantly elevated Glut-1 expression in all colitic mice (Gαi2−/−, IL-10−/−, and piroxicam-treated IL-10−/− mice). To validate this observation, FDG signal and Glut-1 expression were compared for each of these intestinal cell types. IL-10−/− mice with and without piroxicam were analyzed, because they showed the greatest range of FDG signal. We measured FDG uptake in individual mice and then immediately isolated intestinal cells from each mouse for flow cytometric analysis of Glut-1 expression. For the correlation analysis, Glut-1 levels (mean fluorescence intensity) were converted to units (δ mean fluorescence intensity) by subtracting background mean fluorescence intensity; percent ID/g rather than SUV was used because it represents absolute rather than normalized uptake. In 2 independent experiments, Glut-1 expression in CD4+ T lymphocytes was distinguished from other intestinal subtypes for their significant correlation with FDG uptake (r = 0.81; P = .05) (Figure 6D–F). These findings suggest that changes in Glut-1 expression in CD4+ T cells are the main driver of FDG signal in these settings.
Figure 6.

Glut-1 surface expression by intestinal cell types. Intestinal cells were isolated, and flow cytometry was performed on cells stained for lineage markers and Glut-1 in Gαi2−/− (blue) and Gd2+/− (red) mice; cells stained with negative control for Glut-1 (black). (A) CD3+CD4+ T cells, (B) macrophages (CD11b+F4/80+), (C) CD3+CD8+ T cells. Glut-1 levels in intraepithelial mononuclear cell populations. Intraepithelial lymphocyte mononuclear cells were isolated from the large intestine of individual IL-10−/− mice with or without 2 weeks of piroxicam treatment and stained for lineage markers and Glut-1. Cells were gated on (D) CD3+CD4+ T cells, (E) F4/80+CD11b+ cells, or (F) CD3+CD8+ T cells. Glut-1 levels (S mean fluorescence intensity) were tabulated. Glut-1 levels and percent ID/g for individual mice were graphed, and correlation analysis was used to calculate P values. n/s, not significant.
Relationship of FDG Uptake to Quiescent Versus Active CD4+ T Cells: CD45RBhigh Colitis
The foregoing indicated that activated CD4+ T cells, which display elevated Glut-1 levels, were the main cellular source of mucosal FDG uptake. To validate this finding in vivo, isolated CD4+ T cells were transferred into lymphocyte-deficient (scid) mice, under conditions where they are known to home to the intestine but their activation and colitigenicity can be manipulated.19 Specifically, we compared scid mice transferred with CD4+ CD45RBhigh T cells (activation and colitis), a mixture of CD4+ CD45RBhigh + low T cells (minimal activation and no colitis), or control mice without any cells transferred.
CD4+ CD45RBhigh mice, but not CD4+ CD45RBhigh + low mice, displayed elevated FDG uptake compared with scid controls, with significant differences observed at about 3 weeks posttransfer (Figure 7A and E–G). This finding was associated with colitis by 4 criteria. First, body weight declined in CD4+ CD45RBhigh mice (beginning day 27) but not in other groups (Figure 7B). Second, peripheral blood neutrophilia occurred in CD4+ CD45RBhigh mice, but not in the other groups, beginning 2 weeks posttransfer (Figure 7C). Third, anemia (reduced mean corpuscular hemoglobin level) developed exclusively in CD4+ CD45RBhigh mice, beginning 3 weeks posttransfer (Figure 7D). Fourth, histology scores were elevated in CD4+ CD45RBhigh mice (6.1 ± 3; P < .03 compared with scid) but were not significantly different in CD4+ CD45RBhigh + low mice (0.6 ± 0.5) and scid mice (0.6 ± 0.3) (Figure 7G). By 6 weeks, half of the CD4+ CD45RBhigh mice had died due to complications of colitis, so the colitis scores underestimate the severity of disease in this group.
Figure 7.

FDG-PET in CD4+ CD45RBhigh transfer colitis. (A) Coronal and sagittal views of CD4+ CD45RBhigh, CD4+ CD45RBhigh + low, and nontransferred C.B-17 scid mice. (B) Body weight over time (days) for CD4+ CD45RBhigh (open squares), CD4+CD45RBhigh + low (closed triangles), and C.B-17 scid (closed circles) mice. (C) Peripheral blood neutrophil numbers over time. (D) Mean corpuscular hemoglobin levels over time. (E) Mean percent ID/g over time. (F) Mean SUV over time. (G) Comparison of histology score and percent ID/g (day 42), analyzed by linear regression. For C–F, statistical comparison of each group by Student t test to the scid group is shown by asterisks: *P < .02; **P < .001; ***P < .0001. Comparisons for CD4+ CD45RBhigh + low mice were nonsignificant for all assays and time points.
At 4 and 6 weeks posttransfer, FDG uptake was increased in CD4+ CD45RBhigh compared with scid mice by percent ID/g and SUV analysis (Figure 7E and F). In contrast, FDG uptake was low in CD4+ CD45RBhigh + low and scid mice, and there was no significant difference between them. These experiments validated that activated mucosal CD4+ T cells, which form in CD45RBhigh mice due to the absence of Treg control, produced substantial FDG uptake. Conversely, whereas transfer of CD45RBhigh + low CD4+ T cells resulted in substantial mucosal T-cell accumulation,30,31 they did not induce FDG uptake above the levels of lymphocyte-deficient scid mice. These observations provide further evidence that the elevated FDG uptake in colitic mice is a manifestation of activated CD4+ T cells.
Discussion
Using an improved quantitation methodology for murine intestinal FDG uptake, this study addresses the cellular source of intestinal FDG uptake and its relationship to different stages of immune colitis. In 2 models of severe immune colitis (Gαi2−/− and CD4+ CD45RBhigh mice), and in anti-TL1A biologic therapy, FDG uptake was highly correlated with mucosal inflammation as measured by histology score. Flow cytometry showed that mucosal FDG uptake was specifically correlated with Glut-1 (glucose transporter) expression by CD4+ T cells. CD4+ T-cell transfers in vivo confirmed that mucosal FDG uptake involved activated but not quiescent cells. These observations refined the quantitation of FDG-PET for longitudinal assessment of intestinal inflammation and identified the major cellular source of FDG uptake in different settings of murine colitis.
In the mild immune colitis of young IL-10−/− mice, and after acute exacerbation with the NSAID piroxicam, disease activity (clinical symptoms and mortality) correlated with FDG uptake but occurred without elevation of histology score. In a variety of mouse colitis models, including piroxicam colitis,21,29 mucosal CD4+ T-cell activation is an early event that precedes the expansion in mucosal T cells through trafficking and proliferation.32 Histology score measures the abundance of tissue lymphocytes and elements of tissue damage and thus assesses a later stage of tissue inflammation. In contrast, FDG uptake specifically detects T-cell activation and thus is uniquely useful for detecting this cellular element of disease-associated inflammatory response. The early-stage colitis in IL-10−/− mice, and the acuteness of piroxicam exacerbation, may predominate with activated CD4+ T cells before extensive T-cell trafficking and is likely to account for the greater sensitivity of FDG uptake compared with histology score.
This study confirmed the reported correlation of elevated FDG uptake and disease state in mouse colitis models14 and by extension with human ulcerative colitis and Crohn’s disease. Although varying in ROI definition and quantification method, 4 independent clinical studies involving between 12 and 59 patients positively correlated segmented intestinal FDG uptake to the presence of ileocolonoscopy lesions with sensitivities of 73%–95%.10–13 The methodology of ROI determination where specified used either a normalized or absolute maximum SUV. Maximum SUV is useful for identifying focal disease activity and does not require formal definition of ROIs. However, this technique does not permit assessment of surrounding intestinal voxels. Quantitative measures that integrate the net level of disease activity, or areas of low but clinically significant disease activity, may be a complement or alternative for defining disease activity.10,11
An interesting issue confronted by these clinical studies was the detection of “false positives” (elevated FDG uptake without clinically active lesions). For example, Pio et al14 and our study showed that FDG uptake in some settings did not directly correlate with disease activity as defined by histology score. The present study suggests an alternate interpretation for such “false positives.” In young and piroxicam-treated IL-10−/− mice, elevated FDG uptake was associated with increased Glut-1 expression by intestinal CD4+ T cells before elevation of histology score but was clearly associated with disease activity (mortality). In chronic, severe colitis (older IL-10−/− mice as well as CD4+ CD45RBhi and Gαi2−/− mice), FDG uptake, histology score, and other clinical measures of disease activity were highly correlated. It thus appears that in early immune colitis, FDG uptake (and, accordingly, levels of intestinal activated CD4+ T cells) is a sensitive correlate of disease activity, even before bulk influx of lymphocytes (detected by histology score). Accordingly, we speculate that in patients such FDG uptake may also represent sites of elevated CD4+ T-cell activation.
Overall, this study contributes to the understanding and utility of assessing intestinal inflammation with FDG. It establishes the cellular source of the intestinal FDG signal (mucosal accumulation of activated CD4+ T cells). The ability of FDG-PET to detect both exacerbation (piroxicam) and amelioration (anti-TL1A) of colitis supports a basis for its use to monitor disease state and treatment response. It also suggests a plausible explanation for false positives observed in clinical FDG studies assessing inflammatory bowel disease. That is, the progression of FDG uptake to increased histology score indicates that FDG uptake (levels of activated mucosal CD4+ T cells) can be more sensitive than total numerical inflammatory cell accumulation (detected by conventional histology) in delineating emerging or early intestinal inflammation. Accordingly, FDG update may complement standard assessment of intestinal inflammation and therefore may add diagnostic utility in animal or human settings where disease progression can be attributed to activated CD4+ T cells. However, the utility of this assessment, and its use in early intervention to avert clinical relapse, will need to be compared with existing diagnostic (CT enteroclysis, magnetic resonance imaging) or prognostic tests (fecal calprotectin) in terms of test accuracy, costs, and risk.
Acknowledgments
Supported by National Institutes of Health grants DK46763 (to S.R.T., J.B., and O.T.), DK56328 (to S.R.T.), CA86306 (to J.B.), GM07185 (to M.M.), AI52031 (to S.B.), and CA016042 (Jonsson Comprehensive Cancer Center Flow Cytometry).
The authors thank CoGenesys Inc (Rockville, MD) for the 19E06A anti-TL1A hybridoma; El Khansa Kaicer for breeding and experimental assistance; the staff of the Crump Institute microPET core facility and Jonsson Comprehensive Cancer Center flow cytometry core facility; Dr David Stout for his suggestions on PET quantitation techniques; Owen Witte, Daniel Silverman, and Caius Radu for critical review of the manuscript; Anna Wu for filial and scientific guidance; and members of the Braun and Gordon laboratories for their advice and support.
The authors acknowledge that Sarah Brewer and Michael McPherson contributed equally to this work and should be considered co-first authors.
Abbreviations used in this paper
- CT
computed tomography
- FDG
2-Deoxy-2-[18F]fluoro-D-glucose
- Glut-1
glucose transporter 1
- ID
injected dose
- IL
interleukin
- PET
positron emission tomography
- ROI
region of interest
- SUV
standard uptake value
References
- 1.MacDonald TT, Monteleone G. Immunity, inflammation, and allergy in the gut. Science. 2005;307:1920–1925. doi: 10.1126/science.1106442. [DOI] [PubMed] [Google Scholar]
- 2.Xavier RJ, Podolsky DK. Unravelling the pathogenesis of inflammatory bowel disease. Nature. 2007;448:427–434. doi: 10.1038/nature06005. [DOI] [PubMed] [Google Scholar]
- 3.Baumgart DC, Sandborn WJ. Inflammatory bowel disease: clinical aspects and established and evolving therapies. Lancet. 2007;369:1641–1657. doi: 10.1016/S0140-6736(07)60751-X. [DOI] [PubMed] [Google Scholar]
- 4.Herschman HR. Micro-PET imaging and small animal models of disease. Curr Opin Immunol. 2003;15:378–384. doi: 10.1016/s0952-7915(03)00066-9. [DOI] [PubMed] [Google Scholar]
- 5.Frauwirth KA, Riley JL, Harris MH, et al. The CD28 signaling pathway regulates glucose metabolism. Immunity. 2002;16:769–777. doi: 10.1016/s1074-7613(02)00323-0. [DOI] [PubMed] [Google Scholar]
- 6.Fox CJ, Hammerman PS, Thompson CB. Fuel feeds function: energy metabolism and the T-cell response. Nat Rev Immunol. 2005;5:844–852. doi: 10.1038/nri1710. [DOI] [PubMed] [Google Scholar]
- 7.Ishimori T, Saga T, Mamede M, et al. Increased (18)F-FDG uptake in a model of inflammation: concanavalin A-mediated lymphocyte activation. J Nucl Med. 2002;43:658–663. [PubMed] [Google Scholar]
- 8.Kubota R, Yamada S, Kubota K, et al. Intratumoral distribution of fluorine-18-fluorodeoxyglucose in vivo: high accumulation in macrophages and granulation tissues studied by microautoradiography. J Nucl Med. 1992;33:1972–1980. [PubMed] [Google Scholar]
- 9.Radu CG, Shu CJ, Shelly SM, et al. Positron emission tomography with computed tomography imaging of neuroinflammation in experimental autoimmune encephalomyelitis. Proc Natl Acad Sci USA. 2007;104:1937–1942. doi: 10.1073/pnas.0610544104. [DOI] [PMC free article] [PubMed] [Google Scholar]
- 10.Louis E, Ancion G, Colard A, et al. Noninvasive assessment of Crohn’s disease intestinal lesions with (18)F-FDG PET/CT. J Nucl Med. 2007;48:1053–1059. doi: 10.2967/jnumed.107.040436. [DOI] [PubMed] [Google Scholar]
- 11.Meisner RS, Spier BJ, Einarsson S, et al. Pilot study using PET/CT as a novel, noninvasive assessment of disease activity in inflammatory bowel disease. Inflamm Bowel Dis. 2007;13:993–1000. doi: 10.1002/ibd.20134. [DOI] [PubMed] [Google Scholar]
- 12.Loffler M, Weckesser M, Franzius C, et al. High diagnostic value of 18F-FDG-PET in pediatric patients with chronic inflammatory bowel disease. Ann N Y Acad Sci. 2006;1072:379–385. doi: 10.1196/annals.1326.014. [DOI] [PubMed] [Google Scholar]
- 13.Neurath MF, Vehling D, Schunk K, et al. Noninvasive assessment of Crohn’s disease activity: a comparison of 18F-fluorodeoxyglu-cose positron emission tomography, hydromagnetic resonance imaging, and granulocyte scintigraphy with labeled antibodies. Am J Gastroenterol. 2002;97:1978–1985. doi: 10.1111/j.1572-0241.2002.05836.x. [DOI] [PubMed] [Google Scholar]
- 14.Pio BS, Byrne FR, Aranda R, et al. Noninvasive quantification of bowel inflammation through positron emission tomography imaging of 2-deoxy-2-[18F]fluoro-D-glucose-labeled white blood cells. Mol Imaging Biol. 2003;5:271–277. doi: 10.1016/s1536-1632(03)00103-3. [DOI] [PubMed] [Google Scholar]
- 15.Mahler M, Leiter EH. Genetic and environmental context determines the course of colitis developing in IL-10-deficient mice. Inflamm Bowel Dis. 2002;8:347–355. doi: 10.1097/00054725-200209000-00006. [DOI] [PubMed] [Google Scholar]
- 16.Rudolph U, Finegold MJ, Rich SS, et al. Ulcerative colitis and adenocarcinoma of the colon in G alpha i2-deficient mice. Nat Genet. 1995;10:143–150. doi: 10.1038/ng0695-143. [DOI] [PubMed] [Google Scholar]
- 17.Bjursten M, Willen R, Hultgren Hornquist E. Transfer of colitis by Galphai2-deficient T lymphocytes: impact of subpopulations and tissue origin. Inflamm Bowel Dis. 2005;11:997–1005. doi: 10.1097/01.mib.0000185401.27170.22. [DOI] [PubMed] [Google Scholar]
- 18.Wei B, Velazquez P, Turovskaya O, et al. Mesenteric B cells centrally inhibit CD4+ T cell colitis through interaction with regulatory T cell subsets. Proc Natl Acad Sci U S A. 2005;102:2010–2015. doi: 10.1073/pnas.0409449102. [DOI] [PMC free article] [PubMed] [Google Scholar]
- 19.Leach MW, Bean AG, Mauze S, et al. Inflammatory bowel disease in C.B-17 scid mice reconstituted with the CD45RBhigh subset of CD4+ T cells. Am J Pathol. 1996;148:1503–1515. [PMC free article] [PubMed] [Google Scholar]
- 20.Aranda R, Sydora BC, McAllister PL, et al. Analysis of intestinal lymphocytes in mouse colitis mediated by transfer of CD4+, CD45RBhigh T cells to SCID recipients. J Immunol. 1997;158:3464–3473. [PubMed] [Google Scholar]
- 21.Berg DJ, Zhang J, Weinstock JV, et al. Rapid development of colitis in NSAID-treated IL-10-deficient mice. Gastroenterology. 2002;123:1527–1542. doi: 10.1053/gast.2002.1231527. [DOI] [PubMed] [Google Scholar]
- 22.Hale LP, Gottfried MR, Swidsinski A. Piroxicam treatment of IL-10-deficient mice enhances colonic epithelial apoptosis and mucosal exposure to intestinal bacteria. Inflamm Bowel Dis. 2005;11:1060–1069. doi: 10.1097/01.mib.0000187582.90423.bc. [DOI] [PubMed] [Google Scholar]
- 23.Velazquez P, Wei B, McPherson M, et al. Villous B cells of the small intestine are specialized for invariant NK T cell dependence. J Immunol. 2008;180:4629–4638. doi: 10.4049/jimmunol.180.7.4629. [DOI] [PMC free article] [PubMed] [Google Scholar]
- 24.Bamias G, Mishina M, Nyce M, et al. Role of TL1A and its receptor DR3 in two models of chronic murine ileitis. Proc Natl Acad Sci U S A. 2006;103:8441–8446. doi: 10.1073/pnas.0510903103. [DOI] [PMC free article] [PubMed] [Google Scholar]
- 25.Papadakis KA, Zhu D, Prehn JL, et al. Dominant role for TL1A/ DR3 pathway in IL-12 plus IL-18-induced IFN-gamma production by peripheral blood and mucosal CCR9+ T lymphocytes. J Immunol. 2005;174:4985–4990. doi: 10.4049/jimmunol.174.8.4985. [DOI] [PubMed] [Google Scholar]
- 26.Takedatsu H, Michelsen KS, Wei B, et al. TL1A (TNFSF15) regulates the development of chronic colitis by modulating both T-Helper 1 and T-Helper 17 activation. Gastroenterology. 2008;135:550–565. doi: 10.1053/j.gastro.2008.04.037. [DOI] [PMC free article] [PubMed] [Google Scholar]
- 27.Maloy KJ, Mowat AM, Zamoyska R, et al. Phenotypic heterogeneity of intraepithelial T lymphocytes from mouse small intestine. Immunology. 1991;72:555–562. [PMC free article] [PubMed] [Google Scholar]
- 28.Kuhn R, Lohler J, Rennick D, et al. Interleukin-10-deficient mice develop chronic enterocolitis. Cell. 1993;75:263–274. doi: 10.1016/0092-8674(93)80068-p. [DOI] [PubMed] [Google Scholar]
- 29.Yamagiwa S, Yoshida Y, Halder RC, et al. Mechanisms involved in enteropathy induced by administration of nonsteroidal antiinflammatory drugs (NSAIDS) Dig Dis Sci. 2001;46:192–199. doi: 10.1023/a:1005678312885. [DOI] [PubMed] [Google Scholar]
- 30.Kunisawa J, Kurashima Y, Higuchi M, et al. Sphingosine 1-phosphate dependence in the regulation of lymphocyte traf-ficking to the gut epithelium. J Exp Med. 2007;204:2335–2348. doi: 10.1084/jem.20062446. [DOI] [PMC free article] [PubMed] [Google Scholar]
- 31.Maloy KJ, Salaun L, Cahill R, et al. CD4+CD25+ T(R) cells suppress innate immune pathology through cytokine-dependent mechanisms. J Exp Med. 2003;197:111–119. doi: 10.1084/jem.20021345. [DOI] [PMC free article] [PubMed] [Google Scholar]
- 32.Strober W, Fuss IJ, Blumberg RS. The immunology of mucosal models of inflammation. Annu Rev Immunol. 2002;20:495–549. doi: 10.1146/annurev.immunol.20.100301.064816. [DOI] [PubMed] [Google Scholar]