

Abstract
Objectives
Both diabetes mellitus and magnetic resonance image (MRI) deep white matter hyperintensities (WMHs) are more common in bipolar disorder (BD) patients than in matched controls. Deep—as opposed to periventricular—WMHs and diabetes are associated with treatment resistance and poorer outcome. This study investigated whether brain glucose metabolism by the polyol pathway—a pathway linked to nervous tissue disease in diabetes—is related to deep WMH volume and treatment resistance in BD patients.
Methods
Volumes of fluid-attenuated inversion recovery WMHs were quantified and correlated with cerebrospinal fluid (CSF) concentrations of glucose metabolites in 20 nondiabetic patients with BD and nondiabetic comparison subjects with schizophrenia (n = 15) or transient neurologic symptoms (neurologic controls, n = 15).
Results
BD patients, but not schizophrenic patients, had significantly greater volumes of deep but not periventricular WMHs compared to neurologic controls. BD subjects also had significantly greater CSF concentrations of sorbitol and fructose (the polyol pathway metabolites of glucose) compared to controls. Significant positive correlations between CSF metabolites and WMH volumes were found only in the BD group and were between deep WMH volumes and CSF sorbitol (ρ = 0.487, p = 0.029) and fructose (ρ = 0.474, p = 0.035). An index of treatment resistance correlated significantly with deep WMH volume (ρ = 0.578, p = 0.008), sorbitol (ρ = 0.542, p = 0.013), and fructose (ρ = 0.692, p = 0.001) in BD subjects but not in other subjects.
Conclusions
This is the first reported evidence of relationships between abnormal brain glucose metabolism and both deep WMHs and treatment resistance in a group of BD patients. Further studies are necessary to determine the significance of these findings to BD pathophysiology.
Keywords: bipolar disorder, fructose, glucose, hyperintensities, polyol, sorbitol, white matter
Recent studies suggest a relationship between treatment resistance and magnetic resonance image (MRI) hyperintensities in deep—as opposed to periventricular—white matter in bipolar disorder (BD) patients (1, 2). White matter hyperintensities (WMHs) are the most consistent structural neuro-imaging finding in BD patients (3), and may represent lesions that interrupt axons, resulting in disconnection among cortical and limbic structures.
Investigators have studied the relationship of WMHs in general—in both deep and periventricular white matter—to numerous demographic and clinical features of BD patients. WMHs have been reported to increase with age in some studies of BD patients (4–7), but not in others (8–11). WMHs do not appear to be related to severity of depression in BD (4, 9, 10) or to psychosis (4, 11–13). A relationship to cognitive impairment, demonstrated by neuropsychological testing, has been reported in some (9, 10) but not all studies (13). Finally, WMHs in general (9, 10), but not periventricular WMHs (4), have been associated with a greater number of psychiatric hospitalizations in BD patients. Although there have been inconsistencies in the literature, the associations of WMHs with treatment resistance, increased hospitalization, cognitive impairment, and most recently increased suicide risk in individuals with BD or recurrent major depression (1, 2, 9, 10, 14, 15) suggest that WMHs represent clinically relevant brain disease in patients with major affective disorders.
WMH pathogenesis is diverse and can include inflammatory, vascular, toxic, metabolic, infectious, traumatic, hydrocephalic, and neoplastic processes (16). The strongest risk factors for WMHs in the general population are advanced age, hypertension, diabetes mellitus, and cardiac disease (17, 18). Accordingly, WMHs in late-life-onset affective disorders are associated with vascular risk factors (19); however, the pathogenesis of WMHs in younger patients is unclear. Investigators who have controlled for vascular risk factors in younger adult samples of BD patients have found increased WMHs compared to controls after excluding individuals with vascular risk factors (4) and have found that the ability of vascular risk factors to predict WMHs is lost after entering age as a predictor variable (5). At least four hypotheses have been advanced: in-utero infection or toxic insult; platelet hypercoagulability; cerebral autosomal dominant arteriopathy; and inflammation (1, 20–22).
We have proposed a metabolic hypothesis of WMH pathogenesis based on increased diabetes prevalence in BD patients (23–26); associations between diabetes mellitus and WMHs in the general population (18); and associations between treatment resistance and diabetes in BD patients (25). We hypothesized that abnormal brain glucose metabolism, specifically increased conversion of glucose to sorbitol through the polyol pathway, contributes to white matter lesions, manifested by WMHs that underlie treatment resistance. We have also previously reported elevated cerebrospinal fluid (CSF) sorbitol concentration in nondiabetic patients with bipolar and unipolar disorders (27) and a positive correlation between elevated CSF sorbitol and deep WMHs in patients with treatment-resistant affective disorders (28).
The polyol pathway, also called the ‘sorbitol pathway,’ is a minor metabolic pathway of glucose running parallel to glycolysis and found throughout the body. Its initial and rate limiting enzyme, aldose reductase, uses NADPH to reduce glucose to sorbitol, which can then be oxidized to fructose by sorbitol dehydrogenase through reduction of NAD+ to NADH. Under normal conditions, glucose flux through this pathway is limited due to the 100-fold lower affinity of aldose reductase for glucose compared to hexokinase, the initial enzyme of glycolysis. However, under certain conditions, which include hyperglycemia, hyperosmotic stress, and ischemia, polyol pathway activity increases significantly through enzyme activation and increased glucose availability. Increased metabolism of glucose by the polyol pathway, and the consequent intracellular accumulation of sorbitol—a six-carbon, straight chain polyol (polyhydric alcohol)—have been implicated in diabetic complications including neuropathy (29). Increased polyol pathway activity is hypothesized to cause axonal disease through several mechanisms, including osmotic stress due to intracellular sorbitol accumulation as well as through oxidative and ischemic cellular stresses (30). Although polyol pathway activity has not been directly linked to white matter disease in diabetes, sorbitol does accumulate in the CSF of individuals with diabetes (31) and in the cerebral cortex of animals with experimentally induced diabetes (32). Pharmacologic blockade of the pathway improves central nerve conduction in an animal model of diabetes (33). Furthermore, early-life-onset white matter disease has been linked to inborn errors of polyol metabolism (34–36).
Animal studies indicate that CSF and brain sorbitol can increase dramatically with hyperglycemia without a parallel increase in plasma sorbitol (37). This is a function of the brain’s far greater rate of glucose metabolism and the limited movement of sorbitol across the blood-brain barrier. The CSF to plasma sorbitol ratio is approximately 15:1 (38). Based on the disproportionate accumulation of sorbitol in CSF, and reports of impaired glucose tolerance in BD patients that precede frank diabetes mellitus (23, 39), we hypothesized further that hyperglycemia predisposes individuals with BD to pathologic increases in brain polyol pathway activity without significantly increasing peripheral polyol pathway activity. This could explain the presence of polyol pathway-related white matter disease without peripheral neuropathy.
In this study, we combined in vivo neuroimaging with in vitro biochemistry to investigate the relationship of WMHs to brain polyol pathway metabolism in BD patients. We included comparison groups of schizophrenic and neurologic control patients to assess the specificity of this relationship.
Patients and methods
Patients
Subjects, aged 18 to 59 years, provided written informed consent to participate in this Institutional Review Board approved study. Psychiatric subjects were recruited from inpatient and outpatient services at the University of Maryland Medical Center (UMMC). BD subjects (n = 20) had bipolar I disorder confirmed by a board-certified psychiatrist (WTR) based on Structured Clinical Interview for the Diagnostic and Statistical Manual, 4th edition (SCID) criteria (40). Specific diagnoses were: manic, severe with catatonic features (n = 3); manic, severe with psychotic features (n = 4); manic, severe without psychotic features (n = 2); manic, in partial remission (n = 3); depressed, severe, without psychotic features (n = 3); and depressed, in partial remission (n = 5). Three bipolar subjects were recruited after having lumbar punctures during evaluation for altered mental status by clinicians unaffiliated with this study. In all cases, there was no infectious, toxic, or neurologic cause found, and altered mental status was determined to be a catatonic manifestation of BD. Mood state was assessed within 24 hours of lumbar puncture by the 21-item Hamilton Rating Scale for Depression (41) and the Young Mania Rating Scale (42). The sum of these scores was an index of acute mood symptom severity. Using life chart data (43), we obtained an index of treatment resistance, which was the average number of relapses requiring inpatient admission per year over the previous five years, despite compliance with a standard treatment regime and without the emergence or exacerbation of a comorbid disorder. A standard regime was one that included therapeutic range dosing of either lithium or valproate (44).
Schizophrenic subjects (n = 15) had undifferentiated, chronic schizophrenia confirmed by WTR, based on SCID criteria. Symptom severity was assessed within 24 hours of lumbar puncture by the 30-item Positive and Negative Syndrome Scale (45) and the 18-item Scale for the Assessment of Negative Symptoms (46). The sum of scores on these scales served as an index of acute symptom severity. Treatment resistance index for schizophrenic subjects was exactly like that of BD subjects except that a standard treatment regime had to include a typical or atypical antipsychotic medication at a dose in or exceeding the recommended range. Control subjects were 15 patients whose diagnoses were: headache not otherwise specified (NOS) (n = 5); migraine headache (n = 2); complicated migraine headache (n = 2); transient ischemic attack (n = 2); Bell’s palsy (n = 1); and facial or limb paresthesia NOS (n = 3). In addition to age, inclusion criteria for control subjects were: clinical investigation for transient neurologic symptoms, including lumbar puncture and MRI, and no history of psychiatric illness other than substance abuse as determined by SCID interview. Exclusion criteria for all subjects included: diagnosis of diabetes mellitus; glucocorticoid use within six months; history of specific white matter disease; acquired immunodeficiency syndrome; ischemic heart disease; stroke; brain tumor; meningitis; head injury with loss of consciousness; neurodevelopmental disorder; hypoxia; seizures (other than electroconvulsive seizures); and cognitive disorder. Additional exclusion criteria for psychiatric subjects included: personality disorder; learning disorder; or diagnosis of any additional Axis I disorder. The subject sample of this study overlapped by 13 subjects with the sample studied in our previously reported pilot study (28). Data from five BD and eight neurologic control subjects from the pilot study were included in the present study.
CSF and blood samples
CSF was obtained from non-fasting subjects by lumbar puncture performed either for research by WTR or for clinical reasons by physicians unaffiliated with the study. Fluid was placed on ice immediately, aliquots were sent to the UMMC Clinical Laboratory for cell count and concentrations of glucose and protein, and the remainder stored at −70°C until assay. All samples were clear with normal cell counts. Donated fluid was stored two days or less at 4°C, and then retrieved for storage at −70°C until assay. Blood was obtained by venipuncture concurrently with lumbar puncture. Tubes of blood with anticoagulant were placed on ice immediately, and then centrifuged at 3,000 g and 4°C for 15 min to obtain plasma, which was stored at −70°C until assay for plasma sorbitol. Blood for serum glucose and glycosylated hemoglobin (HbA1c) was sent to the UMMC Clinical laboratory for assay.
Biochemical assays
Using a previously reported gas chromatographic-mass spectrometric (GC-MS) method (27), we measured plasma concentrations of sorbitol and CSF concentrations of sorbitol, fructose, and myo-inositol, blind to sample identity. Myo-inositol (also called ‘inositol’) was measured for comparison because it is an abundant polyol glucose metabolite that is not synthesized by the polyol pathway. We added [13C]6 sorbitol, [13C]6 fructose, and [2H]6 myo-inositol (Isotec, Inc., Miamisburg, OH, USA) as internal standards to samples, which were deproteinized, and then derivitized with a 2:1 solution of acetic anhydride and pyridine. Samples were assayed using an electron impact GC-MS system (Hewlett-Packard 5971B, Fullerton, CA, USA) with a 12 m × 0.25 mm HP-5MS column. Selected ion monitoring was performed at mass values 275 and 280, 210 and 214, and 289 and 293 for the endogenous and heavier, internal standard isotopes of fructose, myo-inositol, and sorbitol, respectively. Endogenous concentrations were calculated from the mass area ratios (corrected for natural abundance) and the known amount of internal standard added. Samples were analyzed in duplicate, and the average coefficients of variation (CV) within and between sample runs were 1.7% and 7.8%, respectively. CSF and serum glucose concentrations were determined by standard enzymatic methods using glucose oxidase, and HbA1c was measured using the VARIANT II Hemoglobin Testing System (Bio-Rad Laboratories, Inc., Hercules, CA, USA), all in the UMMC Clinical Laboratory.
MRI
Subjects were scanned by 1.5 Tesla MR scanners within seven days of lumbar puncture using fluid attenuated inversion recovery (FLAIR) pulse sequences to generate axial images. A total of 44 subjects were scanned using standard neuro-radiologic protocols in the UMMC Department of Diagnostic Radiology. Twenty-eight were scanned by a Picker Eclipse scanner (Philips Medical Systems, Inc., Cleveland, OH, USA) using the following pulse sequence parameters: repetition time (TR) = 6628 ms; time to echo (TE) = 95.9 ms; inversion time (TI) = 1800 ms; field of view (FOV) = 22.0 cm; number of excitations (NEX) = 1; slice thickness (Thick) = 5.0 mm/separated by 1.0 mm. Sixteen subjects were scanned by a Siemens Avanto scanner (Erlangen, Germany) with parameters identical to the Picker scanner except for: TR = 8000 ms; TE = 102 ms; TI = 2500 ms.
Six control subjects were scanned at outside hospitals. Five were scanned by a GE Signa Excite scanner (GE Healthcare, Piscataway, NJ, USA) with parameters: TR = 6628–9002 ms; TE = 95.9–162 ms; TI = 1800–2200 ms; FOV = 22.0 cm; NEX = 1; Thick = 5.0–7.0 mm/separated by 1.0 mm. One was scanned by a GE Signa Genesis scanner with parameters: TR = 9002 ms; TE = 124.7 ms; TI = 1800–2200 ms; FOV = 22.0 cm; NEX = 1; Thick = 5.0 mm/separated by 1.0 mm.
Image analysis
FLAIR image sets were digitally registered within a standard orthogonal coordinate system. Each FLAIR volume was aligned within a reference orthogonal coordinate space whose origin was the intersection of (i) the median plane, (ii) an axial plane at the roof of the third ventricle, and (iii) a coronal plane midway between the anterior-most and posterior-most extent of the roof of the third ventricle in the median plane. Images were then post-processed using custom-designed morphological analysis software routines written with IDL v6.3 (Research Systems, Inc., Boulder, CO, USA) by KCH. We analyzed images of the entire brain, with the exception of the brainstem and cerebellum. Parameters were taken directly from the Digital Imaging and Communications in Medicine (DICOM) header of each scan. Blind to clinical information, two individuals (TLP and WTR) defined WMHs for each axial slice by visual inspection and mouse point selection contouring. Both individuals inspected each contour, and a consensus was reached about each one. Contours were encoded with an anatomical type code (e.g., left deep WMH) and entered into a point set database that enabled automatic volume computations. Two senior board-certified neuroradiologists (also blinded) validated contoured WMHs by inspecting images to exclude contours representing normal anatomical structures (e.g., Virchow-Robin spaces, ventricular lining, and choroids plexus) (AO) or procedural artifacts (e.g., motion artifact and flow effects) (DML). Contoured WMHs were then divided into those continuous with the lateral ventricles (periventricular WMHs) and those that were not (deep WMHs) according to the method of Fazekas et al. (47). Deep, periventricular, and total WMH volumes were calculated for each subject.
Statistical analysis
Data distributions were assessed for normality by the Kolmogorov–Smirnov (K-S) test. Data with distributions significantly different (p < 0.05) from normal were transformed to ranks by the method of Conover and Iman (48) to allow parametric statistics and/or analyzed using non-parametric statistics. Demographic and clinical variables were analyzed for differences across subject groups and for relationships to CSF metabolite concentrations and WMH volumes. We used analysis of variance (ANOVA) or the Kruskal–Wallis test for numerical variables and Pearson’s chi square (χ2) for categorical variables. To minimize the chance of type I error, variables that were found to be significantly related to WMH volumes or CSF metabolite concentrations through bivariate correlations were entered as independent variables (fixed factors or covariates) into two separate multivariate analyses of covariance (MANCOVA) with CSF metabolite concentrations or WMH volumes as dependent variables. If groups differed by MANCOVA, then individual univariate analyses were performed for each WMH volume or CSF metabolite concentration. If there were no significant effects of covariates, we compared group means by ANOVA followed by Bonferroni post hoc tests. If there were significant effects of covariates, we compared group means by analysis of covariance (ANCOVA) followed by Bryant-Paulson post hoc tests on adjusted means. Where appropriate, values for degrees of freedom between groups (dfbg) and within groups (dfwg) are reported with dfbg first, followed by dfwg. Two-group comparisons were made by Student’s t-test (with Levene’s test for equality of variances) or by the Wilcoxon rank-sum test-derived Z statistic. Correlation was assessed by Pearson’s product-moment correlation coefficient (r) or by Spearman’s rank correlation coefficient (ρ) for correlations that included data that were ordinal or not normally distributed. Finally, we used partial correlation analysis to assess the independence of relationships between WMH volumes and CSF metabolite concentrations. All tests were two-tailed, with an alpha of p = 0.05, and most were performed using SPSS 12.0 (SPSS Inc., Chicago, IL, USA).
Results
Demographic and clinical variables
Groups did not differ significantly on demographic variables; however, they did on certain clinical variables (Table 1). Control subjects had a smaller proportion of smokers compared to BD and schizophrenic subjects. Groups also differed significantly by MR scanner use. To assess the effect of using different scanners, we compared, slice-by-slice, WMH volumes for three bipolar subjects scanned by the Picker Eclipse and Siemens Avanto scanners. Correlation coefficients for these data sets were r = 0.995, r = 0.906, and r = 0.915 (p < 0.001).
Table 1.
Demographic and clinical characteristics by subject group
| Variable | Subject group
|
Analysis | ||
|---|---|---|---|---|
| Bipolar disorder | Schizophrenia | Neurologic controls | ||
| n | 20 | 15 | 15 | N/A |
| Age (years) | 44.3 ± 11.8 | 41.1 ± 11.9 | 42.5 ± 9.8 | F = 0.346, df = 2, 47, p = 0.709 |
| Race | 10 C, 10 AA | 6 C, 9 AA | 9 C, 6 AA | χ2 = 1.20, df = 2, p = 0.549 |
| Gender | 11 M, 9 F | 5 M, 10 F | 5 M, 10 F | χ2 = 3.46, df = 2, p = 0.177 |
| Body mass index (BMI)(kg/m2) | 27.5 ± 5.5 | 26.9 ± 4.6 | 27.2 ± 3.6 | F = 0.076, df = 2, 47, p = 0.927 |
| History of smoking (yes:no)a | 14:6 | 11:4 | 5:10 | χ2 = 6.39, df = 2, p = 0.041 |
| History of hypertension (yes:no) | 5:15 | 3:12 | 3:12 | χ2 = 0.75, df = 2, p = 0.916 |
| Lifetime prevalence of substance abuse disorder (yes:no) | 9:11 | 8:7 | 4:11 | χ2 = 1.60, df = 2, p = 0.450 |
| Duration of psychiatric illness (years) | 18.9 ± 9.4 | 22.4 ± 9.6 | 0 | t = 1.08, df = 33, p = 0.288 |
| Acute symptom severity indexb | 21.5 ± 30.0 | 83.9 ± 18.0 | N/A | N/A |
| Treatment resistance indexc | 0.62 ± 0.38 | 0.59 ± 0.24 | N/A | t = 0.321, df = 33, p = 0.751 |
| MR scannera | 12 P, 8 S | 7 P, 8 S | 9 P, 6 GE | χ2 = 21.7, df = 4, p < 0.001 |
Values for numerical variables are means ± standard deviation or medians (interquartile range).
Groups differ significantly (p < 0.05) on this variable.
Acute symptom severity index is the sum of the scores on the 21-item Hamilton Rating Scale for Depression and the Young Mania Rating Scale for each bipolar disorder subject, and the sum of scores on the 30-item Positive and Negative Syndrome Scale and the 18-item Scale for the Assessment of Negative Symptoms for schizophrenic subjects.
Treatment resistance index is the average number of relapses requiring inpatient admission per year over the previous five years, despite compliance with a standard treatment regime and without the emergence or exacerbation of a comorbid disorder.
N/A = not applicable or not available; MR = magnetic resonance; P = Picker Eclipse scanner; S = Siemens Avanto scanner; GE = GE scanner.
All psychiatric subjects but seven (six BD and one schizophrenic) had been taking psychotropic medication within one week of lumbar puncture. Seventeen subjects took at least one antipsychotic: atypical antipsychotics (n = 14) and typical antipsychotics (n = 9). Of these, eight took olanzapine (and none clozapine), an atypical antipsychotic most often associated with glucose intolerance and new-onset diabetes mellitus (49, 50). Fifteen took at least one mood stabilizer: sodium divalproex (n = 10); lithium (n = 3); trileptal (n = 3); and lamictal (n = 1). Seven took antidepressants, either selective serotonin reuptake inhibitors or serotonin and norepinephrine reuptake inhibitors. Finally, three subjects took benzodiazepines.
Effects of demographic and clinical variables on metabolites and WMH volumes
We compared psychiatric subjects taking olanzapine to those who were not and found no significant differences (p ≥ 0.533) between groups on any variable. We similarly assessed the influence of taking either lithium or sodium divalproex, two putative neuroprotective medications (51), and found no significant differences between groups (p ≥ 0.102). We analyzed the 50-subject database to assess potentially confounding effects of age, gender, race, body mass index (BMI), smoking, substance abuse, hypertension, and MR scanner on CSF metabolite concentrations and WMH volumes. MANCOVA found no significant relationships of these variables to CSF metabolite concentrations, but did find significant relationships between age and deep (F = 31.1, df = 1, 43, p < 0.001), periventricular (F = 7.98, df = 1, 43, p = 0.007), and total (F = 35.3, df = 1, 43, p < 0.001) WMH volumes. MANCOVA also found significant relationships between subject group and CSF concentrations of sorbitol (F = 3.25, df = 2, 43, p = 0.05) and fructose (F = 6.21, df = 2, 43, p = 0.005), as well as deep WMH volume (F = 3.86, df = 2, 43, p = 0.029).
Group differences on metabolites and WMH volumes
The MANCOVA results for CSF concentrations of glucose, myo-inositol, periventricular WMH volume, and total WMH volume are shown in Table 2, along with the ANCOVA or ANOVA results for sorbitol, fructose, and deep WMH volume. Of note, groups differed significantly on CSF concentrations of both polyol pathway metabolites but not on myo-inositol or glucose. CSF sorbitol of BD patients significantly exceeded that of controls, and BD patient CSF fructose exceeded that of controls and schizophrenic patients. BD patients also had significantly higher serum glucose concentrations compared to controls. Groups differed significantly on volumes of deep and total, but not periventricular, WMHs. However, after rank transformation and adjustment for age, groups differed significantly only on deep WMH volume, with BD deep WMH volume significantly exceeding that of control, but not schizophrenic groups.
Table 2.
Metabolic and white matter hyperintensity (WMH) parameters by subject group
| Variable | Subject group
|
Analysis | ||
|---|---|---|---|---|
| Bipolar disorder (BD) | Schizophrenia (SCHZ) | Neurologic controls (NC) | ||
| n | 20 | 15 | 15 | N/A |
| CSF sorbitol (μM)a | 24.7 ± 7.4 | 20.6 ± 8.0 | 17.8 ± 4.0 |
F = 4.51, df = 2, 47, p = 0.016c BD > NC, p = 0.015 |
| CSF fructose (μM)a | 263 ± 96 | 192 ± 75 | 146 ± 46 |
F = 10.1, df = 2, 47, p < 0.001c BD > NC, p < 0.001 BD > SCHZ, p = 0.032 |
| CSF myo-inositol (μM) | 182 ± 68 | 192 ± 59 | 177 ± 64 | F = 2.12, df = 2, 43, p = 0.133d |
| CSF glucose (mg/dL) | 67.4 ± 10.9 | 59.9 ± 9.6 | 63.3 ± 8.0 | F = 1.12, df = 2, 43, p = 0.336d |
| Serum glucose (mg/dL)a | 106.5 ± 14.8 | 95.6 ± 23.8 | 90.7 ± 17.2 |
F = 3.37, df = 2, 47, p = 0.043c BD > NC, p = 0.049 |
| HbA1c (%)b | 5.43 ± 0.57 | 5.30 ± 0.48 | N/A | t = 0.604, df = 23, p = 0.551 |
| Plasma sorbitol (μM) | 1.00 (0.65) | 0.80 (1.15) | N/A | Z = 0.254, p = 0.799 |
| Deep WMH volume (cm3) | 0.168 (0.568) | 0.022 (0.114) | 0.000 (0.057) | χ2 = 9.34, df = 2, p = 0.009e |
| Deep WMH volume (rank-transformed)a | 31.9 ± 14.8 | 25.2 ± 13.5 | 17.3 ± 18.6 |
F = 8.50, df = 2, 46, p = 0.001f BD > NC, p < 0.01 |
| Periventricular WMH volume (cm3) | 0.00 (0.266) | 0.00 (0.228) | 0.00 (0.000) | χ2 = 3.56, df = 2 p = 0.169e |
| Periventricular WMH volume (rank-transformed) | 27.7 ± 14.4 | 27.7 ± 12.7 | 20.4 ± 8.1 | F = 1.98, df = 2, 43, p = 0.151d |
| Total WMH volume (cm3)a | 0.279 (0.821) | 0.111 (0.432) | 0.000 (0.067) | χ2 = 7.60, df = 2, p = 0.022e |
| Total WMH volume (rank-transformed) | 30.8 ± 15.4 | 26.4 ± 14.0 | 17.5 ± 18.6 | F = 2.83, df = 2, 43, p = 0.070d |
Values are unadjusted means ± standard deviation or medians (interquartile range).
Groups differ significantly (p < 0.05) on this variable.
n = 11 for BD subjects, and n = 14 for SCHZ subjects.
ANOVA.
MANCOVA.
Kruskal-Wallis test.
ANCOVA on age-adjusted means.
CSF = cerebrospinal fluid; N/A = not applicable or not available.
Correlations among clinical, metabolic, and WMH variables
We determined correlations between CSF metabolites and WMH volumes for each subject group. Significant positive correlations between CSF metabolites and WMH volumes were found only in the BD group and were between deep WMH volumes and CSF sorbitol (ρ = 0.487, p = 0.029) and fructose (ρ = 0.474, p = 0.035) concentrations. Scatter plots of CSF polyol pathway metabolite concentration data and rank transformed deep WMH volume data are shown in Fig. 1. We next assessed correlations among CSF metabolites, WMH volumes, and indices of treatment resistance and acute illness severity in BD and schizophrenic subjects. In the BD group, treatment resistance index correlated significantly with deep WMH volume (ρ = 0.578, p = 0.008), sorbitol (ρ = 0.542, p = 0.013), and fructose (ρ = 0.692, p = 0.001). The relationship between CSF polyol pathway metabolites and treatment resistance score is illustrated by Fig. 2. Fig. 3 depicts the relationship between rank transformed deep WMH volume and treatment resistance. There were no significant correlations with treatment resistance index in the schizophrenic group. In the BD group, acute symptom severity index correlated significantly with deep (ρ = 0.691, p = 0.001), periventricular (ρ = 0.547, p = 0.013), and total (ρ = 0.678, p = 0.001) WMH volumes, as well as with CSF sorbitol (ρ = 0.530, p = 0.016) and fructose (ρ = 0.455, p = 0.016). In the schizophrenic group, acute symptom severity index correlated significantly with CSF fructose (ρ = 0.651, p = 0.009). In the BD group, but not in the schizophrenic group, treatment resistance index correlated significantly (ρ = 0.640, p = 0.002) with acute symptom severity index.
Fig. 1.
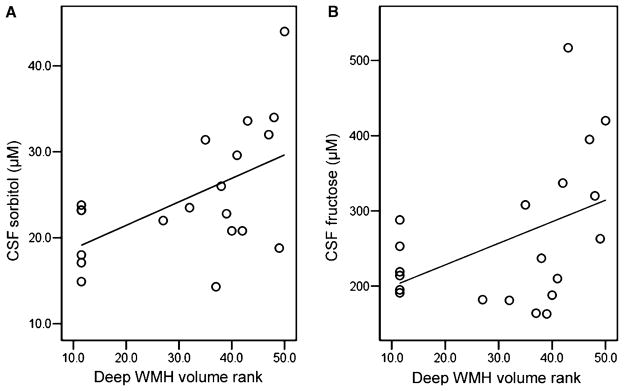
Scatter plots of the relationships between (A) cerebrospinal fluid (CSF) sorbitol and (B) CSF fructose concentrations and rank-transformed deep white matter hyperintensity (WMH) volumes in bipolar disorder patients; n = 20. Higher rank means greater deep WMH volume (50 = highest). R2 = 0.293 for CSF sorbitol and 0.195 for CSF fructose.
Fig. 2.
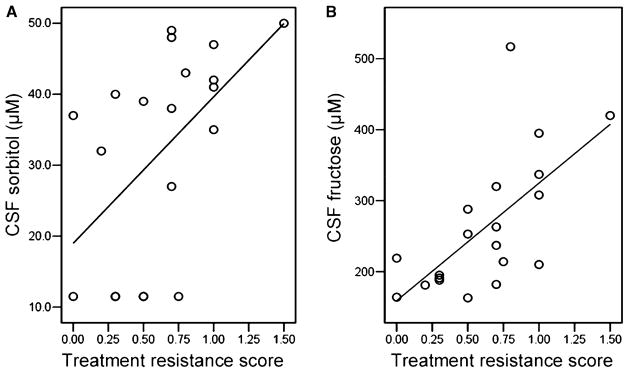
Scatter plots of the relationships between (A) cerebrospinal fluid (CSF) sorbitol and (B) CSF fructose concentrations and treatment resistance score in bipolar disorder patients; n = 20. Treatment resistance is defined as the number of hospitalizations for bipolar disorder per year over the past five years. R2 = 0.488 for CSF sorbitol and 0.428 for CSF fructose.
Fig. 3.
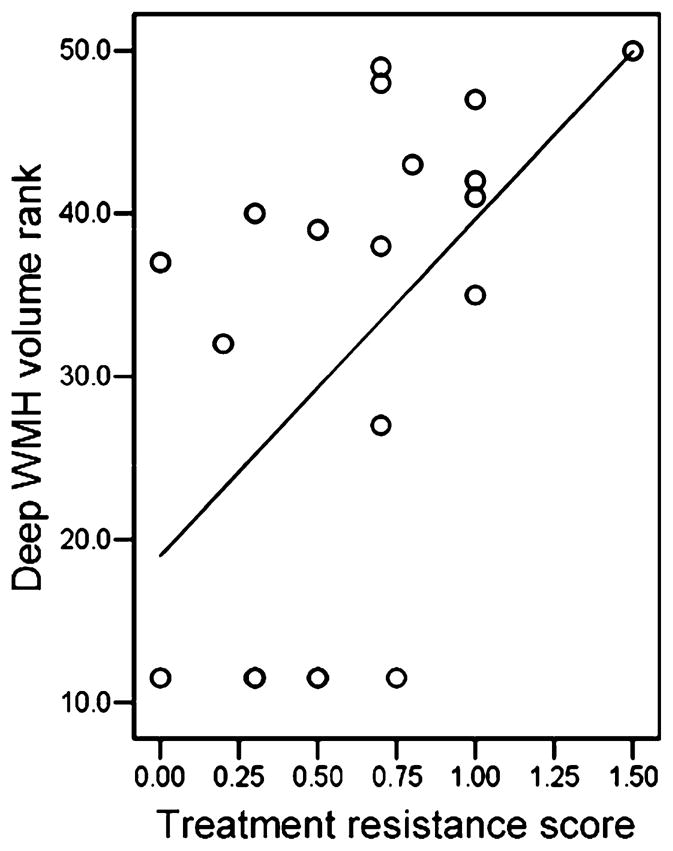
Scatter plot of the relationship between rank-transformed deep white matter hyperintensity (WMH) volume and treatment resistance score; n = 20. Higher rank means greater deep WMH volume (50 = highest). Treatment resistance is defined as the number of hospitalizations for bipolar disorder per year over the past five years. R2 = 0.281.
Finally, we performed further correlations to assess the relationships of other metabolic variables, including plasma sorbitol, serum and CSF glucose, HbA1c, and BMI, to CSF sorbitol and fructose concentrations in BD subjects. We found significant correlations of CSF sorbitol with (i) CSF glucose (ρ = 0.670, p = 0.001), (ii) CSF fructose (ρ = 0.653, p = 0.003), (iii) serum glucose (ρ = 0.460, p = 0.041), and (iv) HbA1c (ρ = 0.650, p = 0.030, n = 11). CSF fructose correlated significantly with CSF glucose (ρ = 0.470, p = 0.037).
Discussion
Similar to other studies (1, 2), we found an association between deep WMHs and treatment resistance in BD patients. The moderate positive correlations of both deep WMH volume and treatment resistance score with CSF concentrations of sorbitol and fructose in BD subjects suggest a relationship between brain polyol pathway activity, white matter disease, and treatment resistance in BD. This finding is consistent with our previous results in treatment-resistant affective disorder subjects (28). Correlation between CSF polyol pathway metabolites and deep WMH volume is intriguing, but does not establish a causal relationship. There are at least four explanations for the correlation.
First, increased brain polyol pathway activity resulting from hyperglycemia could, as hypothesized, contribute directly to demyelinating lesions in white matter as it does in diabetic peripheral nerve. Although none of our subjects was diabetic, the mean (non-fasting) serum glucose of BD subjects was significantly greater than that of controls, and the mean HbA1c for BD subjects was on the high end of the clinically normal range of 4–6%. Furthermore, CSF sorbitol concentration correlated significantly with both serum glucose and HbA1c, suggesting a relationship between increased brain polyol pathway activity and hyperglycemia. CSF sorbitol also correlated strongly with CSF glucose; however, BD patients did not have significantly greater CSF glucose concentration relative to controls. One reason for this is the slow rate of sorbitol clearance from CSF. CSF, but not plasma, sorbitol was significantly elevated in BD subjects. As suggested by a CSF/serum concentration ratio of approximately 0.7, glucose is readily cleared from the CSF, while sorbitol, with a ratio of approximately 15, accumulates in the CSF during hyperglycemia. Fructose also accumulates in CSF for the same reason; however, its CSF concentration is far greater than that of sorbitol because it is less polar and is therefore not retained intracellularly. A further reason is that the polyol pathway could be upregulated by enzyme activation under the pathological conditions discussed below.
Whether increased polyol pathway activity and the resulting intracellular accumulation of sorbitol actually contribute to brain white matter disease in BD patients is unclear. Hyperglycemia has been reported to increase regional brain glucose metabolism far more in the centrum semiovale than in cortical regions or subcortical nuclei (52), possibly resulting in a greater accumulation of polyol pathway metabolites in white matter. BD CSF sorbitol was, however, only 1.4 times greater than controls. CSF polyol concentrations in patients with leukoencephalopathies related to polyol metabolism are more than 100 times that of healthy controls (36), albeit their WMHs are more extensive. A prospective trial of an aldose reductase inhibitor would be necessary to determine whether this modest elevation of CSF sorbitol signifies sufficient brain polyol pathway activity to cause disease detectable by WMHs. Presently, there is no aldose reductase inhibitor approved by the U.S. Food and Drug Administration, although they are available in Europe and Japan for treating diabetic neuropathy.
The second explanation is that increased brain polyol pathway activity could be a consequence rather than a cause of the lesions represented by deep WMHs. Postmortem studies have found that deep WMHs have an ischemic etiology both in the general elderly population (47) and in patients with late-life depression (53). Aldose reductase, the initial, rate limiting enzyme of the polyol pathway, is activated by tissue ischemia (54). Therefore, increased CSF sorbitol could derive from increased polyol pathway activity in ischemic deep WMH regions.
Third, increased polyol pathway activity could be both a consequence and a cause of white matter lesions manifested by deep WMHs. Activation of aldose reductase in ischemic myocardium exacerbates tissue ischemia (54). Inhibition of aldose reductase reduces ischemia-reperfusion injury by preserving adenosine triphosphate generation by glycolysis and by attenuating oxidative stress (55). Recently, Lo et al. (56) reported that deletion of the aldose reductase gene protects against cerebral ischemic injury in transgenic mice by decreasing oxidative stress.
Finally, CSF sorbitol and deep WMHs might be linked by a third factor causing both. We suggest that mitochondrial dysfunction, which has been implicated in BD pathophysiology (57–59), could be this third factor. Mitochondrial dysfunction, resulting in a shift from oxidative to less efficient anaerobic glucose metabolism, is associated with an upregulation of both the glycolytic (Embden-Meyerhoff pathway) (60) and the polyol pathways (61). Task-dependent brain activation results in a brain energy deficit in individuals with mitochondrial disorders (62), which might particularly affect deep white matter because of its limited perfusion (63). Individuals with mitochondrial disorders evidence both WMHs (64–67) and neuropsychiatric syndromes, including psychosis, depression, and mania (68–71). Interestingly, Munakata et al. (68) have reported that a mitochondrial DNA point mutation (3243A>G) associated with the MELAS (mitochondrial myopathy, encephalopathy, lactic acidosis, and strokes) syndrome may have a pathophysiologic role in BD and schizophrenia.
The relationship of our findings to those of our previous postmortem studies should be noted. Finding significantly increased CSF sorbitol and fructose only in the BD group contrasts with our previous report of increased sorbitol in postmortem brain of individuals with BD, schizophrenia, and unipolar depression (72). This might be explained by agonal changes in glucose metabolism. Agonal hypoxia is associated with changes in mitochondrial-related gene expression, increased anaerobic glycolysis, and decreased brain pH (73, 74). We found a significant inverse correlation between tissue sorbitol and pH in our postmortem samples (72), suggesting that agonal hypoxia could, like ischemia, increase polyol pathway activity. Agony might therefore cause significantly increased brain polyol pathway activity in individuals whose tendency toward polyol pathway activity under other physiologic conditions was significantly less than that of BD patients.
In terms of limitations, our study sample was small, and thus our conclusions are more tentative. There were also several potential confounds. Our controls were not healthy subjects. However, recruitment of a control group of individuals with headaches and transient ischemic attacks who would be expected to have WMHs (75, 76) was intentional and necessary. Otherwise, we could not have determined the group specificity of correlations between metabolites and WMHs. In terms of central nervous system polyol pathway metabolism, our neurologic control mean CSF sorbitol was comparable to, although slightly higher than, values for adult healthy control means of 13.8, and 14.6 μM previously reported by other investigators using the same technique (77, 78).
Although we used statistics to assess and control for the effects of demographic and clinical variables in our group comparisons, we cannot completely exclude confounds including the heterogeneous mood and medication states of the participants. It is noteworthy, however, that the use of multiple MR scanners did not appear to affect group comparisons on WMH volumes. This is not surprising given the largely consistent finding of increased WMHs in BD subjects throughout numerous studies using disparate scanners and protocols (3, 4).
This study was cross-sectional; therefore, we cannot say for certain whether metabolic differences between groups are trait and/or state-related phenomena. Though WMHs are stable over one year in BD patients (9), metabolic changes could be transient. CSF polyol pathway metabolites and deep WMH volume correlated positively with both acute symptom severity index and treatment resistance index (derived from the previous five years of clinical history) in BD subjects. These correlations imply relationships to illness state as well as to the more trait-like phenomenon of treatment resistance. They suggest further that the most treatment-resistant bipolar patients are also those with the most severe symptoms of acute illness. This is consistent with our finding a moderate positive correlation between our indices of treatment resistance and acute symptom severity in BD subjects.
In summary, we report the first evidence of relationships between abnormal brain glucose metabolism and both deep WMHs and treatment resistance in a group of BD patients. While these novel findings could lead to new insights into disease mechanisms, they are correlational, and only further investigation, including novel therapeutic interventions, can determine their significance to BD pathophysiology.
Acknowledgments
The authors thank the individuals who volunteered for this study for their invaluable contribution; Drs. Mahindranauth Deonarine, Padmaja Kodali, Amelia McPeak, Angela Onwuanibe, and Martin Weiler for referring their patients to the study; Dr. Stephen Reich, Dr. Michael Marmura, Jardiolyn Valino-Patterson, R.N., and the residents and staff of the University of Maryland Neurology Clinic for enabling us to recruit neurologic control subjects; Ms. Lisa McFarland for her technical assistance with the GC-MS; and Andrew P. Goldberg, M.D., and the Baltimore VAMC GRECC for extended loan of the GC-MS system. This research was funded by an NIMH R21 award (MH066028-01A2) to WTR.
Footnotes
The authors of this paper do not have any financial interests or conflicts to disclose in connection with this manuscript.
References
- 1.Moore PB, El-Badri SM, Cousins D, et al. White matter lesions and season of birth of patients with bipolar affective disorder. Am J Psychiatry. 2001;158:1521–1524. doi: 10.1176/appi.ajp.158.9.1521. [DOI] [PubMed] [Google Scholar]
- 2.Moore PB, Shepherd DJ, Eccleston D, et al. Cerebral white matter lesions in bipolar affective disorder: relationship to outcome. Br J Psychiatry. 2001;178:172–176. doi: 10.1192/bjp.178.2.172. [DOI] [PubMed] [Google Scholar]
- 3.Soares JC, Mann JJ. The anatomy of mood disorders –review of structural neuroimaging studies. Biol Psychiatry. 1997;41:86–106. doi: 10.1016/s0006-3223(96)00006-6. [DOI] [PubMed] [Google Scholar]
- 4.Altshuler LL, Curran JG, Hauser P, Mintz J, Denicoff K, Post R. T2 hyperintensities in bipolar disorder: magnetic resonance imaging comparison and literature meta-analysis. Am J Psychiatry. 1995;152:1139–1144. doi: 10.1176/ajp.152.8.1139. [DOI] [PubMed] [Google Scholar]
- 5.Aylward EH, Roberts-Twillie JV, Barta PE, et al. Basal ganglia volumes and white matter hyperintensities in patients with bipolar disorder. Am J Psychiatry. 1994;151:687–693. doi: 10.1176/ajp.151.5.687. [DOI] [PubMed] [Google Scholar]
- 6.Strakowski SM, Woods BT, Tohen M, Wilson DR, Douglass AW, Stoll AL. MRI subcortical signal hyperintensities in mania at first hospitalization. Biol Psychiatry. 1993;33:204–206. doi: 10.1016/0006-3223(93)90140-9. [DOI] [PubMed] [Google Scholar]
- 7.Woods BT, Yurgelun-Todd D, Mikulis D, Pillay SS. Age-related MRI abnormalities in bipolar illness: a clinical study. Biol Psychiatry. 1995;38:846–847. doi: 10.1016/0006-3223(95)00363-0. [DOI] [PubMed] [Google Scholar]
- 8.Dupont RM, Butters N, Schafer K, Wilson T, Hesselink J, Gillin JC. Diagnostic specificity of focal white matter abnormalities in bipolar and unipolar mood disorder. Biol Psychiatry. 1995;38:482–486. doi: 10.1016/0006-3223(95)00100-u. [DOI] [PubMed] [Google Scholar]
- 9.Dupont RM, Jernigan TL, Butters N, et al. Subcortical abnormalities detected in bipolar affective disorder using magnetic resonance imaging. Clinical and neuropsychological significance. Arch Gen Psychiatry. 1990;47:55–59. doi: 10.1001/archpsyc.1990.01810130057008. [DOI] [PubMed] [Google Scholar]
- 10.Dupont RM, Jernigan TL, Heindel W, et al. Magnetic resonance imaging and mood disorders. Localization of white matter and other subcortical abnormalities. Arch Gen Psychiatry. 1995;52:747–755. doi: 10.1001/archpsyc.1995.03950210041009. [DOI] [PubMed] [Google Scholar]
- 11.Figiel GS, Krishnan KR, Rao VP, et al. Subcortical hyperintensities on brain magnetic resonance imaging: a comparison of normal and bipolar subjects. J Neuropsychiatry Clin Neurosci. 1991;3:18–22. doi: 10.1176/jnp.3.1.18. [DOI] [PubMed] [Google Scholar]
- 12.Dupont RM, Jernigan TL, Gillin JC, Butters N, Delis DC, Hesselink JR. Subcortical signal hyperintensities in bipolar patients detected by MRI. Psychiatry Res. 1987;21:357–358. doi: 10.1016/0165-1781(87)90020-5. [DOI] [PubMed] [Google Scholar]
- 13.Krabbendam L, Honig A, Wiersma J, et al. Cognitive dysfunctions and white matter lesions in patients with bipolar disorder in remission. Acta Psychiatr Scand. 2000;101:274–280. [PubMed] [Google Scholar]
- 14.Hickie I, Scott E, Mitchell P, Wilhelm K, Austin MP, Bennett B. Subcortical hyperintensities on magnetic resonance imaging: clinical correlates and prognostic significance in patients with severe depression. Biol Psychiatry. 1995;37:151–160. doi: 10.1016/0006-3223(94)00174-2. [DOI] [PubMed] [Google Scholar]
- 15.Pompili M, Ehrlich S, De Pisa E, et al. White matter hyperintensities and their associations with suicidality in patients with major affective disorders. Eur Arch Psychiatry Clin Neurosci. 2007;257:494–499. doi: 10.1007/s00406-007-0755-x. [DOI] [PubMed] [Google Scholar]
- 16.Filley CM. Neurobehavioral aspects of cerebral white matter disorders. In: Fogel BS, Schiffer RB, Rao SM, editors. Neuropsychiatry. Baltimore: Williams & Wilkins; 1996. pp. 913–933. [Google Scholar]
- 17.Fazekas F, Niederkorn K, Schmidt R, et al. White matter signal abnormalities in normal individuals: correlation with carotid ultrasonography, cerebral blood flow measurements, and cerebrovascular risk factors. Stroke. 1988;19:1285–1288. doi: 10.1161/01.str.19.10.1285. [DOI] [PubMed] [Google Scholar]
- 18.Schmidt R, Fazekas F, Kleinert G, et al. Magnetic resonance imaging signal hyperintensities in the deep and subcortical white matter. A comparative study between stroke patients and normal volunteers. Arch Neurol. 1992;49:825–827. doi: 10.1001/archneur.1992.00530320049011. [DOI] [PubMed] [Google Scholar]
- 19.Alexopoulos GS, Meyers BS, Young RC, Campbell S, Silbersweig D, Charlson M. ‘Vascular depression’ hypothesis. Arch Gen Psychiatry. 1997;54:915–922. doi: 10.1001/archpsyc.1997.01830220033006. [DOI] [PubMed] [Google Scholar]
- 20.Ahearn EP, Speer MC, Chen YT, et al. Investigation of Notch3 as a candidate gene for bipolar disorder using brain hyperintensities as an endophenotype. Am J Med Genet. 2002;114:652–658. doi: 10.1002/ajmg.10512. [DOI] [PubMed] [Google Scholar]
- 21.Lenze E, Cross D, McKeel D, Neuman RJ, Sheline YI. White matter hyperintensities and gray matter lesions in physically healthy depressed subjects. Am J Psychiatry. 1999;156:1602–1607. doi: 10.1176/ajp.156.10.1602. [DOI] [PubMed] [Google Scholar]
- 22.Thomas AJ, Davis S, Ferrier IN, Kalaria RN, O’Brien JT. Elevation of cell adhesion molecule immunoreactivity in the anterior cingulate cortex in bipolar disorder. Biol Psychiatry. 2004;55:652–655. doi: 10.1016/j.biopsych.2003.10.015. [DOI] [PubMed] [Google Scholar]
- 23.van der Velde CD, Gordon MW. Manic-depressive illness, diabetes mellitus, and lithium carbonate. Arch Gen Psychiatry. 1969;21:478–485. doi: 10.1001/archpsyc.1969.01740220094011. [DOI] [PubMed] [Google Scholar]
- 24.Lilliker SL. Prevalence of diabetes in a manic-depressive population. Compr Psychiatry. 1980;21:270–275. doi: 10.1016/0010-440x(80)90030-9. [DOI] [PubMed] [Google Scholar]
- 25.Cassidy F, Ahearn E, Carroll BJ. Elevated frequency of diabetes mellitus in hospitalized manic-depressive patients. Am J Psychiatry. 1999;156:1417–1420. doi: 10.1176/ajp.156.9.1417. [DOI] [PubMed] [Google Scholar]
- 26.Regenold WT, Thapar RK, Marano C, Gavirneni S, Kondapavuluru PV. Increased prevalence of type 2 diabetes mellitus among psychiatric inpatients with bipolar I affective and schizoaffective disorders independent of psychotropic drug use. J Affect Disord. 2002;70:19–26. doi: 10.1016/s0165-0327(01)00456-6. [DOI] [PubMed] [Google Scholar]
- 27.Regenold WT, Kling MA, Hauser P. Elevated sorbitol concentration in the cerebrospinal fluid of patients with mood disorders. Psychoneuroendocrinology. 2000;25:593–606. doi: 10.1016/s0306-4530(00)00012-3. [DOI] [PubMed] [Google Scholar]
- 28.Regenold WT, Hisley KC, Obuchowski A, Lefkowitz DM, Marano C, Hauser P. Relationship of white matter hyperintensities to cerebrospinal fluid glucose polyol pathway metabolites – a pilot study in treatment-resistant affective disorder patients. J Affect Disorders. 2005;85:341–350. doi: 10.1016/j.jad.2004.10.010. [DOI] [PubMed] [Google Scholar]
- 29.Gabbay KH. The sorbitol pathway and the complications of diabetes. N Engl J Med. 1973;288:831–836. doi: 10.1056/NEJM197304192881609. [DOI] [PubMed] [Google Scholar]
- 30.Stevens MJ, Feldman EL, Greene DA. The aetiology of diabetic neuropathy: the combined roles of metabolic and vascular defects. Diabet Med. 1995;12:566–579. doi: 10.1111/j.1464-5491.1995.tb00544.x. [DOI] [PubMed] [Google Scholar]
- 31.Servo C, Pitkanen E. Variation in polyol levels in cerebrospinal fluid and serum in diabetic patients. Diabetologia. 1975;11:575–580. doi: 10.1007/BF01222109. [DOI] [PubMed] [Google Scholar]
- 32.Sredy J, Sawicki DR, Notvest RR. Polyol pathway activity in nervous tissues of diabetic and galactose-fed rats: effect of dietary galactose withdrawal or tolrestat intervention therapy. J Diabet Complications. 1991;5:42–47. doi: 10.1016/0891-6632(91)90010-m. [DOI] [PubMed] [Google Scholar]
- 33.Notvest RR, Inserra JJ. Tolrestat, an aldose reductase inhibitor, prevents nerve dysfunction in conscious diabetic rats. Diabetes. 1987;36:500–504. doi: 10.2337/diab.36.4.500. [DOI] [PubMed] [Google Scholar]
- 34.Berry GT, Hunter JV, Wang Z, et al. In vivo evidence of brain galactitol accumulation in an infant with galactosemia and encephalopathy. J Pediatr. 2001;138:260–262. doi: 10.1067/mpd.2001.110423. [DOI] [PubMed] [Google Scholar]
- 35.Otaduy MC, Leite CC, Lacerda MT, et al. Proton MR spectroscopy and imaging of a galactosemic patient before and after dietary treatment. AJNR Am J Neuroradiol. 2006;27:204–207. [PMC free article] [PubMed] [Google Scholar]
- 36.van der Knaap MS, Wevers RA, Struys EA, et al. Leukoencephalopathy associated with a disturbance in the metabolism of polyols. Ann Neurol. 1999;46:925–928. doi: 10.1002/1531-8249(199912)46:6<925::aid-ana18>3.0.co;2-j. [DOI] [PubMed] [Google Scholar]
- 37.Prockop LD. Hyperglycemia, polyol accumulation, and increased intracranial pressure. Arch Neurol. 1971;25:126–140. doi: 10.1001/archneur.1971.00490020044005. [DOI] [PubMed] [Google Scholar]
- 38.Shetty HU, Holloway HW, Schapiro MB. Cerebrospinal fluid and plasma distribution of myo-inositol and other polyols in Alzheimer disease. Clin Chem. 1996;42:298–302. [PubMed] [Google Scholar]
- 39.Lewis DA, Kathol RG, Sherman BM, Winokur G, Schlesser MA. Differentiation of depressive subtypes by insulin insensitivity in the recovered phase. Arch Gen Psychiatry. 1983;40:167–170. doi: 10.1001/archpsyc.1983.01790020061005. [DOI] [PubMed] [Google Scholar]
- 40.First MB, Spitzer RL, Gibbon M, Williams JBW. Structured Clinical Interview for DSM-IV Axis I Disorders-Non-Patient Edition (SCID-I/NP, Version 2.0) New York: Biometrics Research Department New York State Psychiatric Institute; 1998. [Google Scholar]
- 41.Hamilton M. A rating scale for depression. J Neurol Neurosurg Psychiatry. 1960;23:56–62. doi: 10.1136/jnnp.23.1.56. [DOI] [PMC free article] [PubMed] [Google Scholar]
- 42.Young RC, Biggs JT, Ziegler VE, Meyer DA. A rating scale for mania: reliability, validity and sensitivity. Br J Psychiatry. 1978;133:429–435. doi: 10.1192/bjp.133.5.429. [DOI] [PubMed] [Google Scholar]
- 43.Leverich GS, Post RM. The NIMH Life Chart Manual for Recurrent Affective Illness: Clinician Retrospective (LCM-C/R) Bethesda, MD: NIMH; 2002. [Google Scholar]
- 44.Sachs GS, Printz DJ, Kahn DA, Carpenter D, Docherty JP. The expert consensus guideline series: medication treatment of bipolar disorder 2000. Postgrad Med. 2000;107(Spec No):1–104. [PubMed] [Google Scholar]
- 45.Kay SR, Fiszbein A, Opler LA. The positive and negative syndrome scale (PANSS) for schizophrenia. Schizophr Bull. 1987;13:261–276. doi: 10.1093/schbul/13.2.261. [DOI] [PubMed] [Google Scholar]
- 46.Andreasen NC. Negative symptoms in schizophrenia. Definition and reliability. Arch Gen Psychiatry. 1982;39:784–788. doi: 10.1001/archpsyc.1982.04290070020005. [DOI] [PubMed] [Google Scholar]
- 47.Fazekas F, Kleinert R, Offenbacher H, et al. Pathologic correlates of incidental MRI white matter signal hyperintensities. Neurology. 1993;43:1683–1689. doi: 10.1212/wnl.43.9.1683. [DOI] [PubMed] [Google Scholar]
- 48.Conover WJ, Iman RL. Analysis of covariance using the rank transformation. Biometrics. 1982;38:715–724. [PubMed] [Google Scholar]
- 49.Lambert BL, Chou CH, Chang KY, Tafesse E, Carson W. Antipsychotic exposure and type 2 diabetes among patients with schizophrenia: a matched case-control study of California Medicaid claims. Pharmacoepidemiol Drug Saf. 2005;14:417–425. doi: 10.1002/pds.1092. [DOI] [PubMed] [Google Scholar]
- 50.Leslie DL, Rosenheck RA. Incidence of newly diagnosed diabetes attributable to atypical antipsychotic medications. Am J Psychiatry. 2004;161:1709–1711. doi: 10.1176/appi.ajp.161.9.1709. [DOI] [PubMed] [Google Scholar]
- 51.Chen G, Zeng WZ, Yuan PX, et al. The mood-stabilizing agents lithium and valproate robustly increase the levels of the neuroprotective protein bcl-2 in the CNS. J Neurochem. 1999;72:879–882. doi: 10.1046/j.1471-4159.1999.720879.x. [DOI] [PubMed] [Google Scholar]
- 52.Hasselbalch SG, Knudsen GM, Capaldo B, Postiglione A, Paulson OB. Blood-brain barrier transport and brain metabolism of glucose during acute hyperglycemia in humans. J Clin Endocrinol Metab. 2001;86:1986–1990. doi: 10.1210/jcem.86.5.7490. [DOI] [PubMed] [Google Scholar]
- 53.Thomas AJ, O’Brien JT, Davis S, et al. Ischemic basis for deep white matter hyperintensities in major depression: a neuropathological study. Arch Gen Psychiatry. 2002;59:785–792. doi: 10.1001/archpsyc.59.9.785. [DOI] [PubMed] [Google Scholar]
- 54.Hwang YC, Sato S, Tsai JY, et al. Aldose reductase activation is a key component of myocardial response to ischemia. FASEB J. 2002;16:243–245. doi: 10.1096/fj.01-0368fje. [DOI] [PubMed] [Google Scholar]
- 55.Iwata K, Matsuno K, Nishinaka T, Persson C, Yabe-Nishimura C. Aldose reductase inhibitors improve myo-cardial reperfusion injury in mice by a dual mechanism. J Pharmacol Sci. 2006;102:37–46. doi: 10.1254/jphs.fp0060218. [DOI] [PubMed] [Google Scholar]
- 56.Lo AC, Cheung AK, Hung VK, et al. Deletion of aldose reductase leads to protection against cerebral ischemic injury. J Cereb Blood Flow Metab. 2007;27:1496–1509. doi: 10.1038/sj.jcbfm.9600452. [DOI] [PubMed] [Google Scholar]
- 57.Kato T. Mitochondrial dysfunction in bipolar disorder: from 31P-magnetic resonance spectroscopic findings to their molecular mechanisms. Int Rev Neurobiol. 2005;63:21–40. doi: 10.1016/S0074-7742(05)63002-4. [DOI] [PubMed] [Google Scholar]
- 58.Konradi C, Eaton M, MacDonald ML, Walsh J, Benes FM, Heckers S. Molecular evidence for mitochondrial dysfunction in bipolar disorder. Arch Gen Psychiatry. 2004;61:300–308. doi: 10.1001/archpsyc.61.3.300. [DOI] [PubMed] [Google Scholar]
- 59.Stork C, Renshaw PF. Mitochondrial dysfunction in bipolar disorder: evidence from magnetic resonance spectroscopy research. Mol Psychiatry. 2005;10:900–919. doi: 10.1038/sj.mp.4001711. [DOI] [PubMed] [Google Scholar]
- 60.von Kleist-Retzow JC, Hornig-Do HT, Schauen M, et al. Impaired mitochondrial Ca2+ homeostasis in respiratory chain-deficient cells but efficient compensation of energetic disadvantage by enhanced anaerobic glycolysis due to low ATP steady state levels. Exp Cell Res. 2007;313:3076–3089. doi: 10.1016/j.yexcr.2007.04.015. [DOI] [PubMed] [Google Scholar]
- 61.Danielson SR, Carelli V, Tan G, et al. Isolation of transcriptomal changes attributable to LHON mutations and the cybridization process. Brain. 2005;128:1026–1037. doi: 10.1093/brain/awh447. [DOI] [PubMed] [Google Scholar]
- 62.Rango M, Bozzali M, Prelle A, Scarlato G, Bresolin N. Brain activation in normal subjects and in patients affected by mitochondrial disease without clinical central nervous system involvement: a phosphorus magnetic resonance spectroscopy study. J Cereb Blood Flow Metab. 2001;21:85–91. doi: 10.1097/00004647-200101000-00011. [DOI] [PubMed] [Google Scholar]
- 63.Nonaka H, Akima M, Hatori T, Nagayama T, Zhang Z, Ihara F. The microvasculature of the cerebral white matter: arteries of the subcortical white matter. J Neuropathol Exp Neurol. 2003;62:154–161. doi: 10.1093/jnen/62.2.154. [DOI] [PubMed] [Google Scholar]
- 64.Castillo M, Kwock L, Green C. MELAS syndrome: imaging and proton MR spectroscopic findings. AJNR Am J Neuroradiol. 1995;16:233–239. [PMC free article] [PubMed] [Google Scholar]
- 65.de Lonlay-Debeney P, von Kleist-Retzow JC, Hertz-Pannier L, et al. Cerebral white matter disease in children may be caused by mitochondrial respiratory chain deficiency. J Pediatr. 2000;136:209–214. doi: 10.1016/s0022-3476(00)70103-x. [DOI] [PubMed] [Google Scholar]
- 66.Yamamoto M, Ujike H, Wada K, Tsuji T. Cerebrospinal fluid lactate and pyruvate concentrations in patients with Parkinson’s disease and mitochondrial encephalomyopathy, lactic acidosis, and stroke-like episodes (MELAS) J Neurol Neurosurg Psychiatry. 1997;62:290. doi: 10.1136/jnnp.62.3.290. [DOI] [PMC free article] [PubMed] [Google Scholar]
- 67.Valanne L, Ketonen L, Majander A, Suomalainen A, Pihko H. Neuroradiologic findings in children with mitochondrial disorders. AJNR Am J Neuroradiol. 1998;19:369–377. [PMC free article] [PubMed] [Google Scholar]
- 68.Munakata K, Iwamoto K, Bundo M, Kato T. Mitochondrial DNA 3243A>G mutation and increased expression of LARS2 gene in the brains of patients with bipolar disorder and schizophrenia. Biol Psychiatry. 2005;57:525–532. doi: 10.1016/j.biopsych.2004.11.041. [DOI] [PubMed] [Google Scholar]
- 69.Onishi H, Kawanishi C, Iwasawa T, et al. Depressive disorder due to mitochondrial transfer RNALeu(UUR) mutation. Biol Psychiatry. 1997;41:1137–1139. doi: 10.1016/S0006-3223(97)00005-X. [DOI] [PubMed] [Google Scholar]
- 70.Miyaoka H, Suzuki Y, Taniyama M, et al. Mental disorders in diabetic patients with mitochondrial transfer RNA(Leu) (UUR) mutation at position 3243. Biol Psychiatry. 1997;42:524–526. doi: 10.1016/S0006-3223(97)00280-1. [DOI] [PubMed] [Google Scholar]
- 71.Grover S, Padhy SK, Das CP, Vasishta RK, Sharan P, Chakrabarti S. Mania as a first presentation in mitochondrial myopathy. Psychiatry Clin Neurosci. 2006;60:774–775. doi: 10.1111/j.1440-1819.2006.01599.x. [DOI] [PubMed] [Google Scholar]
- 72.Regenold WT, Phatak P, Kling MA, Hauser P. Postmortem evidence from human brain tissue of disturbed glucose metabolism in mood and psychotic disorders. Mol Psychiatry. 2004;9:731–733. doi: 10.1038/sj.mp.4001517. [DOI] [PubMed] [Google Scholar]
- 73.Acker T, Acker H. Cellular oxygen sensing need in CNS function: physiological and pathological implications. J Exp Biol. 2004;207:3171–3188. doi: 10.1242/jeb.01075. [DOI] [PubMed] [Google Scholar]
- 74.Vawter MP, Tomita H, Meng F, et al. Mitochondrial-related gene expression changes are sensitive to agonal-pH state: implications for brain disorders. Mol Psychiatry. 2006;11:615, 63–79. doi: 10.1038/sj.mp.4001830. [DOI] [PMC free article] [PubMed] [Google Scholar]
- 75.Salgado ED, Weinstein M, Furlan AJ, et al. Proton magnetic resonance imaging in ischemic cerebrovascular disease. Ann Neurol. 1986;20:502–507. doi: 10.1002/ana.410200410. [DOI] [PubMed] [Google Scholar]
- 76.Fazekas F, Koch M, Schmidt R, et al. The prevalence of cerebral damage varies with migraine type: a MRI study. Headache. 1992;32:287–291. doi: 10.1111/j.1526-4610.1992.hed3206287.x. [DOI] [PubMed] [Google Scholar]
- 77.Shetty HU, Holloway HW, Rapoport SI. Capillary gas chromatography combined with ion trap detection for quantitative profiling of polyols in cerebrospinal fluid and plasma. Anal Biochem. 1995;224:279–285. doi: 10.1006/abio.1995.1041. [DOI] [PubMed] [Google Scholar]
- 78.Shetty HU, Schapiro MB, Holloway HW, Rapoport SI. Polyol profiles in Down syndrome. myo-Inositol, specifically, is elevated in the cerebrospinal fluid. J Clin Invest. 1995;95:542–546. doi: 10.1172/JCI117696. [DOI] [PMC free article] [PubMed] [Google Scholar]