

Abstract
We examined the effect of large, controlled whisker movements, delivered at a high speed, on the amplitude and spread of depolarization in the anesthetized mouse barrel cortex. The stimulus speed was varied between 1500 to 6000 degrees per second and the extent of movement was varied between 4–16 degrees. The rate of rise of the response was linearly related to the rate of rise of the stimulus. The initial spatial extent of cortical activation was also related to the rate of rise of the stimulus: that is the faster the stimulus onset, the faster the rate of rise of the response, the larger the extent of cortex activated initially. The spatial extent of the response and the rate of rise of the response were not correlated with changes in the deflection amplitude. But slower, longer lasting stimuli produced an Off response, making the actual extent of activation larger for the slowest rising stimuli. These results indicate that the spread of cortical activation depends on stimulus features.
Introduction
Earlier work has shown that at all levels of the trigeminal-to-barrel-cortex pathway, the intensity of the stimulus is related to the rate of rise, not the extent of whisker movement (Gibson and Welker, 1983; Lichtenstein et al., 1990; Shoykhet et al., 2000; Pinto et al., 2000; Arabzahdeh et al., 2004; Rajan et al. 2007; Hasenstaub et al., 2007), and that a simple short lasting stimulus to a single whisker can evoke a response in cortex that lasts for 100s of ms, and spreads throughout barrel cortex and beyond (Peterson et al., 2003a; Ferezou et al., 2006; Frostig et al, 2008; Ferezou et al, 2007). The earlier work has also shown that depolarizations associated with voltage sensitive dye responses are consistent with changes in single neuron depolarization (Peterson et al., 2003a) and that the spread of activation is associated with stimulus evoked field potentials and even multiunit activity (Frostig et al., 2008).
Here we used very fast, constant acceleration, large amplitude, half-cosine wave shaped, short lasting (8–50 ms) stimuli, to examine whether the initial response with these stimuli is related to the rate of rise, and whether the spread of activation depends on amplitude, velocity, or duration of the stimulus. The stimuli that we used were faster rising than that used in most earlier work but was within the range seen during natural whisking into air or against objects (Carvell and Simons, 1990; Lottem and Azouz, 2008; Gao et al, 2003; Stuttgen et al., 2006; Ritt and Moore, 2008; Towal et al., 2008; Grant et al., 2009; Matyas et. al., 2010; Rajan et al. 2007). For example, Gao and colleagues (2001) show velocities up to 3,000 °/sec whisking into air, Ritt and colleagues (2008) show active whisking into sandpaper produces movement up to 10,000 °/sec and Lottem and Azouz (2007) show active whisking into air of up to 5,000 °/ sec. We varied the rate of the stimulus, while controlling for the amplitude of the stimulus and we varied the amplitude of whisker movement between 2–14 degrees (~1 mm to ~ 15 mm) while controlling for the duration of the stimulus. Our results show that the widespread cortical activation depends on stimulus features.
Materials and Methods
Surgery and Dye Staining
All animal experiments described here adhere to the guidelines of the Pierce Animal Care and Use Committee and the National Institutes of Health. Male Swiss Webster mice (25–40 g) were anesthetized with urethane (1 mg/ g, ip), and a feedback controlled heat pad was used to maintain the animal temperature at 37°C. The heart rate and the response to noxious stimuli were monitored and the animal was supplemented with urethane as needed.
The skull was gently exposed, cleaned and a custom-made metal ring was secured to the skull. This ring functioned both as a filling chamber to bathe the exposed cortex in either dye or Ringer’s solution and as a way to attach an arm to hold and orient the plane of imaging. A large craniotomy (6 × 6 mm), bordered by the midline sagital suture, the caudal lambdoid suture, and the lateral temporal/parietal suture, was made using a precision machine drill (Gesswein, Bridgeport CT) with an inverted conical drill bit (Gesswein, part 122–003). The skull flap was removed and the dura was carefully dissected away from the cortical surface. The surface of S1 was oriented in the horizontal plane, and the dorsal surface was imaged digitally under a stereomicroscope for later reference.
In following from Orbach et al (1985), a solution of the styryl dye RH414 (Molecular Probes, Oregon) in artificial cerebrospinal solution (ACSF containing in mM: 135 NaCl, 5 KCl, 1.8 CaCl2, 1 MgCl2 and 5 HEPES; pH 7.38) was applied topically to the cortical surface for 30–60 minutes, and allowed to diffuse in. Subsequently, the cortical surface was rinsed copiously with ACSF to remove unbound dye, and a No. 1 cover-slip was affixed to the metal ring. To monitor heart rate, EKG leads were inserted under the animal’s skin at the left front arm and the right back leg. The EKG was monitored and recorded throughout the experiment using a Warner Instruments Differential AC amplifier, a National Instruments A/D board and custom software (LabView, National Instruments, Texas).
Voltage-Sensitive Dye Imaging (VSDI)
A 100 W tungsten light source, equipped with a Uniblitz shutter (Vincent Associates, Rochester, NY) and fiber optic relay, provided illumination of the cortex. A filtering cube consisting of a 510 nm ± 10 nm excitation filter, a 520 nm dichroic mirror, and a 540 nm long pass emission filter (Chroma Optical, Vermont), along with both a 4.0X (0.4 NA) and a 10X (0.9 NA) dry, plan apochromatic objective were used. Images were collected using a NeuroCCD-SMQ camera (80 × 80 pixels) and NeuroPlex software (RedshirtImaging, LLC). Before imaging, a single low-resolution image was taken at the focal plane of the surface vasculature. This image was used to align the cortical surface to the high-resolution digital image taken under the stereomicroscope. For all VSDI sweeps, however, the focal plane was adjusted to below the surface vasculature to reduce image artifacts arising from vessel movements. To confirm that the field-of-view (FOV) remained constant between each VSDI trial, a repeat of this single static image was taken of the surface vasculature after each trial. Each imaging sweep was ~1 second in duration, consisting of a 100–150 ms pre-stimulus period, followed by a variable duration stimulus period (10–50 ms) and a subsequent post-stimulus period (800–900ms), and with a 5 second interval between successive presentations. For each 1 second sweep, 500 frames were collected. The iterative presentation of a different, pseudo-randomized stimulus with each VSDI sweep was interrupted by a “control” on every 7th and 8th sweep during which baseline epi-fluorescence was recorded without the delivery of a stimulus. These control sweeps were used to subtract the background cardiac and dye bleaching artifacts from VSDI sweeps where a stimulus was presented (Orbach et al., 1985).
All whisker deflections were synchronized to the heart rate and trials with no whisker deflections were used to subtract the hemodynamic artifact (which is a low frequency sinusoidal wave). This method virtually eliminates any hemodynamic artifact. We randomized presentations of the various modulated whisker deflections to avoid any systematic slow changes in physiology, condition of the animal or other drifts in the experimental measures.
To avoid drifts in intensity of signal, we used tungsten bulb illumination, such bulbs have only very slow (minutes) drifts in intensity, and no high frequency noise (>0.2 Hz), ‘bulb arch skipping’ or repetitious noise.
Whisker Imaging
A second high speed camera (Basler 602f Ahrensburg, Germany, 1 Khz frame rate, CMOS sensor, 68 × 61 pixels) was focused on the whisker pad to record the effect of the stimulus on whisker displacement concurrently with VSDI. An infra red LED array was used to illuminate multiple whiskers or single whiskers (Figure 1A). Whisker displacement and trajectory were determined for each sweep, and presentations of the same type of stimulus, e.g., amplitude, were sorted and averaged for the entire trial (Figure 1B, C). The whisker images were analyzed using a custom program (LabView, National Instruments, Texas) that semi-automatically detects and plots (Figure 1) changes in whisker position throughout a deflection.
Figure 1. Stimulus waveform and semi-automated detection of whisker position.

A cosine shaped waveform is used as a stimulus; the whisker trajectory is monitored with a high speed camera on every trial. A) The whisker deflection for a single trial is shown beginning at 150 ms into a trial; the deflection lasts for 8 ms. The angular displacement of the whisker is evident as the change in angle around the pivot point in both the grey scale inverted frame of video taken from above the whisker (top panes) and in the automated binary extraction of the same frame (bottom dark panes). Overlaid on the frame is a green search region in which the program identifies the whisker and marks it with the large red dot. The pivot point (small red dot) of the whisker is identified and the resting angle identified as 0°. In each subsequent frame (at 1 ms intervals) the whisker is identified and its angle compared to that of the whisker at rest. (B) A plot of the whisker motion determined by the search algorithm. (C) Average whisker movements from a single experiment in which the whisker is moved to one of six positions in random order. Each trace is an average of approximately 50 movement trials. Data is mean +/− SD. Note that the movement of the whisker is highly reproducible at even the largest displacement, and that the motion is smooth, and there is very little ringing, even though the movement is large.
Whisker Stimulation
For all experiments, we first used an air puff stimulus to topographically localize barrel columns (Figure 2). Air puffs were delivered from a narrow diameter (1 mm) tube (10 ms pulse, 70 PSI, PicoSpritzer, General Valve) tube which was positioned with a micromanipulator in a plane parallel to the animal’s mystacal pad, approximately 1 cm from the face, and with the nozzle tip placed ~1 mm rostral or caudal to the whisker. This large stimulus evokes all aspects of the previously reported VSDI response, i.e., a depolarization, followed by hyperpolarization and a rebound like depolarization (Kleinfeld and Delaney, 1996); however, the response to the air puff was used only to determine the location of the B1 barrel and surrounding barrels. Once the B1 barrel had been located, all whiskers except for those in the same arc (i.e., A1-E1) were trimmed close to the fur.
Figure 2. Identification of B1 barrel.

An air puff stimulus was used to establish the spatial location of the B1 barrel. (A) The surface vasculature of the cortex was used as a landmark for overlaying serial images of whisker-evoked activity. The temporal response profile measured as the fractional change in fluorescence intensity (ΔF/F0) evoked by a 15 ms air puff, in spatially distinct areas (orange and blue circles) is distinct. The orange VSD signal shows a rapid large depolarization followed by a biphasic response. The blue VSD signal shows a small depolarization followed by a large hyperpolarization. The montage on the right shows serial images of the development of the voltage signal over barrel cortex following a brief stimulus to the B1 whisker. Data were averaged from n = 250 sweeps, every 4th frame is shown here. The first frame was taken 98 ms into the sweep and 2 ms prior to triggering the air pulse. The scale bar on the first frames measures 1 mm. The pseudo-colored representation of the evoked response shown in the montage on the right corresponds to the scale indicated for this graph. Red represents a change in fractional fluorescence intensity (ΔF/F0) of ~0.11% from baseline (0%, transparent) and indigo represents a decrease in activity with ΔF/F0 of ~0.65% (scales are inverted for RH414 because depolarizations elicit a decrease in fluorescence intensity). B. The spatial center of a barrel was identified by examining the fractional change in fluorescence intensity (ΔF/F0, %) in the first 10 ms. The spatial center of activity was different for the different whiskers. The VSD signal for the center and surround were spatially distinct Lambda (La) and Bregma (Br) are marked and the lateral (L) and caudal (C) orientations are indicated by the arrows. The smaller inset box with dotted-border delineates a magnified view corresponding to the frames below in B. Each frame is 1.8 mm square.
To accomplish direct mechanical deflections of a single whisker, an electrodynamic mini-shaker (Brüel & Kjær, Denmark) was used (Figure 1). For large, high velocity movements, the mini shaker was a better mechanical device than the piezo element, because even when the movements were large and rapid and reproducible (Figure 1), resonance was less of an issue. Mechanical stimulus waveforms were generated with a custom LabView program and a high-speed digitizer PCI board from National Instruments and fed to a low impedance DC power source that drove the stimulator. The whisker was threaded through a small loop (< 0.5 mm diameter) at the end of the stimulator, and this allowed the whisker to be pulled rostrally as the tip of the stimulator moved in or out. Three different stimulus waveforms were applied in a computer-generated pseudo-randomized fashion. The amplitude or duration of the whisker deflection (3 deflections in the rostral direction) were varied; this included several hundred iterations of the different pseudo-randomized stimuli. When the stimulus duration was varied, the three durations were intercalated with the different durations delivered randomly when the amplitude was varied three amplitudes were intercalated. The stimulus duration was chosen on the basis of the previously published work showing that short duration contacts occur and that in very simple tasks in head fixed animals, the majority of contacts lasted for less than 100 ms (Sachdev et al., 2001; Sachdev et al., 2002; Knutsen et al., 2006).
Temporal Analysis of VSDI Recordings
Analysis of each image series was performed using RedShirtImaging, LLC, Neuroplex software and custom software written in LabView and Igor Pro (Wavemetrics, Lake Oswego, OR). The initial peak and rise time, time-to-peak and full width at half maximum were measured. The spatial VSD signal was characterized by calculating the size and position of the response, created by thresholding the signal. The temporal response was measured on raw unfiltered images by averaging the fractional change in fluorescence intensity (ΔF/F0) over a 300 μm2 kernel centered on the initial site of activation. To improve the signal-to-noise ratio of the whisker-evoked response, 90 to 300 sweeps were averaged for each stimulus condition. Baseline fluorescence (F0) was calculated by averaging frames (6–12 ms) before the stimulus onset. The timing of the voltage response was measured under two stimulus conditions: (1) amplitude was varied at a fixed duration and (2) duration was varied at a fixed amplitude. Under both stimulus conditions, the peak velocity of the stimulus also changed, but the change was over the range of velocities (1000–6500°/s). The absolute peak response amplitude, the time to peak and the full width at half maximum (FWHM) were measured to quantify the magnitude, latency and duration of the evoked response, respectively. Note that because the dye bleaches over time, we present stimuli in an intercalated fashion that is the different duration stimuli were mixed with each other, the different amplitude stimuli were mixed with each other.
Absolute Peak Amplitude
The initial peak response was identified by calculating a linear fit of peak slope and examining the time point when the initial depolarization slope achieved 2 standard deviations (SD). For short duration stimuli, the initial peak response and the absolute peak response were essentially identical, irrespective of deflection amplitude. While it was straightforward to identify the peak amplitude of the evoked response to short deflections, with longer duration deflections this was more complicated, mainly due to the fact that the initial peak and the absolute peak did not coincide. For this reason, in the experiments where long duration stimuli were used, the peak slope of the initial activation, instead of the peak amplitude of the response, was measured. The peak rate of change of fluorescence (ΔF/F0) was typically achieved within the first 5–10 ms of the response onset.
Time to absolute peak
This value was measured to evaluate how changes in whisker deflection modulated the time it took to reach the absolute peak of activation. This measure was sensitive to changes in response latency. In experiments where the amplitude of whisker deflection was varied at a fixed duration, the determination of time-to-peak was straightforward since the absolute and initial peaks in the evoked response were identical. Conversely, for experiments in which the duration of whisker deflection was varied, we used the absolute peak to measure overall response latency since this value reflected the response modulation better than the time to initial peak. The time-to-peak measure was expressed in milliseconds from start of the trial.
Full width at half maximum (FWHM)
The FWHM was used to measure modulation in the duration (in milliseconds) of whisker evoked responses over the first 300 ms of post-stimulus activation. The FWHM was measured only over the first 300 ms and represents the period of time during which the depolarization activity remains above 50% of the initial peak response amplitude. Again, for experiments in which deflection amplitude was varied this was straightforward since the initial and absolute peak responses were the same. For experiments in which deflection duration varied, the initial peak response was measured because the initial peaks were more consistent than the absolute peaks for different duration deflections.
Spatial Analysis of VSDI Recordings
Variations in both the amplitude of whisker deflection at a fixed duration and the duration of whisker deflection at a fixed amplitude modulated the size of the evoked response. To measure this modulation, a threshold was set at 50% of the maximum depolarization amplitude. For these experiments, a spatial smoothing (Gauss) filter was applied seven times to each frame prior to thresholding the image. The object produced by this process was evaluated for area in square microns.
Experimental Variation
The whisker-evoked response and the magnitude of its modulation with changes in the amplitude and duration whisker deflection varied from animal to animal. These differences were likely due to variations in the dye penetration and washout. While the absolute fluorescence intensity varied between animals the pattern of modulation in the evoked response to changes in a particular stimulus parameter were consistent. In addition to inter-animal variation in fluorescence signal, the precise amplitude and speed of whisker deflection varied slightly from experiment to experiment because the precise angle and point of stimulation on the whisker varied. Note that the variability in stimulation from experiment to experiment only becomes apparent because we monitored every stimulus waveform (with a high speed camera), and record the point on the whisker where it was contacted by the stimulator for every trial.
Statistical Analysis
Student’s t-tests were performed at each point in the fluorescence response comparing the largest deflection or duration to the shortest deflection or duration, respectively. We examined the difference between average traces from different presentations at every point along the response time course and present these. Asterisk above the traces in Figure 3C and F and Figure 6B and E indicate where p < 0.05 at each point examined.
Figure 3. Effect of stimulus duration and amplitude on the timing of the response.

The voltage response was measured from a 300 μm diameter area centered over the region of initial maximal activation (i.e., the principle barrel of the B1 whisker) while the duration (A–C) and the amplitude (D–F) were varied. The responses of a single animal are illustrated in A/B and D/E and the averages of seven animals are presented in C and F. A–B) Whisker deflections of three different durations are illustrated (actual whisker movements (± SD) are in inset in A). Deflections of 8 ms (5632°/s; n=301 presentations), 15 ms (4887°/s; n= 299) and 50 ms (1526°/s; n=309) with a long (A) and short (B) time base. The averages (±SEM) from seven experiments are shown in C. The asterisk above the traces in C indicate time points when there was a significant (p<0.05; Student’s t-test) difference between the 8 and 50 ms traces. D–F) The amplitude of deflection was varied while the duration remained constant Green trace (4.2° (1548°/s; n=223), 8.5° (2968°/s; n=257) and 14° (5589°/s; n=250). The averages (±SEM) of seven animals are shown in F. The asterisk above the traces indicate times when there was a significant (p<0.05; Student’s t-test) difference between the small and large amplitude deflections.
Figure 6. Effect of stimulus duration and amplitude on the spatial extent of activation.

The B1 whisker deflection duration (A and B) and amplitude (C and D) were varied independently. The area of cortical surface (in square microns) above 50% of maximum ΔF/F is plotted against time. A) Comparison of the magnitude or cortical depolarization spread between a short, medium and long duration whisker displacement in a single animal. B) The average of seven animals. In all traces the stimulus onset is at 150 ms. The asterisk above the traces in B indicate times when there was a significant (p<0.05; Student’s t-test) difference between the small and large duration deflections. As the duration of stimulation increases, a larger area of cortex is activated for a longer duration. C) Difference between the longest duration displacement and the shortest duration displacement (green-red trace in B). D) Comparison of the magnitude or cortical depolarization spread between a short, medium and long amplitude whisker displacement in single animal. E) The average of seven animals. The asterisk above the traces in E indicate times when there was a significant (p<0.05; Student’s t-test) difference between the small and large amplitude deflections. F) Difference between the large amplitude displacement and the shortest amplitude displacement (green-red trace in E). In all traces the stimulus onset is at 150 ms. Each frame is 1.8 mm square.
Results
Voltage sensitive dyes report changes in the supra-threshold activation of neurons and sub-threshold activation of the neuropil, including soma, dendrites, axons and glia (Cohen and Salzberg, 1978; Grinvald et al., 1982; Orbach et al., 1985; Berger et al., 2007). An air puff stimulus used for identification of barrel here produced a triphasic response – similar to that reported in earlier studies (Kleinfeld and Delaney, 1996; Derdikman et al., 2003) centered over the principle barrel (Figure 2A lower left panel). The onset of depolarization in S1 was rapid, focal (to ~50 micron resolution), and occurred within 8–10 ms of the start of whisker movement. The initial rapid depolarization phase usually peaked ~10–15 ms after onset, was followed by a hyperpolarization that lasted 200–300 ms, and ended with a slow-rising depolarization that decayed back to baseline 500–800 ms after the stimulus onset. The spatiotemporal pattern of whisker-evoked response was consistent within animals for similar stimuli delivered to different whiskers. The position of initial activation varied in a pattern consistent with barrel topology (Figure 2B) and the position of activation was used to identify the location of B1 barrel relative to surrounding barrels.
Stimulus features modulate the duration and spread of depolarization
To examine how stimulus features affect the VSDI signal, we used a solenoid-driven, cosine-shaped stimulus, similar in shape to the whisker deflection trajectory produced by a brief air puff (see the inserts in Figure 2A and B). This stimulus had no hold period; the whisker was in motion at all times during the stimulus. Three aspects of this stimulus were varied: deflection velocity (1500–6000 deg/s in all panels), deflection duration (Figure 3A–C short 8ms medium 15 ms, and long 50 ms) and deflection amplitude (Figure 3D–F, Small 4, medium 8.5 and large 16 deg). For half of the stimuli, the amplitude was fixed (~16 degree) and duration was varied (Figure 3A–C); for the other half, the duration was fixed (8 ms) and the amplitude was varied (Figure 3D–F). The average ΔF/F0 over a 300 micron diameter kernel centered over the site of initial activation in the B1 barrel was used to evaluate the temporal profile of the averaged evoked response in relation to three different deflection durations and three different amplitudes in the rostral direction. Note that when the amplitude of whisker deflection was fixed, both the duration and velocity were varied, and when the duration was fixed, both the amplitude and velocity were varied. In either case (fixed amplitude or fixed duration), the velocity varied over a similar range, and the rate of rise of the stimulus effectively altered the response (Figure 3); however, this modulation was most profound with variation in stimulus duration (Figure 3A–C). This is evident in both the full scale (Figure 3A) and the expanded scale (Figure 3B) records of single experiments and in the average data from 7 experiments (Figure 3C). As the duration of whisker deflection to the peak angle increased, the initial slope rate of the VSDI response decreased and the initial time to peak decreased (Figure 3A, compare the red trace to the green trace). Furthermore, as the duration of the stimulus increased, the rate of rise and the peak amplitude of the evoked response decreased, but the depolarization persisted longer, i.e., the full-width-at-half-maximum of the peak response was wider. The long duration (50 ms) stimulus produced a depolarization for the entire length of the stimulus, and this depolarization persisted for more than a hundred milliseconds after the whisker had returned to rest. Note that these results do not depend on the direction of whisker stimulation. Both a rostral and caudal deflection produced similar results (not shown). An increase in the amplitude of the stimulus (though it was also associated with an increase in the velocity of the whisker deflection) had a significant modulatory effect only on the initial rate of rise and the peak amplitude of the evoked response (p < 0.01; n=7; Student’s t-test), but had no effect on the rate of fall or on the duration of the depolarization (Figure 3D–F).
Summary data from 7 experiments gave one clear explanation for why increasing the duration of stimulation increases the duration of the depolarization: the long (50 ms) duration stimulus evoked an Off response that decayed slowly (Figure 3 C). The Off response is seen as a second depolarization that correlates with the return of the whisker to rest. Changes in the amplitude of the stimulus had no such effect on the evoked response. Note, however, that changes in the amplitude of the whisker deflection did alter the rate of rise of the stimulus, and that altering the rate produces significant changes in the initial response amplitude and rate of rise of the response. Correlation analyses of three different measures; (i) initial slope of activation/peak amplitude (Figure 4 A, D), (ii) time to peak (Figure 4 B, E), and (iii) full width at half maximum (Figure 4 C, F) all produced a consistent result: altering the duration (Figure 4A–C) of the stimulus modulates parameters of the response more effectively than varying the amplitude (Figure 4D–F) of the stimulus.
Figure 4. Correlation between stimulus duration (A–C) or amplitude (D–F) and various response parameters.

(A) The maximum initial slope rate, (D) peak amplitude, (B,E) time to peak and (C,F) full width at half maximum (FWHM) of the voltage response were measured for deflections of different durations (A–C) and amplitude (D–F). Black lines are the single linear fits to normalized responses in single experiments (N=8). Values next to linear fits represent the R2 value of the fit.
The correlation between the rate of rise of the response (initial slope of the response), the time to peak, or FWHM were significantly larger when the duration of the stimulus was varied as compared to when the amplitude was varied. In fact, the peak amplitude of the depolarization, its rate of rise, and its duration showed no significant relationship to the amplitude of whisker movement. Thus over the range of duration deflections examined there was a linear relationship between the stimulus duration and all response properties examined. However for amplitude modulation there was a linear relationship between stimulus amplitude and peak response amplitude.
Modulation of spatial response
Next, we evaluated how changes in the rate of rise, duration and amplitude of the B1 whisker deflection modulated the spread of activity over the surface of S1. The smoothed pixel maps show that the initial extent of activation is largest for the fast rising stimuli (Figure 5A), but the longer duration stimuli evoked longer lasting, sustained depolarizations over larger areas of cortex (Figure 5A) than short lasting fast rising stimuli (Figure 5B). The integrated area under the spatial modulation pixel maps (Figure 5) at different displacement durations was converted into a single measure by combining the duration of activation and the area of activation following B1 whisker deflection (Figure 6). The integrated activity-maps indicate that changes in the deflection duration produced relatively large changes in the spread of evoked activity. Though it took longer for the evoked response to reach the 50% threshold of peak depolarization with slow, long duration stimuli (Green traces, Figure 6A,B), this evoked depolarization was consistently sustained above this threshold over a widespread area for longer periods as compared to when the B1 whisker was deflected with shorter duration stimuli (Red, Blue traces, Figure 6A,B). Most of the increase in the spatial extent of activation with the slow duration stimulus was related to the Off response, which had a particularly long time course, which is evident in the subtraction of the integrated area (Figure 6C). The broad extent of the depolarization with the slow stimulus was evident in the single examples (Figures 6A–C) of the integrated activity for the three stimulus durations in both the rostral and caudal directions (not shown).
Figure 5. Effect of stimulus duration on the spatial extent of activation.
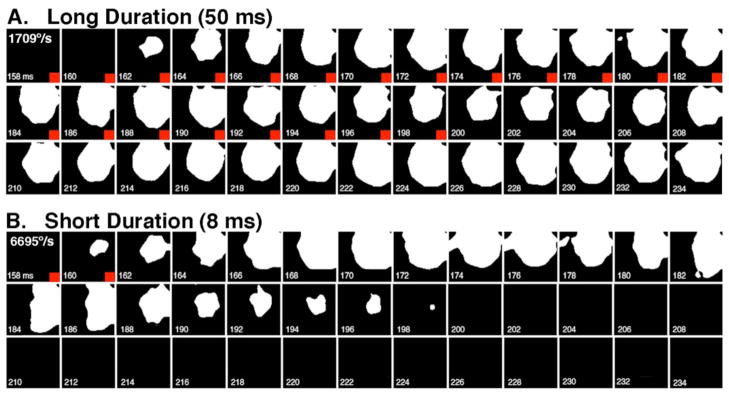
Sequential binary extracts of images from a single 50 ms (Top) and 8 ms (bottom) whisker deflection illustrate the portion of the cortical surface that shows >50% increase in ΔF/F. Red square in corner of each frame denotes when the whisker is moving in each series. The longer duration deflection results in a quantitatively different response, a longer lasting activation of cortex. Each frame is 1.8 mm squared.
By comparison, variations in the deflection amplitude and peak velocity at a fixed duration, made little difference to the spread of activation in S1 cortex (Figures 6D–F). Changes in the deflection amplitude produced relatively small and inconsistent changes in the spread of evoked activity. Larger amplitude (and therefore faster rising and stronger) deflections did not evoke longer lasting activity over larger areas of S1. Large deflections at high rates, however, did initiate a larger spread of activation at significantly (P < 0.05; Student’s t-test) shorter latencies than the small amplitude, slower stimuli.
Discussion
The results presented here demonstrate that the amplitude and spatial pattern of neocortical activity elicited by whisker stimulation is affected by the duration and rate of rise of stimuli, particularly by the occurrence of Off responses. The initial amplitude and spatial extent of activation and the overall spatial extent of activation were related to the stimulus intensity, i.e. velocity, and duration of the stimulus.
Previous studies examining the relationship between the rate of whisker movement, duration of movement and amplitude of movement and neocortical responses have reported that: 1) the rate of rise of the stimulus affects the rate of depolarization in cortical neurons (Derdikman et al., 2003; Wilent and Contreras, 2004); 2) the amplitude of whisker movement is directly correlated to the amplitude and spread of the cortical response (Petersen et al., 2003a; Berger et al., 2007); and 3) the spread of cortical response is affected by the inter stimulus interval (Sheth et al., 1998).
The present study extends the earlier work by showing that even with large amplitude, very fast whisker deflections, as seen during natural whisking, the rate of rise of the depolarization and its spread in layer 2/3 depends on rate of rise of the stimulus (Carvell and Simons, 1990; Gao et al, 2003; Stuttgen et al., 2006; Ritt et al. 2007; Towal et al., 2008; Grant et al., 2009; Carvell and Simons, 1990; Sachdev et al., 2001; 2002; Knutsen et al, 2003).
What are Off responses?
Whisker stimuli evoke both On and Off responses in the trigeminal ganglia, trigeminal brainstem nuclei and in the thalamo-cortical circuits. None of the neurons in the whisker to barrel cortex pathway respond exclusively to stimulus Off. In this, it is clear that Off responses in the whisker system are not like those in the visual system where the circuits that produce On and Off responses are largely segregated (Schiller, 1992; Jin et al., 2008); in barrel cortex and even at the level of the trigeminal ganglion and trigeminal brainstem nuclei, neurons that fire to stimulus onset, often have a robust response to stimulus Off. These Off responses are generally weaker and have slower onset than On responses (Simons, 1978; Simons and Carvell, 1989; Lichtenstien et al., 1990; Kryiazi et al., 1994; Webber and Stanley, 2004); they can be enhanced by blockade of GABAergic transmission (Kryiazi et al., 1994); they have never been described for stimuli that last for less than 25 ms (Armstrong-James and Fox, 1987; Armstrong-James et al., 1992; Webber and Stanley, 2004). Here, we show that the depolarization related to the Off response persists for longer than the On response, primarily because the Off response decays at a slower rate either because it begins at a more depolarized membrane potential or because it engages cortical circuits differently.
A simple hypothesis is that the Off response engages neurons and cortical circuits that prefer a stimulus direction orthogonal to the stimulus that evokes an On response – that is instead of engaging On and Off circuits, the stimulus engages directionally selective neurons and circuits (see Webber and Stanley, 2004). In this line of thinking, the stimulus On and stimulus Off activate somewhat different but overlapping groups of adjacent neurons, preferentially. The reason for the different response at stimulus on and off could be that the Off response is smaller at the level of the ganglion cells (Lichtenstein et al., 1990), or that depolarization and spiking of sustained neurons and circuits in thalamus and layer IV of cortex modifies activity within thalamo-cortical circuits, and consequently, modifies the characteristics of the Off response (irrespective of the direction of the stimulus).
Travelling Waves in Neocortex
Large scale activation of cortex have been reported in both visual and somatosensory cortices (Orbach et al., 1985; Grinvald et al., 1986; Armstrong-James and Fox, 1987; Frostig et al., 1990; Ts’o et al., 1990; Kleinfeld and Delaney, 1996; Roland et al., 2006; Moore and Nelson, 1998; Ghazanfar and Nicolelis, 1999; Brecht and Sakmann, 2002; Brecht et al., 2003; Derdikman et al., 2003; Devor et al., 2003, 2005; Devor et al., 2007; Higley and Contreras, 2003, 2005; Masino, 2003; Petersen et al., 2003a,b; Ferezou et al., 2006, 2007; Chen-Bee et al., 2007; Xu et al., 2007). In barrel cortex, stimulation of any whisker, evokes a response at the somatotopically appropriate location, which then spreads somewhat nonspecifically, primarily as a result of long range cortico-cortical connections, that evoke both suprathreshold and subthreshold activation along the way (see Frostig et al., 2008). Our work shows that this depiction of the stimulus evoked response is correct in that all stimuli evoke widespread activation in barrel cortex but changing the temporal aspects of a stimulus changes the spatial/temporal cortical activation pattern. Fast rising stimuli, evoke a greater extent of initial activation than do stimuli with slower rise times, but slower stimuli evoke responses that spread over a significantly larger area of cortex and are sustained longer. Therefore, the spread of activation is stimulus feature dependent. A corollary of this finding is that specific stimulation patterns elicit different spread of activation in cortex. One obvious explanation for the different spatial and temporal development of depolarization with the different stimulation parameters, is not that inhibition and recurrent excitation are differentially engaged by the stimuli, but that the number and nature of neurons engaged by the stimulus are different. For example, fastest rising stimuli evoke a response from more neurons, more rapidly, more synchronously, than the slower rising stimuli do. The slower rising, long duration stimuli evoke a response from fewer neurons initially, but engage more neurons for longer, and especially, activate the long range projecting neurons for longer.
Implications for barrel cortical function
Key features of cortical organization include the cortical column and the topographic maps of the sensory periphery, e.g., the barrels. In this context, model of cortical organization makes little sense: What does it mean that barrel cortical neurons have specific receptive fields or topography, mapping one whisker to one barrel, when a single whisker stimulus activates millimeters of somatosensory cortex for hundreds of milliseconds? Why should varying the stimulus to a single whisker—a single somatotopic point on the rodent snout—modulate the spatial extent of cortical activation? In fact, studies have shown that many different classes of stimuli to a single whisker can evoke widespread activation in barrel cortex, e.g., a 20 Hz, 900 ms long, 6 degree stimulus (Kleinfeld and Delaney, 1996), a ramp and 100 ms hold (1600 degree/sec) stimulus (Civillico and Contreras, 2006), and a complex bidirectional 10 ms stimulus ranging in amplitude from 2–10 degrees (Petersen et al., 2003a; Ferezou et al., 2006). Similar results have been obtained in primary visual cortex, where wide spread activation is evoked by different visual stimuli (Senseman, 1996; Senseman, 1999; Xu et al., 2007; Roland et al., 2006). Taken together, our work and earlier work indicate that the spread of depolarization represents the entire spatial extent of the surrounding cortical area influenced by a single whisker’s movement.
Despite the somatotopic and column organization of barrel cortex, earlier work has shown that barrel neurons do not have just a single whisker receptive field (Simons, 1985; Armstrong-James and Fox, 1987; Nicolelis et al., 1995; Moore and Nelson, 1998; Brecht and Sakmann, 2002 and Brecht et al., 2003; Zhu and Connors, 1999; Roy et al., 2011). The present work reproduces earlier work with voltage sensitive dyes in showing that depolarization begins at the center of the receptive field, in the appropriate barrel, and then spreads outward to the surround. That is, the initial whisker evoked depolarization is topographic and columnar, but the later cortical response is no longer precisely topographic or columnar. It is possible that the spreading depolarization is a signature of surround inhibition or surround suppression. That is, though the response to whisker deflection is a depolarization, this rapid spreading depolarization (achieving peak amplitude and spread within 30 ms) could also be a signature of the phenomena described as surround whisker inhibition (Simons, 1985; Simons and Carvell, 1986; Sheth et al., 1999; Webber and Stanley, 2004). Just as depolarization of single neurons involves both inhibitory and excitatory circuits, the travelling wave of depolarization should also involve both excitatory and inhibitory circuits (Shu et al., 2003; Haider et al. 2006; Hasenstaub et al., 2007). The depolarization need not represent only excitation (Peterson et al., 2003b; Sachdev et al., 2004; Hasenstaub et al., 2007).
One of the puzzles introduced by the spreading depolarization observed in VSDI data is that it implies that stimulation of single whiskers should activate neurons in the entire barrel field, indeed in a large area of cortex. This is supported by recent work showing that single whisker stimuli can indeed activate neurons in widespread areas of cortex (see Frostig et al., 2008), even induce Up states (Hasenstaub et al., 2007) in a behavior state dependent manner (Ferezou et al., 2006; Ferezou et al., 2007). Discrete visual stimulus of a particular strength can also evoke a wave activation (i.e. travelling wave) that spreads across visual cortex (Roland et al., 2006; Xu et al., 2007; Benucci et al., 2007). However the present results indicate that the spatial spread and the duration of cortical activation strongly depends on aspects of the stimulus, i.e. all stimuli are not equal. Understanding sensory information processing will require that we understand what the spread of activation means for behavior and perception.
Acknowledgments
The authors wish to acknowledge the mechanical and electrical development assistance of: Richard Rascati, John Buckley, Michael Fritz, Ron Goodman, Tom D’Alessandro, Angelo DiRubba. This work was supported by The John B. Pierce Laboratory, the National Institutes of Health and the Department of Defense.
Footnotes
Declaration of interest: The authors report no conflicts of interest. The authors alone are responsible for the content and writing of the paper.
References
- Arabzadeh E, Panzeri S, Diamond ME. Whisker vibration information carried by rat barrel cortex neurons. J Neurosci. 2004;24:6011–6020. doi: 10.1523/JNEUROSCI.1389-04.2004. [DOI] [PMC free article] [PubMed] [Google Scholar]
- Armstrong-James M, Fox K. Spatiotemporal convergence and divergence in the rat S1 “barrel” cortex. J Comp Neurol. 1987;263:265–281. doi: 10.1002/cne.902630209. [DOI] [PubMed] [Google Scholar]
- Benucci A, Frazor RA, Carandini M. Standing waves and traveling waves distinguish two circuits in visual cortex. Neuron. 2007;55:103–117. doi: 10.1016/j.neuron.2007.06.017. [DOI] [PMC free article] [PubMed] [Google Scholar]
- Berger T, Borgdorff A, Crochet S, Neubauer FB, Lefort S, Fauvet B, Ferezou I, Carleton A, Lüscher HR, Petersen CCH. Combined voltage and calcium epifluorescence imaging in vitro and in vivo reveals subthreshold and suprathreshold dynamics of mouse barrel cortex. J Neurophysiol. 2007;97:3751–62. doi: 10.1152/jn.01178.2006. [DOI] [PubMed] [Google Scholar]
- Brecht M, Sakmann B. Dynamic representation of whisker deflection by synaptic potentials in spiny stellate and pyramidal cells in the barrels and septa of layer 4 rat somatosensory cortex. J Physiol. 2002;543:49–70. doi: 10.1113/jphysiol.2002.018465. [DOI] [PMC free article] [PubMed] [Google Scholar]
- Brecht M, Roth A, Sakmann B. Dynamic receptive fields of reconstructed pyramidal cells in layers 3 and 2 of rat somatosensory barrel cortex. J Physiol. 2003;553:243–265. doi: 10.1113/jphysiol.2003.044222. [DOI] [PMC free article] [PubMed] [Google Scholar]
- Berger T, Borgdorff A, Crochet S, Neubauer FB, Lefort S, Fauvet B, Ferezou I, Carleton A, Lüscher HR, Petersen CC. Combined voltage and calcium epifluorescence imaging in vitro and in vivo reveals subthreshold and suprathreshold dynamics of mouse barrel cortex. J Neurophysiol. 2007;97:3751–62. doi: 10.1152/jn.01178.2006. [DOI] [PubMed] [Google Scholar]
- Carvell GE, Simons DJ. Biometric analyses of vibrissal tactile discrimination in the rat. J Neurosci. 1990;10:2638–48. doi: 10.1523/JNEUROSCI.10-08-02638.1990. [DOI] [PMC free article] [PubMed] [Google Scholar]
- Cohen LB, Salzberg BM. Optical measurement of membrane potential. Rev Physiol Biochem Pharmacol. 1978;83:35–88. doi: 10.1007/3-540-08907-1_2. [DOI] [PubMed] [Google Scholar]
- Chen-Bee CH, Agoncillo T, Xiong Y, Frostig RD. The triphasic intrinsic signal: implications for functional imaging. J Neurosci. 2007;27:4572–4586. doi: 10.1523/JNEUROSCI.0326-07.2007. [DOI] [PMC free article] [PubMed] [Google Scholar]
- Civillico EF, Contreras D. Integration of evoked responses in supragranular cortex studied with optical recordings in vivo. J Neurophysiol. 2006;96:336–351. doi: 10.1152/jn.00128.2006. [DOI] [PubMed] [Google Scholar]
- Derdikman D, Hildesheim R, Ahissar E, Arieli A, Grinvald A. Imaging spatiotemporal dynamics of surround inhibition in the barrels somatosensory cortex. J Neurosci. 2003;23:3100–3105. doi: 10.1523/JNEUROSCI.23-08-03100.2003. [DOI] [PMC free article] [PubMed] [Google Scholar]
- Devor A, Dunn AK, Andermann ML, Ulbert I, Boas DA, Dale AM. Coupling of total hemoglobin concentration, oxygenation, and neuronal activity in rat somatosensory cortex. Neuron. 2003;39:353–359. doi: 10.1016/s0896-6273(03)00403-3. [DOI] [PubMed] [Google Scholar]
- Devor A, Ulbert I, Dunn AK, Narayanan SN, Jones SR, Andermann ML, Boas DA, Dale AM. Coupling of the cortical hemodynamic response to cortical and thalamic neuronal activity. Proc Natl Acad Sci USA. 2005;102:3822–3827. doi: 10.1073/pnas.0407789102. [DOI] [PMC free article] [PubMed] [Google Scholar]
- Devor J Neurosci. 2007 [Google Scholar]
- Ferezou I, Bolea S, Petersen CC. Visualizing the cortical representation of whisker touch: voltage-sensitive dye imaging in freely moving mice. Neuron. 2006;50:617–629. doi: 10.1016/j.neuron.2006.03.043. [DOI] [PubMed] [Google Scholar]
- Ferezou I, Haiss F, Gentet LJ, Aronoff R, Weber B, Petersen CC. Spatiotemporal dynamics of cortical sensorimotor integration in behaving mice. Neuron. 2007;56:907–923. doi: 10.1016/j.neuron.2007.10.007. [DOI] [PubMed] [Google Scholar]
- Frostig RD, Lieke EE, Ts’o DY, Grinvald A. Cortical functional architecture and local coupling between neuronal activity and the microcirculation revealed by in vivo high-resolution optical imaging of intrinsic signals. Proc Natl Acad Sci USA. 1990;87:6082–6. doi: 10.1073/pnas.87.16.6082. [DOI] [PMC free article] [PubMed] [Google Scholar]
- Frostig RD, Xiong Y, Chen-Bee CH, Kvasnak E, Stehberg J. Large-scale organization of rat sensorimotor cortex based on a motif of large activation spreads. J Neurosci. 2008;28:13274–84. doi: 10.1523/JNEUROSCI.4074-08.2008. [DOI] [PMC free article] [PubMed] [Google Scholar]
- Gao P, Bermejo R, Zeigler HP. Whisker deafferentation and rodent whisking patterns: behavioral evidence for a central pattern generator. J Neurosci. 2001 Jul 15;21(14):5374–80. doi: 10.1523/JNEUROSCI.21-14-05374.2001. [DOI] [PMC free article] [PubMed] [Google Scholar]
- Gao P, Hattox AM, Jones LM, Keller A, Zeigler HP. Whisker motor cortex ablation and whisker movement patterns. Somat Motor Res. 2003;20:191–198. doi: 10.1080/08990220310001622924. [DOI] [PubMed] [Google Scholar]
- Ghazanfar AA, Nicolelis MAI. Spatiotemporal properties of layer V neurons of the rat primary somatosensory cortex. Cereb Cortex. 1999;9:348–61. doi: 10.1093/cercor/9.4.348. [DOI] [PubMed] [Google Scholar]
- Gibson JM, Welker WI. Quantitative Studies of Stimulus Coding in First-Order Vibrissa Afferents of Rats. 1. Receptive Field Properties and Threshold Distributions. Somat Motor Res. 1983;1:51–67. doi: 10.3109/07367228309144540. [DOI] [PubMed] [Google Scholar]
- Grant RA, Mitchinson B, Fox CW, Prescott TJ. Active touch sensing in the rat: anticipatory and regulatory control of whisker movements during surface exploration. J Neurophysiol. 2009;101:862–874. doi: 10.1152/jn.90783.2008. [DOI] [PMC free article] [PubMed] [Google Scholar]
- Grinvald A, Hildesheim R, Farber IC, Anglister L. Improved fluorescent probes for the measurement of rapid changes in membrane potential. Biophys J. 1982;39:301–308. doi: 10.1016/S0006-3495(82)84520-7. [DOI] [PMC free article] [PubMed] [Google Scholar]
- Haider B, Duque A, Hasenstaub AR, McCormick DA. Neocortical network activity in vivo is generated through a dynamic balance of excitation and inhibition. J Neurosci. 2006;26:4535–45. doi: 10.1523/JNEUROSCI.5297-05.2006. [DOI] [PMC free article] [PubMed] [Google Scholar]
- Hasenstaub A, Sachdev RN, McCormick DA. State changes rapidly modulate cortical neuronal responsiveness. J Neurosci. 2007;27:9607–9622. doi: 10.1523/JNEUROSCI.2184-07.2007. [DOI] [PMC free article] [PubMed] [Google Scholar]
- Higley MJ, Contreras D. Nonlinear integration of sensory responses in the rat barrel cortex: an intracellular study in vivo. J Neurosci. 2003;23:10190–10200. doi: 10.1523/JNEUROSCI.23-32-10190.2003. [DOI] [PMC free article] [PubMed] [Google Scholar]
- Higley MJ, Contreras D. Integration of synaptic responses to neighboring whiskers in rat barrel cortex in vivo. J Neurophysiol. 2005;93:1920–1934. doi: 10.1152/jn.00917.2004. [DOI] [PubMed] [Google Scholar]
- Kleinfeld D, Delaney KR. Distributed representation of vibrissa movement in the upper layers of somatosensory cortex revealed with voltage-sensitive dyes. J Comp Neurol. 1996;375:89–108. doi: 10.1002/(SICI)1096-9861(19961104)375:1<89::AID-CNE6>3.0.CO;2-K. [DOI] [PubMed] [Google Scholar]
- Knutsen PM, Pietr M, Ahissar E. Haptic object localization in the vibrissal system: behavior and performance. J Neurosci. 2006;26:8451–8464. doi: 10.1523/JNEUROSCI.1516-06.2006. [DOI] [PMC free article] [PubMed] [Google Scholar]
- Lichtenstein SH, Carvell GE, Simons DJ. Responses of rat trigeminal ganglion neurons to movements of vibrissae in different directions. Somat Motor Res. 1990;7:47–65. doi: 10.3109/08990229009144697. [DOI] [PubMed] [Google Scholar]
- Lottem E, Azouz R. Dynamic translation of surface coarseness into whisker vibrations. J Neurophysiol. 2008;100:2852–65. doi: 10.1152/jn.90302.2008. [DOI] [PubMed] [Google Scholar]
- Masino SA. Quantitative comparison between functional imaging and single-unit spiking in rat somatosensory cortex. J Neurophysiol. 2003;89:1702–1712. doi: 10.1152/jn.00860.2002. [DOI] [PubMed] [Google Scholar]
- Matyas F, Sreenivasan V, Marbach F, Wacongne C, Barsy B, Mateo C, Aronoff R, Petersen CC. Motor control by sensory cortex. Science. 2010;330:1240–3. doi: 10.1126/science.1195797. [DOI] [PubMed] [Google Scholar]
- Moore CI, Nelson SB. Spatio-temporal subthreshold receptive fields in the vibrissa representation of rat primary somatosensory cortex. J Neurophysiol. 1998;80:2882–2892. doi: 10.1152/jn.1998.80.6.2882. [DOI] [PubMed] [Google Scholar]
- Nicolelis MA, Baccala LA, Lin RC, Chapin JK. Sensorimotor encoding by synchronous neural ensemble activity at multiple levels of the somatosensory system. Science. 1995;268:1353–1358. doi: 10.1126/science.7761855. [DOI] [PubMed] [Google Scholar]
- Orbach HS, Cohen LB, Grinvald A. Optical mapping of electrical activity in rat somatosensory and visual cortex. J Neurosci. 1985;5:1886–1895. doi: 10.1523/JNEUROSCI.05-07-01886.1985. [DOI] [PMC free article] [PubMed] [Google Scholar]
- Petersen CC, Grinvald A, Sakmann B. Spatiotemporal dynamics of sensory responses in layer 2/3 of rat barrel cortex measured in vivo by voltage-sensitive dye imaging combined with whole-cell voltage recordings and neuron reconstructions. J Neurosci. 2003a;23:1298–1309. doi: 10.1523/JNEUROSCI.23-04-01298.2003. [DOI] [PMC free article] [PubMed] [Google Scholar]
- Petersen CC, Hahn TT, Mehta M, Grinvald A, Sakmann B. Interaction of sensory responses with spontaneous depolarization in layer 2/3 barrel cortex. Proc Natl Acad Sci U S A. 2003b;100:13638–13643. doi: 10.1073/pnas.2235811100. [DOI] [PMC free article] [PubMed] [Google Scholar]
- Pinto DJ, Brumberg JC, Simons DJ. Circuit dynamics and coding strategies in rodent somatosensory cortex. J Neurophysiol. 2000;83:1158–1166. doi: 10.1152/jn.2000.83.3.1158. [DOI] [PubMed] [Google Scholar]
- Rajan R, Browning AS, Bourke JL. Heterogeneity in the coding in rat barrel cortex of the velocity of protraction of the macrovibrissae. Eur J Neurosci. 2007;8:2383–403. doi: 10.1111/j.1460-9568.2007.05481.x. [DOI] [PubMed] [Google Scholar]
- Ritt JT, Andermann ML, Moore CI. Embodied information processing: vibrissa mechanics and texture features shape micromotions in actively sensing rats. Neuron. 2008;57:599–613. doi: 10.1016/j.neuron.2007.12.024. [DOI] [PMC free article] [PubMed] [Google Scholar]
- Roland PE, Hanazawa A, Undeman C, Eriksson D, Tonrll T, Nakamura H, Valentiniene S, Ahmed B. Cortical feedback depolarization waves: A mechanism of top-down influence on early visual areas. Proceedings of the National Academy of Sciences of the United States of America. 2006;103:12586–12591. doi: 10.1073/pnas.0604925103. [DOI] [PMC free article] [PubMed] [Google Scholar]
- Sachdev RN, Sellien H, Ebner F. Temporal organization of multi-whisker contact in rats. Somatosens Mot Res. 2001;18:91–100. doi: 10.1080/135578501012006192. [DOI] [PubMed] [Google Scholar]
- Sachdev RN, Sato T, Ebner FF. Divergent movement of adjacent whiskers. J Neurophysiol. 2002;3:1440–8. doi: 10.1152/jn.00539.2001. [DOI] [PubMed] [Google Scholar]
- Sachdev RN, Ebner FF, Wilson CJ. Effect of subthreshold up and down states on the whisker-evoked response in somatosensory cortex. J Neurophysiol. 2004;92:3511–3521. doi: 10.1152/jn.00347.2004. [DOI] [PubMed] [Google Scholar]
- Senseman DM. Correspondence between visually evoked voltage-sensitive dye signals and synaptic activity recorded in cortical pyramidal cells with intracellular microelectrodes. Vis Neurosci. 1996;13:963–977. doi: 10.1017/s0952523800009196. [DOI] [PubMed] [Google Scholar]
- Senseman DM. Spatiotemporal structure of depolarization spread in cortical pyramidal cell populations evoked by diffuse retinal light flashes. Vis Neurosci. 1999;16:65–79. doi: 10.1017/s0952523899161030. [DOI] [PubMed] [Google Scholar]
- Sheth BR, Moore CI, Sur M. Temporal modulation of spatial borders in rat barrel cortex. J Neurophysiol. 1998;79:464–70. doi: 10.1152/jn.1998.79.1.464. [DOI] [PubMed] [Google Scholar]
- Shoykhet M, Doherty D, Simons DJ. Coding of deflection velocity and amplitude by whisker primary afferent neurons: implications for higher level processing. Somatosens Mot Res. 2000;17:171–180. doi: 10.1080/08990220050020580. [DOI] [PubMed] [Google Scholar]
- Shu Y, Hasenstaub A, McCormick DA. Turning on and off recurrent balanced cortical activity. Nature. 2003;423:288–93. doi: 10.1038/nature01616. [DOI] [PubMed] [Google Scholar]
- Simons DJ. Temporal and spatial integration in the rat SI vibrissa cortex. J Neurophysiol. 1985;54:615–635. doi: 10.1152/jn.1985.54.3.615. [DOI] [PubMed] [Google Scholar]
- Simons DJ, Carvell GE. Thalamocortical response transformation in the rat vibrissa/barrel system. J Neurophysiol. 1989;61:311–30. doi: 10.1152/jn.1989.61.2.311. [DOI] [PubMed] [Google Scholar]
- Stüttgen MC, Ruter J, Schwartz C. Two psychophysical channels of whisker deflection in rats align with two neuronal classes of primary afferents. J Neurosci. 2006;26:7933–41. doi: 10.1523/JNEUROSCI.1864-06.2006. [DOI] [PMC free article] [PubMed] [Google Scholar]
- Towal RB, Hartmann MJZ. Variability in velocity profiles during free-air whisking behavior of unrestrained rats. J Neurophysiol. 2008;100:740–52. doi: 10.1152/jn.01295.2007. [DOI] [PubMed] [Google Scholar]
- Ts’o DY, Frostig RD, Lieke EE, Grinvald A. Functional organization of primate visual cortex revealed by high resolution optical imaging. Science. 1990;249:417–20. doi: 10.1126/science.2165630. [DOI] [PubMed] [Google Scholar]
- Xu W, Huang X, Takagaki K, Wu JY. Compression and reflection of visually evoked cortical waves. Neuron. 2007;55:119–129. doi: 10.1016/j.neuron.2007.06.016. [DOI] [PMC free article] [PubMed] [Google Scholar]
- Zhu JJ, Connors BW. Intrinsic firing patterns and whisker-evoked synaptic responses of neurons in the rat barrel cortex. J Neurophysiol. 1999;81:1171–83. doi: 10.1152/jn.1999.81.3.1171. [DOI] [PubMed] [Google Scholar]