

Abstract

The heme protein cytochrome c adsorbed to a two-layer gold surface modified with a self-assembled monolayer of 2-mercaptoethanol was analyzed using a two-dimensional (2D) heterospectral correlation analysis that combined surface-enhanced infrared absorption spectroscopy (SEIRAS) and surface-enhanced Raman spectroscopy (SERS). Stepwise increasing electric potentials were applied to alter the redox state of the protein and to induce conformational changes within the protein backbone. We demonstrate herein that 2D heterospectral correlation analysis is a particularly suitable and useful technique for the study of heme-containing proteins as the two spectroscopies address different portions of the protein. Thus, by correlating SERS and SEIRAS data in a 2D plot, we can obtain a deeper understanding of the conformational changes occurring at the redox center and in the supporting protein backbone during the electron transfer process. The correlation analyses are complemented by molecular dynamics calculations to explore the intramolecular interactions.
1. Introduction
Cytochrome c (cyt c) is an important heme protein that functions as an electron carrier within the electron transport chain. As a model system, it has attracted intensive research attention using different characterization techniques.1 Electrochemistry has been successfully used as an important tool to study the functionality of the protein by providing an external potential to mimic the electron transfer process.2,3 Unfortunately, electrochemistry provides little structural information. X-ray crystallography and NMR spectroscopy, on the other hand, are well-known structural characterization techniques that have been applied to the cytochrome c system.4,5 Although very useful, they are not applicable for dynamic studies such as the ones encountered here because of the lack of temporal resolution. Moreover, it is not possible for all the proteins to form a well-ordered crystal. Spectroscopic methods also have been applied by several groups. UV–vis reflectance spectroscopy was used to study the electron transfer rate,6−8 and Edmiston et al. utilized fluorescence spectroscopy to determine the molecular orientation when the protein was bound to a surface.9 Second-order harmonic spectroscopy has been used to determine the adsorption kinetics.10 Quartz crystal microbalance (QCM) and surface plasmon resonance (SPR) have also been used to study the electron transfer process of cytochrome c on a gold electrode modified with different self-assembled monolayers (SAMs).11
Vibrational spectroscopy is very powerful for characterization of the hydrogen bonding pattern and secondary structure of proteins and polypeptides. Ataka et al. studied cytochrome c on different SAM structures using surface-enhanced infrared absorption spectroscopy (SEIRAS).12 Spiro et al. attempted to provide complete assignment of cytochrome c through isotope labeling.13 A complicating factor is that cyt c possesses the unique characteristic that its backbone is strongly infrared-active but hardly detected using Raman spectroscopy, whereas the heme center is Raman-active but gives rise to a very weak infrared signal. Thus, the protein structure or conformational change cannot be entirely described by either technique alone, which sometimes has led to ambiguous conclusions that are still debated. Hence, both techniques, Raman and infrared, are complementary techniques as they reveal information about both the protein backbone and the redox center.
Two-dimensional (2D) correlation spectroscopy was first developed by Noda in 1989 and has triggered many research efforts.14−17 It utilizes a mathematical method to plot a series of dynamic spectra generated by external perturbation (temperature, time, potential, etc.) on a two-dimensional scale, hence generating two types of plots, namely, synchronous and asynchronous. This technique is advantageous because it can resolve overlapping peaks and provide information about the sequence of dipole reorientation/conformational change, etc. For example, Wu et al. utilized 2D IR spectroscopy to study the thermal unfolding of ribonuclease A upon reduction18 and Ozaki et al. used 2D Raman spectroscopy to study the molecular interaction between chemical components in pharmaceutical tablets.19 Heterospectral 2D IR–Raman analysis also has been investigated by Noda et al.20 for the study of N-methylacetamide. However, most of the 2D correlation studies have been used to explore the same structural segment of the molecule. To the best of our knowledge, the present work is the first attempt to apply 2D heterospectral correlation analysis to address different parts of the target protein, which is possible because of the special characteristics of cytochrome c stated above. Hetero 2D would allow us to correlate the changes in the infrared and Raman spectra. Additionally, combining IR and Raman spectroscopy allows us to probe the sequential pattern of the conformational changes in cyt c by applying the sequential rules of 2D correlation spectra. Molecular dynamics calculations are also performed to examine the interaction between the functional units probed by the hetero 2D correlation and to reveal details of intramolecular interactions.
2. Experimental Section
2.1. Materials
Gold(III) chloride trihydrate (AuCl3·3H2O, 99.999%), hydroxylamine hydrochloride (NH2OH HCl, 99%), cytochrome c from bovine heart, sodium perchlorate, 3-aminopropyltrimethoxysilane (APTMS), and 2-mercaptoethanol were purchased from Sigma-Aldrich. Dipotassium phosphate was purchased from Merck, Darmstadt. All chemicals were used without further purification.
2.2. Preparation of the Two-Layer Gold Film on a Silicon Surface
The samples were prepared using the optimal conditions described in our previous work.21 Briefly, a 30 nm gold film was deposited by electrothermal evaporation onto an attenuated total reflection (ATR) crystal after a thorough rinse with ethanol and sonication. To grow the second gold layer, the substrate was immersed in 50 mL of an aqueous solution containing 0.4 mM hydroxylamine hydrochloride to which 500 μL of an aqueous solution of gold(III) chloride trihydrate (0.3 mM) was added. After 2 min, an equivalent aliquot of the AuCl3 solution was added. This process was repeated five times such that the sample remained in the growth solution for a total of 10 min. The sample was removed from the growth solution, rinsed with water, and dried in a stream of nitrogen. Thereafter, the sample was immersed in an aqueous solution of 2-mercaptoethanol (ME) (1 mM) for 15 min and then rinsed with water. Subsequently, cyt c was adsorbed for 60 min using a solution of cyt c (0.35 mM) in PBS buffer (20 mM K2HPO4 and 10 mM NaClO4, pH 7).
2.3. Spectroelectrochemical Measurements
All electrochemical measurements were recorded in a homemade liquid cell using an Autolab instrument (PGSTAT302) equipped with an ECD module amplifier for low currents, an ADC750 module for rapid scan measurements, and a SCANGEN module for analog potential scanning (Eco Chemie, B.V., Utrecht, The Netherlands). All measurements were collected using a three-electrode configuration with the gold film as the working electrode, an Ag/AgCl, KClsat reference, and a platinum wire as the counter electrode. All electrode potentials are reported relative to the standard hydrogen electrode (SHE).
The IR measurements were performed as described previously.21 The spectroelectrochemical cell was mounted on top of a trapezoidal silicon ATR crystal required for a single reflection in the ATR spectroscopy mode. The IR beam of the FTIR spectrometer (VERTEX 70 FTIR spectrometer, Bruker, Karlsruhe, Germany) was coupled to a prism at an angle of incidence Θ = 60°. The total reflected beam IR intensity was measured using a photovoltaic mercury cadmium telluride (MCT) detector. For the static measurements, the mirror velocity was 120 kHz and the resolution was 4 cm–1; 1000 scans were collected for one spectrum during a measurement time of 10 min. All spectra were measured using parallel polarized light. The spectra were analyzed using the software package OPUS 6.5 (Bruker).
The Raman experiments were performed on the combined system of a WITec confocal Raman microscope using the 532 nm line of a Nd:YAG laser with circular polarization. It corresponds to the Q electronic transition of the heme. The laser beam was coupled to a confocal Raman microscope (Alpha 300, WITec) equipped with a water immersion objective (Nikon 60*, NA = 1.0, WD = 2.0). Thus, the laser beam was focused, and the scattered light was filtered by an edge filter and guided to the spectrometer (UHTS 300, WITec) by a 600 grooves/mm grating to provide the spectral resolution. The recorded spectrum was imaged onto a thermoelectrically cooled EMCCD detector (WITec). The Raman spectra were acquired using a 15 s integration time with a laser power density of 2.6 × 10⁶ W/cm2 with a spot size of ∼1 μm2. The surface-enhanced Raman spectroscopy (SERS) spectra were analyzed using the software packages WITec control 1.54 and WITec project 2.06.
2.4. 2D Correlation Calculations
The synchronous and asynchronous 2D plots of the infrared, Raman, and heterospectral correlations were calculated using the software 2D Shige (Shigeaki Morita, Kwansei-Gakuin University, Nishinomiya, Japan). The calculated data were replotted in Origin for better visualization. The color bar shows the different intensities of the 2D correlation peaks, which indicates the extent of correlation between x and y variables.
2.5. Molecular Dynamics (MD)
The simulations were based on the crystal structure of the oxidized form of bovine heart cytochrome c (PDB entry: 2B4Z) using the GROMOS1122 software and the GROMOS 54A723 force field. The crystal structure was modified by removing the covalent bond between the heme and His 18 and Met 80, while adding the thioether bridges to the heme vinyl groups through Cys 14 and Cys 17. The simulations of the reduced form used the same initial structure but different charge parameters on the heme. The GROMOS++24 package was used for simulation analysis. The dihedral-based secondary structure classification was based on the work of Hollingsworth et al.25 The precise simulation settings are described in the Supporting Information.
3. Results and Discussion
3.1. General Considerations
Cytochrome c is a small (12,000 Da) highly conserved protein that is found in viruses, plants, humans, etc. Its primary structure is made of 100 amino acids, though that found in many higher-order organisms consists of 104 amino acids. It is an important component in the electron transport chain and is loosely bound to the inner membrane of mitochondria. It consists of 5 α-helices, 2 β-strands, and some turn structures, which can be detected by infrared spectroscopy and assigned to specific portions of the protein.12
In our previous work, a two-layer gold surface was used to enhance the SEIRAS signal of adsorbed cyt c, and we found that a growth period of 10 min for the second gold layer provided optimal conditions.21 Identical surfaces were prepared for both the SEIRAS and SERS to ensure similar experimental conditions. As shown in Figure S1 (Supporting Information), the atomic force microscopy images clearly show that the initial surface is smooth, with an average roughness of 1.9 nm. After 10 min, the surface became rough because of the growth of a second layer of gold nanoparticles into islands and the average surface roughness increased to 6.9 nm. Such two-layer gold surfaces have been utilized before by our group in a 2D correlation study of cytochrome c oxidase and cytochrome c.26,27 The motivation of the present work is to advance the understanding of the interaction between the heme group and the surrounding protein backbone upon changing the electrode potential.
The two-layer gold surface was modified with 2-mercaptoethanol (ME) prior to adsorption of cyt c. Hydroxyl-terminated SAMs have been suggested to weakly affect the conformational characteristics of cyt c upon adsorption.12 Moreover, cyclic voltammetry data show that cyt c is successfully adsorbed onto the two-layer gold surface. The oxidation peak (cathodic peak) at 280 mV and the reduction peak (anodic peak) at 203 mV agree well with the previously reported values27 (Supporting Information, Figure S2).
The infrared difference spectra of cyt c have been studied before using this same methodology and surface architecture (Supporting Information, Figure S3).27 Detailed assignments can be found in Supporting Information, Table S2. The main infrared peaks and the corresponding assignments discussed in the text are summarized in Table 1. As the potential increases, the peaks at 1552 and 1658 cm–1 increase in intensity and one additional peak appears at 1672 cm–1. These peaks are characteristic for oxidized cyt c and correspond to the amide II band of a type III β-turn and the amide I band of a type II β-turn and/or α-helix and type III β-turn, respectively. Simultaneously, the peak at 1692 cm–1, corresponding to the amide I band of the type III β-turn (reduced state), decreases in intensity with increasing electrode potential (Supporting Information, Figure S3) and exhibits a sigmoid appearance (Supporting Information, Figure S4.) Taken together, the sigmoid appearance of the 1692 cm–1 intensity clearly indicates that cyt c undergoes a change from the reduced state to the oxidized state.
Table 1. Infrared Peaks and Corresponding Assignments As Discussed in the 2D Correlation Spectra12.
| reduced state (cm–1) | oxidized state (cm–1) | assignment | designation | residues |
|---|---|---|---|---|
| 1552 | amide II | β-turn type III | ||
| 1624 | amide I | extended β-strand | 37–40, 57–79 | |
| 1658 | amide I | β-turn type II and/or α-helix | 32–35, 35–38 | |
| 1672 | amide I | β-turn type III | 14–19, 67–70 | |
| 1692 | amide I | β-turn type III | 14–19, 67–70 |
For the SERS measurement, a 532 nm laser is used as the excitation source to match the Q electronic transition of the heme instead of the B band. This is preferred because the gold surface is used to achieve maximum signal enhancement. The SERS spectra show no obvious changes until +50 mV vs SHE, as can be observed in Figure 1. As the potential increases further, all of the peaks decrease in intensity except the ν10 peak at 1621 cm–1, which increases. The ν10 peak corresponds to the C–C asymmetric stretching mode, ν(Cα–Cm)asym. Sigmoid behavior is also observed for the 1364 cm–1 peak intensity, as shown in Figure 1 (inset). Again, this sigmoid curve shows that the redox transition can be followed by the spectral intensity change. Note that unspecific reorientation of the protein on the surface will not result in such sigmoid behavior.27 For detailed Raman peak assignment, we refer to the work of Spiro et al.13 and Supporting Information Table S1, which are in good agreement with the peaks found in our experiment. The selected peaks and their corresponding assignment as will be discussed in relation to the 2D correlation plots are shown in Table 2.
Figure 1.

Evolution of the SERS-active peaks with potential (from −100 to 500 mV vs SHE) for cytochrome c adsorbed to the 2-mercaptoethanol SAM-modified two-layer gold substrate. The black arrows are used to label the peaks that increase or decrease in intensity as the potential increases. (Inset: sigmoid behavior of intensity change of Raman peak at 1364 cm–1.)
Table 2. Raman Peaks and Corresponding Assignments As Discussed in the 2D Correlation Spectra13.

3.2. 2D IR
Overlapping peaks arising from different functional groups make it difficult to analyze the infrared peaks of cyt c, thus hindering accurate band assignments and reliable determination of the conformational changes of the protein. Second-derivative or Fourier deconvolution analyses have been applied to address this problem,28,29 but some of the findings and conclusions do not agree with the results from X-ray crystallography30 and NMR studies.5 Reaction-induced infrared difference spectroscopy also has been developed for both the bulk and the SAM layer of cyt c, and the ability to enhance the spectral resolution was demonstrated using an enzymatic reaction.12,31 The concept of the difference spectra suits the basis of 2D correlation spectroscopy, which also utilizes an external perturbation (light, voltage, etc.) to generate dynamic spectra for analysis. The use of 2D correlation spectroscopy spreads the spectrum in the second dimension and facilitates the deconvolution of overlapping peaks. Thus, it can help enhance the spectral resolution.32 Although vibrational features of different molecular origins may make similar contributions to the spectra in the static case, they may behave differently (either delayed or accelerated) in the case of a dynamic change. Such differences can be distinguished by 2D correlation. Thus, 2D correlation is an effective tool for the deconvolution of overlapping peaks.33
The synchronous and asynchronous 2D infrared correlation plots of cyt c were calculated using the 2D Shige software package from the series of one-dimensional (1D) IR spectra generated with stepwise increased potentials from −100 to +500 mV (Figure 2). The peaks that undergo changes in intensity result in correlation peaks in the 2D plots, whereas the peaks that remain constant result in no or very small correlation peaks. The autopeaks along the diagonal are all positive in a synchronous 2D IR plot (Figure 2A) and reveal the major peaks of the 1D infrared spectra. However, these peaks exhibit different degrees of intensity change during the potential increase. In the synchronous 2D IR plot, the intensity of the autopeak at 1692 cm–1 is more pronounced than that at 1658 cm–1 (Figure 2A), suggesting that the influence of the applied potential on the sequence of peptide groups responsible for the 1692 cm–1 autopeak is greater than that on the sequence responsible for the 1658 cm–1 autopeak. Examination of the IR peak assignment12 leads to the conclusion that the amide I band of the type II β-turn and/or α-helix (1658 cm–1) and the amide I band of the type III β-turn (1692 cm–1) originate from different regions of the protein backbone. Thus, different regions of the protein backbone can be probed by changing the applied potential, as revealed by the synchronous 2D IR plot.
Figure 2.
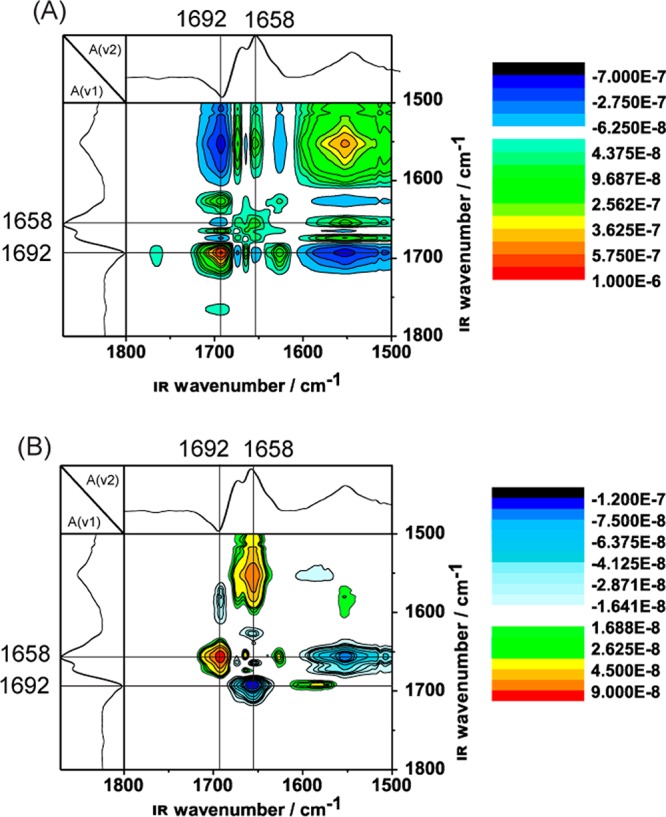
Synchronous (A) and asynchronous (B) 2D IR correlation plots from a SEIRAS analysis of cyt c adsorbed to a two-layer gold surface.
Cross peaks in the synchronous 2D IR plot are also indicative of modes with coupled or related origin. For example, the strong correlation peak at (1552 cm–1, 1692 cm–1) indicates that the spectral features at these two positions may be related and most likely belong to the same segments of the protein backbone (the type III β-turn; Table 1). The negative peak sign (dark blue), however, suggests that the peak intensities at the two positions change in different directions. The fact that one of them belongs to the reduced state and the other one to the oxidized state clearly suggests that the redox transition was successfully recorded.
The asynchronous plot (Figure 2B) provides additional useful information about the sequential relationship between the changes in intensity of peaks with different spectral origins, thus making it useful for peak deconvolution. The spectra in Figure 2B do not include any autopeaks, which is a distinct characteristic feature of an asynchronous 2D spectrum. We observed a strong negative cross peak at (1658 cm–1, 1692 cm–1) and a strong positive cross peak at (1692 cm–1, 1658 cm–1). Application of Noda’s rules for analyzing 2D correlation spectra16 reveals that the peptide groups corresponding to the amino acids in the type II β-turn and/or α-helix (represented by the peak at 1658 cm–1) change their conformation before those in the type III β-turn (represented by the peak at 1692 cm–1). Because the signal change of the amino residues represented by the IR peak at 1692 cm–1 occurred after those represented by the IR peak at 1658 cm–1, amino acids 14–19 and 67–70 may reorient to the surface first followed by those at positions 32–38 (Table 1). By comparing existing literature12 observations with our findings, we conclude that the changes seen in the 2D IR plots can be attributed to conformational changes within the protein backbone.
3.3. 2D Raman
Prior to the heterospectral 2D correlation analysis, the 2D Raman correlation spectra were calculated from the series of 1D Raman spectra at increasing potentials to probe the response of the Raman-active heme group. The synchronous 2D Raman correlation plot is shown in Figure 3. In addition to the positive autopeaks, most of the cross peaks were also positive, which indicates that all of the peak intensities decrease during the potential increase except for the peak at 1621 cm–1, which resulted in a negative peak in the 2D spectrum, indicating an increase in intensity. This synchronous 2D Raman correlation agrees well with the observations from the 1D Raman spectra (Figure 1).
Figure 3.

Synchronous 2D Raman correlation plot from the SERS spectra of cyt c on gold.
According to the peak assignment by Spiro et al.,13 the Raman peaks at 1397 and 1587 cm–1 correspond to vibrational modes of the pyrrole quarter ring and the C–C bond, respectively (Table 2). The pyrrole quarter ring is located next to the iron center of the heme, whereas the C–C bond is located further from the heme center. As can be observed from the synchronous 2D Raman correlation spectrum, the peak intensity of the 1587 cm–1 autopeak is much more pronounced than that of the autopeak at 1397 cm–1. This observation indicates that the correlation to the change in potential of the ν(Cα–Cm)asym mode (corresponding to the peak at 1587 cm–1) is stronger than that of the ν(pyrrole quarter ring) mode (corresponding to the peak at 1397 cm–1). This is in agreement with the literature34 and our MD simulation, suggesting that the heme unit is prone to reorient (bend upward or downward) with the applied potential. Hence the ν(Cα–Cm)asym mode is, as expected, more sensitive to conformational changes than the ν(pyrrole quarter ring) mode. The two peripheral propionic acid groups, which are parts of the heme structure, also can establish strong interactions with neighboring amino acid residues via hydrogen bond/electrostatic interaction. Thus, different modes respond differently to applied potential because of changes in the local environment.
The asynchronous 2D Raman correlation plot, in contrast, does not exhibit significant peaks. Instead, the signals appear within the noise level (Supporting Information, Figure S5). The lack of significant features is most likely due to the fact that the corresponding peaks may exhibit frequency shifts in addition to pure intensity changes. This induces noise in the 2D spectra. The sensitivity to noise of asynchronous correlation analysis is typically greater than that of synchronous analysis.33
According to Noda,16 the asynchronous correlation intensity vanishes when all reorientations of the two dipole–momentum transitions occur in phase with the external perturbation. Hence, all Raman-active regions of cyt c are expected to react at the same rate following a potential perturbation because of the rigid structure of the heme center. This is consistent with the conclusion that the bonding distance between the six ligands with the heme center iron ion does not change during the redox process, as revealed by recent X-ray investigations.30,35
3.4. Hetero 2D
Thus far, only autologous IR- or Raman-active modes have been correlated. We introduce also a heterospectral correlation analysis of the infrared and Raman spectra representing different parts of the protein. Such 2D spectra combining these two complementary techniques could serve as a visual aid to help describe more completely the conformational change of cyt c during the redox process. The synchronous and asynchronous 2D heterospectral correlation plots are again calculated using the 2D Shige software, and the result is shown in Figure 4. The infrared frequency is plotted on the x-axis, and the Raman shift on the y-axis, which makes the coordinate system (IR peak position, Raman peak position) in the hetero 2D plot. These 2D heterospectral correlation plots are no longer symmetrical about the diagonal line, which is in contrast to the autologous IR–IR or Raman–Raman 2D spectra. Hence, all peaks had to be interpreted as cross correlation peaks.36
Figure 4.
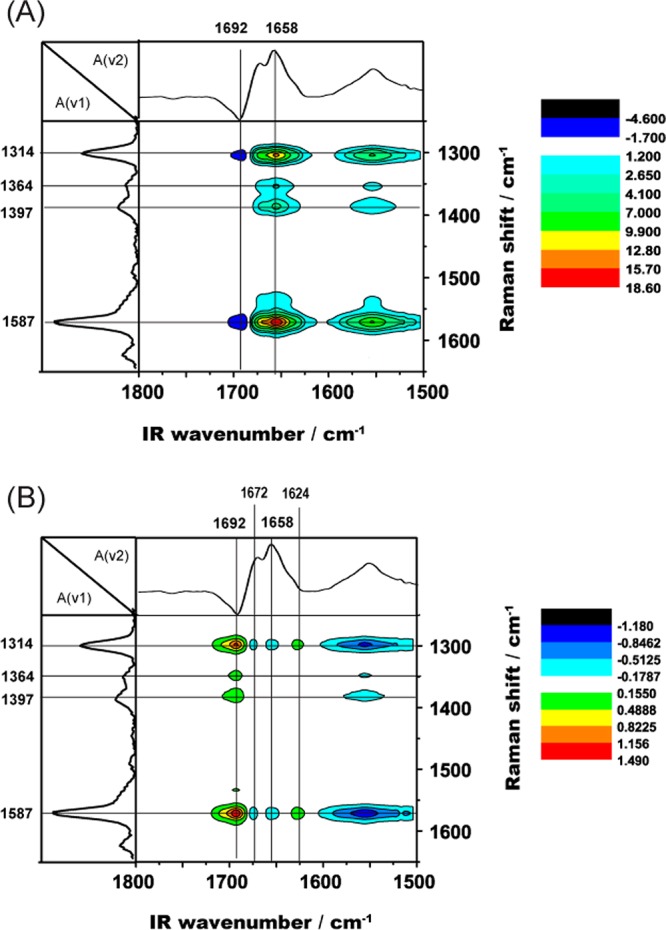
Synchronous (A) and asynchronous (B) 2D heterospectral correlation plots generated from the SEIRAS and SERS dynamic spectra of cyt c on gold.
The synchronous 2D heterospectral correlation plot (Figure 4A) shows that the infrared peak at 1658 cm–1 forms strong positive peaks with the main Raman peaks and that the strongest peaks are formed with the Raman peaks at 1314 and 1587 cm–1. There are also positive peaks formed under the IR peak at 1552 cm–1 with these Raman peaks. For the correlation under the peak at 1692 cm–1, two negative peaks are observed, which are not on the same scale as the positive peaks.
As mentioned before, an examination of the band assignments suggests that the IR peaks at 1692 and 1552 cm–1 both can be attributed to the type III β-turn, with the 1692 cm–1 peak corresponding to the reduced state and the 1552 cm–1 peak to the oxidized state. During the potential change from −100 to +500 mV vs SHE, cyt c undergoes a redox change from the fully reduced state to the fully oxidized state, which is reflected well in the synchronous 2D heterospectral correlation plot by the negative sign of the correlation peak. The IR peak at 1658 cm–1 corresponding to the type II β-turn and/or α-helix in the oxidized state involves residues 32–38. These residues can interact directly with the propionate groups of cyt c and thereby exhibit a strong correlation with the heme during the redox process. The different intensities of the correlation peaks also indicated a large extent of reorientation.
Interestingly, the 1692 cm–1 peak, which corresponds to the amino acids near His 18 that is ligated to the heme iron, resulted in correlation peaks smaller than those at 1658 cm–1. A possible interpretation of these data could be that the strong coupling between His 18 and the heme prevents the two moieties from changing configuration and/or reorienting. In contrast, the residues associated with the propionate groups have more freedom to move, inducing more reorientation during the redox process. The correlation peaks between the IR peak at 1692 cm–1 (corresponding to amino acids 14–19, including His 18) with the Raman peaks are either absent or very weak. On the other hand, the correlation peaks between the IR peak at 1658 cm–1 are strong in intensity and show different peak sign compared to the peaks under the IR peak at 1692 cm–1. This indicates a different coupling mechanism between the contributing amino acid residues and the heme center.
The asynchronous 2D heterospectral correlation plot is shown in Figure 4B. We assume that the general rules developed by Noda are valid for all kinds of 2D correlation methods and can be applied to our data as described in the following. The sign of the asynchronous 2D heterospectral correlation peak is positive at (1692 cm–1, 1587 cm–1), whereas the sign of the peaks at the same position in the synchronous hetero 2D plot indicates that the sequential relationship for this set of data must be inverted.16 Thus, application of Noda’s rules to the hetero 2D plots indicates that the residues represented by the IR peak at 1692 cm–1 would reorient after the heme, which is represented by the Raman peak at 1587 cm–1. This analysis allows us to visualize the dynamics of the redox process of cyt c as follows: the heme moiety first undergoes a conformational change because it directly coordinates to the iron ion involved in the redox process. This is followed by a reorientation of the His 18 residue that is ligated to the heme iron.
We also observed two additional peaks in the asynchronous 2D heterospectral correlation plot at (1692 cm–1, 1364 cm–1) and (1692 cm–1, 1397 cm–1), which are absent in the synchronous 2D heterospectral correlation plot. On the basis of the peak assignment (Supporting Information, Table S1), the Raman peaks at 1364 and 1397 cm–1 correspond to the stretching modes of ν(pyrrole half ring)sym and ν(pyrrole quarter ring), respectively. On the basis of these findings, we propose that upon oxidation the heme undergoes a vibrational change that reflects a change in the distance between the pyrrole group and His 18. In addition to the described findings, we can show with the help of MD calculations that there is stronger coupling between the heme structure and the protein backbone (Supporting Information, Figure S6).
The broad synchronous peak at (1658 cm–1, 1314 cm–1) is split into three separate peaks in the asynchronous plot at 1624, 1658, and 1672 cm–1 because they are of different origins and display different sequential interactions with the applied external potential. Again, these IR peaks correspond to the amide I bands of the extended β-strand (1624 cm–1), the type II β-turn and/or α-helix (1658 cm–1), and the type III β-turn (1672 cm–1). A similar splitting behavior can be observed with the Raman peak at 1587 cm–1, but not with the Raman peaks at 1364 and 1397 cm–1. A closer examination of the Raman vibrational mode assignments (Table 2) reveals that the peaks showing splitting (1314 and 1587 cm–1) correspond to the pyrrole side chain, while those showing no splitting (1364 and 1397 cm–1) correspond to pyrrole half-ring and quarter-ring vibrations, respectively. This clearly shows that asynchronous 2D heterospectral correlation analysis can be used to deconvolute overlapping peaks originating from segments of different rigidity, molecular environments, etc.
The potential-dependent response for amino acids 14–19 and 67–70, as represented by the infrared peak at 1692 cm–1, is out of phase with the heme center, as shown from the strong hetero-asynchronous correlation between the IR peak at 1692 cm–1 and all the Raman peaks. The same conclusions can be drawn from the strong correlation between the Raman peaks at 1314 and 1587 cm–1 and all the infrared peaks in the amide I region. This indicates that the conformation change of these two Raman vibrational modes is out of phase with those represented by the infrared amide I peaks. The amide II peak at 1552 cm–1 and the amide I peak at 1692 cm–1 are assigned to the same amino acids, but they represent different redox states. That is why they exhibit the same degree of asynchronous change but in different directions.
The correlation peaks between the IR peak at 1692 cm–1 and the Raman peaks, which are weak or absent from the synchronous spectra, increase in intensity in the asynchronous spectra. On the other hand, the correlation peaks between the IR peak at 1658 cm–1 and the Raman peaks, which are strong and positive in the synchronous spectra, disappear or become weak in the asynchronous spectra. This could indicate a change in the bond angle between the two axial ligands His 18 and Met 80 as well as a position shift of the propionate group, as the different correlations may indicate a change of relative positions. This is consistent with the findings of XRD and NMR studies.30,35,37
3.5. Molecular Dynamics
To confirm our observations and conclusions, molecular dynamics simulations were also performed. Because there are no prominent changes seen in the overall secondary structure associated with the oxidation, the secondary structure dynamics for each residue are examined. The amount of time each residue spent in a particular secondary structure class was determined for both the oxidized and reduced forms. Those residues for which this time varied by at least 5% (or less if they were close to a previously monitored residue) are collected in Table S3 (Supporting Information). The residue assignments from the 2D heterospectral correlation spectroscopic analysis are consistent with the residues that experienced a change in their secondary structure assignments or interaction dynamics with the heme propionates (Figure 5).
Figure 5.

(A) Amino acids with changed secondary structure dynamics (orange) and heme hydrogen bonding (purple) based on MD simulations. (B) Amino acids in the amide I region detected using 2D SEIRAS and associated with the IR peaks at 1658 cm–1 (blue), 1692 cm–1 (red), and 1624 cm–1 (yellow). Green portions are unmarked, and the heme is shown in gray, oxygen in red, and nitrogen in blue.
The simulations show a decreased amount of time spent in the β-turn type III structure, including residues 14–17 (−7%) and 67–69 (−7%), during oxidation of the protein, which agrees well with the assigned peaks at 1692 and 1552 cm–1 (Supporting Information, Table S2). An unassigned region of residues 52–55 took up the β-turn type III at an increased proportion (+10%), as shown in Supporting Information, Table S3. This region was also identified as changing upon oxidation in horse heart cyt c.8 In our simulations, it is associated with propionate hydrogen bonding/electrostatic interactions (Supporting Information, Table S4) rather than with direct interaction through His 18 or Met 80, as is the case with the other two regions. This is also reflected in the asynchronous hetero 2D plot shown in Figure 4B in which the helix structure differs from the β-turn structure in the molecular environment. Hence, they can be distinguished by combining the hetero 2D analysis and MD simulation.
The IR peak at 1658 cm–1 is assigned to a β-turn type II and/or α-helix structure and to the two consecutive turns at residues 32–35 and 35–38.8 Both turns are observed during the MD simulations, but the change in secondary structure is very small (3% and 6%, respectively) upon oxidation, which is in good agreement with NMR and X-ray observations. On the other hand, the turns changed H-bonding dynamics with the heme (Arg 38) and established important hydrogen bond interactions with the regions 14–19 and 21–23 (Asn 31).
Additionally, the distances of the heme and His 18 were also monitored in the different oxidation states (Supporting Information, Figure S6). Although the average distance changes only slightly, the smaller charge of the reduced heme center allowed for more fluctuations, in good agreement with the stronger coupling observed in the hetero 2D correlation analysis.
4. Conclusions
We have successfully performed a 2D correlation analysis upon changing the redox state of cyt c adsorbed on a two-layer gold surface. 2D infrared correlation and 2D Raman correlation spectroscopies were performed to enhance spectral resolution and to provide a deeper understanding of the sequential changes occurring in the various portions of the protein.
Specifically, we have performed three types of correlation analysis, namely, autologous IR vs IR, Raman vs Raman, and heterologous IR vs Raman. Our data indicate that different segments of the protein respond differently to changes in the electrode potential and reorient sequentially. For example, it is found that the heme groups reoriented and changed conformation/interactions prior to the rest of the protein backbone. Some features that are not readily observed in the 1D spectra can be distinguished using a 2D correlation analysis. Peaks arising from different spectral origins or different molecular environments can be differentiated by their dynamic change under an external perturbation. Thus, the oxidation of cytochrome c can be readily monitored using 2D correlation analysis. There is also a good agreement between the results of the 2D analysis and the molecular dynamics simulations, e.g., the distance between the His 18 and the heme is reflected in the 2D correlation spectra and reveals the conformation change of the protein.
These findings are remarkable because they show a clear fragmentation of sequential order, which indicates that the conformational changes induced by the oxidation occurred at different rates for different parts of the protein backbone. The example of a well-studied system, such as cyt c, has effectively demonstrated the potential of 2D heterospectral correlation spectroscopy for further applications on more complex membrane redox proteins.
Acknowledgments
The research was supported under the Austrian Federal Ministry for Transport, Innovation and Technology (GZ BMVIT-612.166/0001-III/I1/2010) and by the International Graduate School Bio-Nano-Tech, a joint Ph.D. program of the University of Natural Resources and Life Sciences Vienna (BOKU), the Austrian Institute of Technology (AIT), and the Nanyang Technological University (NTU). Partial support for this work was provided by ZIT, Center of Innovation and Technology of Vienna. Financial support from Grant LS08-QM3 of the Vienna Science and Technology Fund (WWTF, C.O.) and the “BioToP: Biomolecular Technology of Proteins” Ph.D. Programme (Austrian Science Fund, FWF Project W1224, G.N.) is also gratefully acknowledged. B.L. and X.C. acknowledge financial support from the Science & Engineering Research Council (SERC) of the Agency for Science, Technology and Research (A*STAR), Project 102 152 0015.
Supporting Information Available
AFM, CV, IR, band assignment, and simulation data. This material is available free of charge via the Internet at http://pubs.acs.org.
The authors declare no competing financial interest.
Supplementary Material
References
- Fedurco M. Redox Reactions of Heme-Containing Metalloproteins: Dynamic Effects of Self-Assembled Monolayers on Thermodynamics and Kinetics of Cytochrome c Electron-Transfer Reactions. Coord. Chem. Rev. 2000, 209, 263–331. [Google Scholar]
- Page C. C.; Moser C. C.; Chen X.; Dutton P. L. Natural Engineering Principles of Electron Tunnelling in Biological Oxidation-Reduction. Nature 1999, 402, 47–52. [DOI] [PubMed] [Google Scholar]
- Willner I.; Katz E. Integration of Layered Redox Proteins and Conductive Supports for Bioelectronic Applications. Angew. Chem., Int. Ed. 2000, 39, 1180–1218. [DOI] [PubMed] [Google Scholar]
- Banci L.; Bertini I.; Gray H. B.; Luchinat C.; Reddig T.; Rosato A.; Turano P. Solution Structure of Oxidized Horse Heart Cytochrome c. Biochemistry 1997, 36, 9867–9877. [DOI] [PubMed] [Google Scholar]
- Bushnell G. W.; Louie G. V.; Brayer G. D. High-Resolution Three-Dimensional Structure of Horse Heart Cytochrome c. J. Mol. Biol. 1990, 214, 585–595. [DOI] [PubMed] [Google Scholar]
- Niki K.; Hardy W. R.; Hill M. G.; Li H.; Sprinkle J. R.; Margoliash E.; Fujita K.; Tanimura R.; Nakamura N.; Ohno H.; et al. Coupling to Lysine-13 Promotes Electron Tunneling through Carboxylate-Terminated Alkanethiol Self-Assembled Monolayers to Cytochrome c. J. Phys. Chem. B 2003, 107, 9947–9949. [Google Scholar]
- Avila A.; Gregory B. W.; Niki K.; Cotton T. M. An Electrochemical Approach to Investigate Gated Electron Transfer Using a Physiological Model System: Cytochrome c Immobilized on Carboxylic Acid-Terminated Alkanethiol Self-Assembled Monolayers on Gold Electrodes. J. Phys. Chem. B 2000, 104, 2759–2766. [Google Scholar]
- Feng Z. Q.; Imabayashi S.; Kakiuchi T.; Niki K. Long-Range Electron-Transfer Reaction Rates to Cytochrome c Across Long- and Short-Chain Alkanethiol Self-Assembled Monolayers: Electroreflectance Studies. J. Chem. Soc., Faraday Trans. 1997, 93, 1367–1370. [Google Scholar]
- Edmiston P. L.; Lee J. E.; Cheng S.-S.; Saavedra S. S. Molecular Orientation Distributions in Protein Films. 1. Cytochrome c Adsorbed to Substrates of Variable Surface Chemistry. J. Am. Chem. Soc. 1997, 119, 560–570. [Google Scholar]
- Salafsky J. S.; Eisenthal K. B. Protein Adsorption at Interfaces Detected by Second Harmonic Generation. J. Phys. Chem. B 2000, 104, 7752–7755. [Google Scholar]
- Paulo T. d. F.; de Sousa T. P.; de Abreu D. S.; Felício N. H.; Bernhardt P. V.; de F. Lopes L. G.; Sousa E. H. S.; Diógenes I. C. N. Electrochemistry, Surface Plasmon Resonance, and Quartz Crystal Microbalance: An Associative Study on Cytochrome c Adsorption on Pyridine Tail-Group Monolayers on Gold. J. Phys. Chem. B 2013, 117, 8673–8680. [DOI] [PubMed] [Google Scholar]
- Ataka K.; Heberle J. Functional Vibrational Spectroscopy of a Cytochrome c Monolayer: SEIDAS Probes the Interaction with Different Surface-Modified Electrodes. J. Am. Chem. Soc. 2004, 126, 9445–9457. [DOI] [PubMed] [Google Scholar]
- Hu S.; Morris I. K.; Singh J. P.; Smith K. M.; Spiro T. G. Complete Assignment of Cytochrome c Resonance Raman Spectra Via Enzymic Reconstitution with Isotopically Labeled Hemes. J. Am. Chem. Soc. 1993, 115, 12446–12458. [Google Scholar]
- Noda I. Two-Dimensional Infrared Spectroscopy. J. Am. Chem. Soc. 1989, 111, 8116–8118. [Google Scholar]
- Noda I. Two-Dimensional Infrared (2D IR) Spectroscopy: Theory and Applications. Appl. Spectrosc. 1990, 44, 550–561. [Google Scholar]
- Noda I. Generalized Two-Dimensional Correlation Method Applicable to Infrared, Raman, and Other Types of Spectroscopy. Appl. Spectrosc. 1993, 47, 1329–1336. [Google Scholar]
- Noda I. Two-Dimensional Correlation Spectroscopy—Biannual Survey 2007–2009. J. Mol. Struct. 2010, 974, 3–24. [Google Scholar]
- Wang L.-X.; Meersman F.; Wu Y. A Principal Component Analysis and Two-Dimensional Correlation Infrared Spectroscopy Study on the Thermal Unfolding of Ribonuclease A under Reducing Conditions. J. Mol. Struct. 2008, 883–884, 79–84. [Google Scholar]
- Shinzawa H.; Awa K.; Okumura T.; Morita S.-i.; Otsuka M.; Ozaki Y.; Sato H. Raman Imaging Analysis of Pharmaceutical Tablets by Two-Dimensional (2D) Correlation Spectroscopy. Vib. Spectrosc. 2009, 51, 125–131. [Google Scholar]
- Noda I.; Liu Y.; Ozaki Y. Two-Dimensional Correlation Spectroscopy Study of Temperature-Dependent Spectral Variations of N-Methylacetamide in the Pure Liquid State. 2. Two-Dimensional Raman and Infrared–Raman Heterospectral Analysis. J. Phys. Chem. 1996, 100, 8674–8680. [Google Scholar]
- Nowak C.; Luening C.; Knoll W.; Naumann R. L. C. A Two-Layer Gold Surface with Improved Surface Enhancement for Spectro-Electrochemistry Using Surface-Enhanced Infrared Absorption Spectroscopy. Appl. Spectrosc. 2009, 63, 1068–1074. [DOI] [PubMed] [Google Scholar]
- Schmid N.; Christ C. D.; Christen M.; Eichenberger A. P.; van Gunsteren W. F. Architecture, Implementation and Parallelisation of the GROMOS Software for Biomolecular Simulation. Comput. Phys. Commun. 2012, 183, 890–903. [Google Scholar]
- Schmid N.; Eichenberger A. P.; Choutko A.; Riniker S.; Winger M.; Mark A. E.; van Gunsteren W. F. Definition and Testing of the GROMOS Force-Field Versions 54a7 and 54b7. Eur. Biophys. J. Biophys. Lett. 2011, 40, 843–856. [DOI] [PubMed] [Google Scholar]
- Eichenberger A. P.; Allison J. R.; Dolenc J.; Geerke D. P.; Horta B. A. C.; Meier K.; Oostenbrink C.; Schmid N.; Steiner D.; Wang D.; et al. GROMOS++ Software for the Analysis of Biomolecular Simulation Trajectories. J. Chem. Theory Comput. 2011, 7, 3379–3390. [DOI] [PubMed] [Google Scholar]
- Hollingsworth S. A.; Lewis M. C.; Berkholz D. S.; Wong W.-K.; Karplus P. A. (φ,ψ)2 Motifs: A Purely Conformation-Based Fine-Grained Enumeration of Protein Parts at the Two-Residue Level. J. Mol. Biol. 2012, 416, 78–93. [DOI] [PMC free article] [PubMed] [Google Scholar]
- Nowak C.; Laredo T.; Gebert J.; Lipkowski J.; Gennis R. B.; Ferguson-Miller S.; Knoll W.; Naumann R. L. C. 2D-SEIRAS Spectroscopy to Highlight Conformational Changes of the Cytochrome c Oxidase Induced by Direct Electron Transfer. Metallomics 2011, 3, 619–627. [DOI] [PMC free article] [PubMed] [Google Scholar]
- Nowak C.; Luening C.; Schach D.; Baurecht D.; Knoll W.; Naumann R. L. C. Electron Transfer Kinetics of Cytochrome c in the Submillisecond Time Regime Using Time-Resolved Surface-Enhanced Infrared Absorption Spectroscopy. J. Phys. Chem. C 2009, 113, 2256–2262. [Google Scholar]
- Dong A.; Huang P.; Caughey W. S. Redox-Dependent Changes in β-Extended Chain and Turn Structures of Cytochrome c in Water Solution Determined by Second Derivative Amide I Infrared Spectra. Biochemistry 1992, 31, 182–189. [DOI] [PubMed] [Google Scholar]
- Surewicz W. K.; Mantsch H. H.; Chapman D. Determination of Protein Secondary Structure by Fourier Transform Infrared Spectroscopy: A Critical Assessment. Biochemistry 1993, 32, 389–394. [DOI] [PubMed] [Google Scholar]
- Takano T.; Dickerson R. E. Conformation Change of Cytochrome c: I. Ferrocytochrome c Structure Refined at 1.5 Å Resolution. J. Mol. Biol. 1981, 153, 79–94. [DOI] [PubMed] [Google Scholar]
- Moss D.; Nabedryk E.; Breton J.; Mäntele W. Redox-Linked Conformational Changes in Proteins Detected by a Combination of Infrared Spectroscopy and Protein Electrochemistry. Eur. J. Biochem. 1990, 187, 565–572. [DOI] [PubMed] [Google Scholar]
- Noda I.; Dowrey A. E.; Marcott C.; Story G. M.; Ozaki Y. Generalized Two-Dimensional Correlation Spectroscopy. Appl. Spectrosc. 2000, 54, 236A–248A. [Google Scholar]
- Noda I.; Ozaki Y.. Two-Dimensional Correlation Spectroscopy: Applications in Vibrational and Optical Spectroscopy; John Wiley & Sons: Chichester, U.K., 2004. [Google Scholar]
- Abel S.; Waks M.; Marchi M. Molecular Dynamics Simulations of Cytochrome c Unfolding in AOT Reverse Micelles: The First Steps. Eur. Phys. J. E: Soft Matter Biol. Phys. 2010, 32, 399–409. [DOI] [PubMed] [Google Scholar]
- Takano T.; Dickerson R. E. Conformation Change of Cytochrome c: II. Ferricytochrome c Refinement at 1.8 Å and Comparison with the Ferrocytochrome Structure. J. Mol. Biol. 1981, 153, 95–115. [DOI] [PubMed] [Google Scholar]
- Jung Y. M.; Czarnik-Matusewicz B.; Ozaki Y. Two-Dimensional Infrared, Two-Dimensional Raman, and Two-Dimensional Infrared and Raman Heterospectral Correlation Studies of Secondary Structure of β-Lactoglobulin in Buffer Solutions. J. Phys. Chem. B 2000, 104, 7812–7817. [Google Scholar]
- Feng Y.; Roder H.; Englander S. W. Redox-Dependent Structure Change and Hyperfine Nuclear Magnetic Resonance Shifts in Cytochrome c. Biochemistry 1990, 29, 3494–3504. [DOI] [PubMed] [Google Scholar]
Associated Data
This section collects any data citations, data availability statements, or supplementary materials included in this article.