Abstract
Background
Fitness-to-drive guidelines recommend employing the Trail Making B Test (a.k.a. Trails B), but do not provide guidance regarding cut-off scores. There is ongoing debate regarding the optimal cut-off score on the Trails B test.
The objective of this study was to address this controversy by systematically reviewing the evidence for specific Trails B cut-off scores (e.g., cut-offs in both time to completion and number of errors) with respect to fitness-to-drive.
Methods
Systematic review of all prospective cohort, retrospective cohort, case-control, correlation, and cross-sectional studies reporting the ability of the Trails B to predict driving safety that were published in English-language, peer-reviewed journals.
Results
Forty-seven articles were reviewed. None of the articles justified sample sizes via formal calculations. Cut-off scores reported based on research include: 90 seconds, 133 seconds, 147 seconds, 180 seconds, and < 3 errors.
Conclusions
There is support for the previously published Trails B cut-offs of 3 minutes or 3 errors (the ‘3 or 3 rule’). Major methodological limitations of this body of research were uncovered including (1) lack of justification of sample size leaving studies open to Type II error (i.e., false negative findings), and (2) excessive focus on associations rather than clinically useful cut-off scores.
Keywords: Trail Making Test, Trails B, driving, fitness-to-drive, cut-off
INTRODUCTION
Physicians in most Canadian jurisdictions are legally mandated to report medical findings that could impact on fitness-to-drive (http://www.cma.ca/driversguide).(1) Even where reporting is not mandatory, physicians can still potentially be found liable if they fail to report a patient who harms others due to a car crash attributed to their medical impairments.(2) On a more positive note, the reporting of medical findings that could impact on fitness-to-drive also represents an opportunity to fulfill an important societal role; assessments of fitness-to-drive allow physicians to help their patients avoid disabling injury or death and also to help patients and their families avoid the grief and legal repercussions associated with contributing to the injuries or deaths of other road users or bystanders.(2)
Driving guidelines such as those of the Canadian Medical Association, the Canadian Council of Motor Transport Administrators, the Driver and Vehicle Licensing Agency in the United Kingdom, and the American Medical Association recommend the Trail Making B Test (a.k.a. Trails B) to assess fitness-to-drive.(1,3,4,5) Trails B tests dual attention (cognitive flexibility in switching attention between two competing static sets of stimuli which is a much lower level of cognitive demand than switching between multiple moving stimuli encountered when driving) and executive function. Driving represents a “super-Instrumental Activity of Daily Living (super-IADL)” or “super-executive function” that can result in death if performed incorrectly or too slowly—this, along with the risk to others, makes it unique among IADLs or executive functions. Unfortunately, guidelines rarely advise physicians regarding which Trails B findings indicate unfitness-to-drive.
A study by Tombaugh(6) of the normative values of the Trails B test demonstrated that the mean time to complete Trails B is < 180 seconds for all age groups. There were some outliers whose scores exceeded 180 seconds; the lowest 20th percentile in the 80 to 84 age group and the lowest 30th percentile in the 85 to 89 age group, but the validity of the latter findings is questionable given the small sample size in these age-specific cells. It is also possible that some of these findings do not represent true normative values (i.e., values for persons without diseases or drugs affecting the results), but may represent hidden disease or hidden medication effects.(7) Even if these are true norms for healthy people, being in a normative range may not necessarily mean the patient is safe to drive. We have to accept reality—as people get older, they do not have more time to stop their cars or to respond to emergencies. Physical laws do not change according to age. We must, therefore, remain very skeptical of age-adjusted norms for tests used to screen for fitness-to-drive.(7)
Continuing medical education articles have recommended a Trails B cut-off of 180 seconds or three errors (i.e., 3 minutes or 3 errors; the ‘3 or 3 rule’).(2,7,8) Given the findings of Tombaugh,(6) indicating the scores of the lowest 20th percentile in the 80 to 84 year-old group and the lowest 30th percentile in the 85 to 89 year-old group exceeded 180 seconds, some have recommended caution in employing a strict 180 second cut-off. There is ongoing debate in the field of research into the evaluation of fitness-to-drive regarding the optimal cut-off score on the Trails B test.
The objective of this study was to address this controversy by systematically reviewing the evidence for specific Trails B cut-off scores (e.g., cut-offs in both time to completion and number of errors) with respect to fitness-to-drive.
METHODS
This systematic review was conducted in accordance with the process and methods recommended by the Preferred Reporting Items for Systematic Reviews and Meta-Analyses (PRISMA) guidelines.(9)
The need for ethics approval was waived for this study by the Ottawa Hospital Research Ethics Board, as it only involved a literature search.
Literature Search
An electronic literature search was conducted using CINAHL, Cochrane Database of Systematic Reviews, EMBASE, MEDLINE, PsycINFO, PubMed, and Scopus databases for all relevant English-language publications. No starting date restriction was used in this search. The most updated search was conducted in November 2012. Relevant articles were retrieved using the following subject headings and keywords in various combinations: Trail Making Test, Trail Making Test B, Trail Making B, Trail Making Test Part B, Trail Making Test A and B, Trail Making Test Parts A & B, Trail Making Test Parts A and B, Trails B, TMT, TMT-B, drive/driving/driver, auto/automobile, car, vehicle/motor vehicle, accident, traffic, crash, collision, MVA and MVC. This electronic search was supplemented by hand searching of the reference lists of selected articles, meta-analyses, and review articles.
Inclusion and Exclusion Criteria
All prospective cohort, retrospective cohort, case-control, correlation, and cross-sectional studies reporting the ability of the Trails B test (i.e., the standard Arabic numerals version employing numbers 1–13 and letters A–L) to predict driving safety were included.
The systematic review was restricted to articles presenting original research findings published in English-language, peer-reviewed journals. Reviews, meta-analyses, commentaries, editorials, consensus statements, and guidelines were searched for references, but were not included in the systematic review.
Data Extraction
Data extraction forms included publication details, investigative site locations, source of participants, design type, sample size, whether power and sample size calculations were provided, age of participants, diseases included (e.g., Alzheimer’s Disease, Parkinson’s Disease, stroke, traumatic or anoxic brain injury etc.), method of evaluating driving safety (e.g., simulator, on-road, questionnaire, record of crashes), reported associations of Trails B with predicting driving safety, whether a cut-off was reported for Trails B, and source of reported cut-off (study analysis or reference).
Two investigators (MR, FM) independently extracted data from all included studies, and then met to identify and discuss discrepancies in extracted data. Disagreements between the reviewers were discussed and a consensus agreement was reached.
Since Trails B is not routinely employed as part of a multivariate equation in clinical practice, we focused on univariate associations (i.e., the score of the Trails B in isolation, not as part of a multivariate equation).
RESULTS
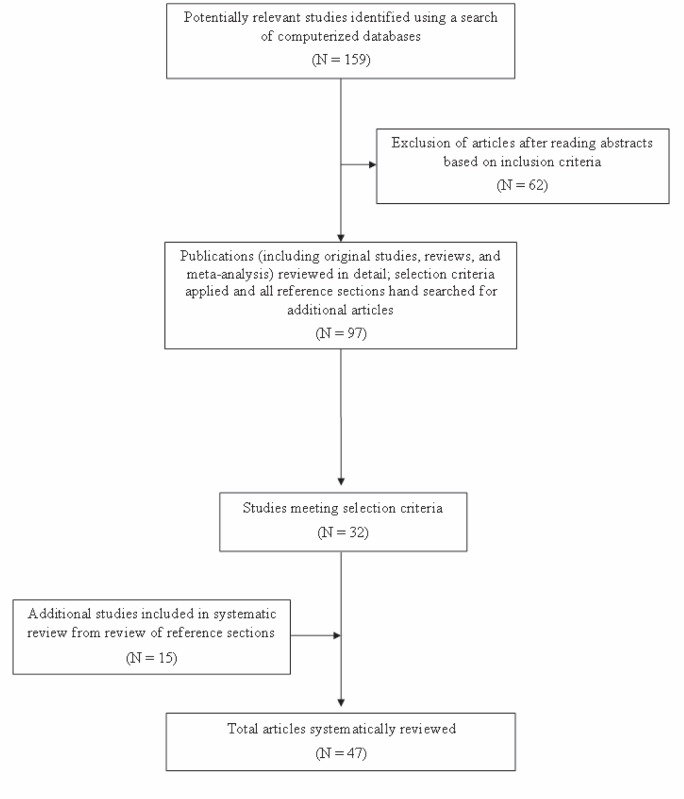
Figure 1 illustrates the process of selection of articles for the systematic review. After reviewing 97 articles in detail, including a hand search of the reference sections, a total of 47 articles met the inclusion criteria to be systematically reviewed. Study characteristics are presented in Table 1. The primary outcome (i.e., measures of driving safety) was history of crash (reported or recorded) for 10 (21.3%) studies, simulator test score for 10 (21.3%) studies, and on-road assessment for 27 (57.4%) studies.
FIGURE 1.
Article selection flow diagram
TABLE 1.
Characteristics of included studies
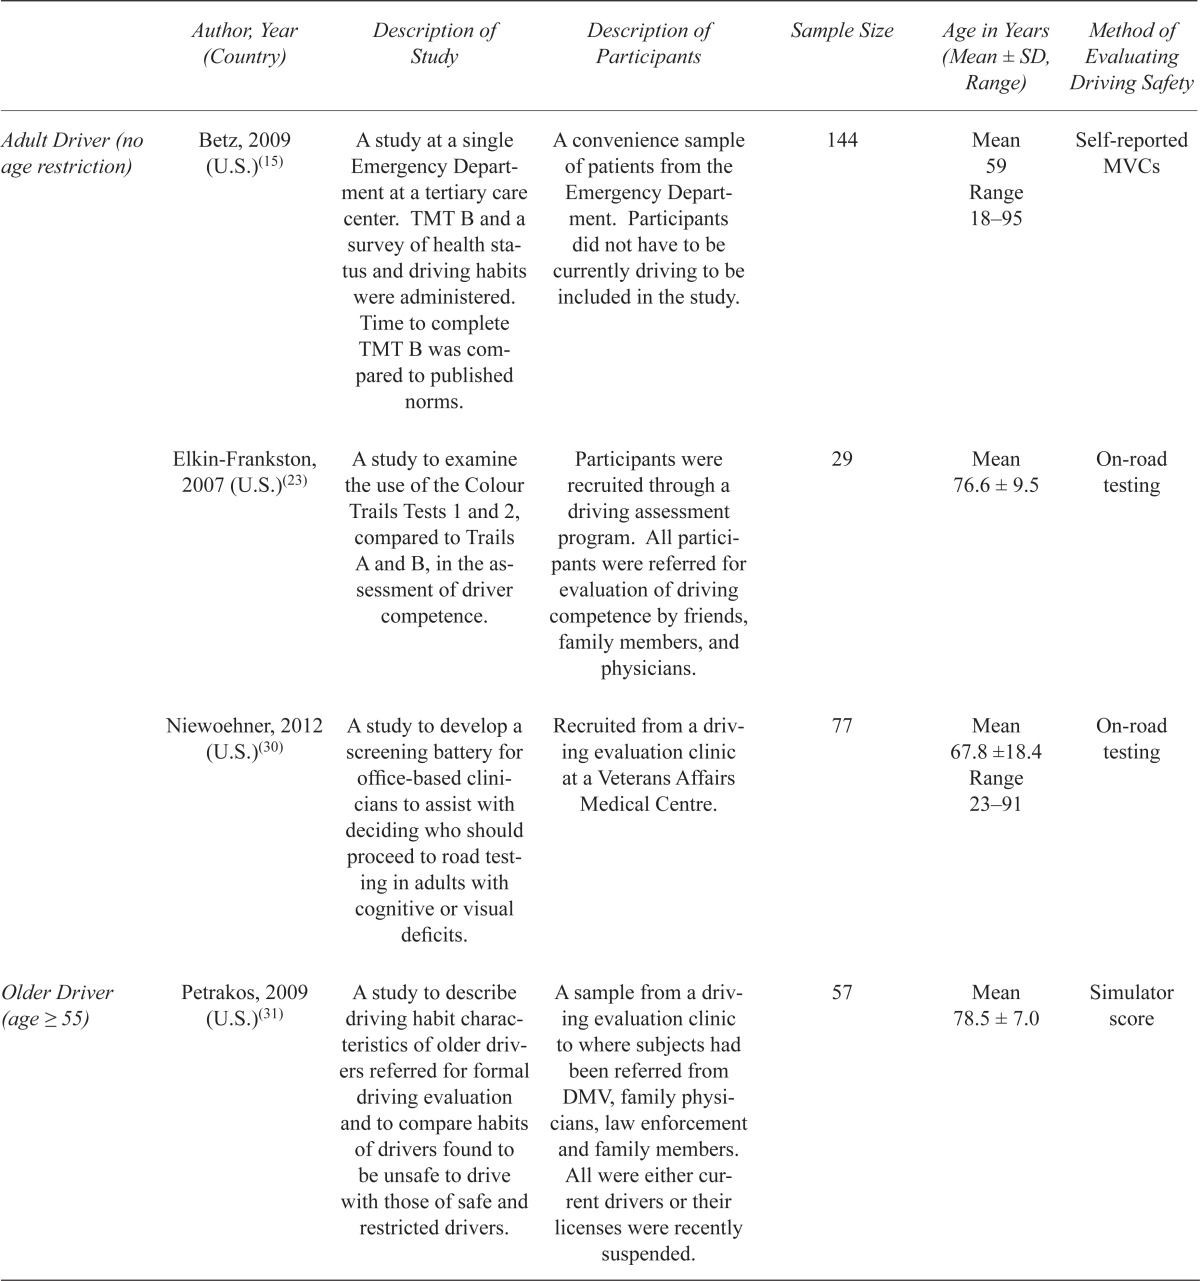

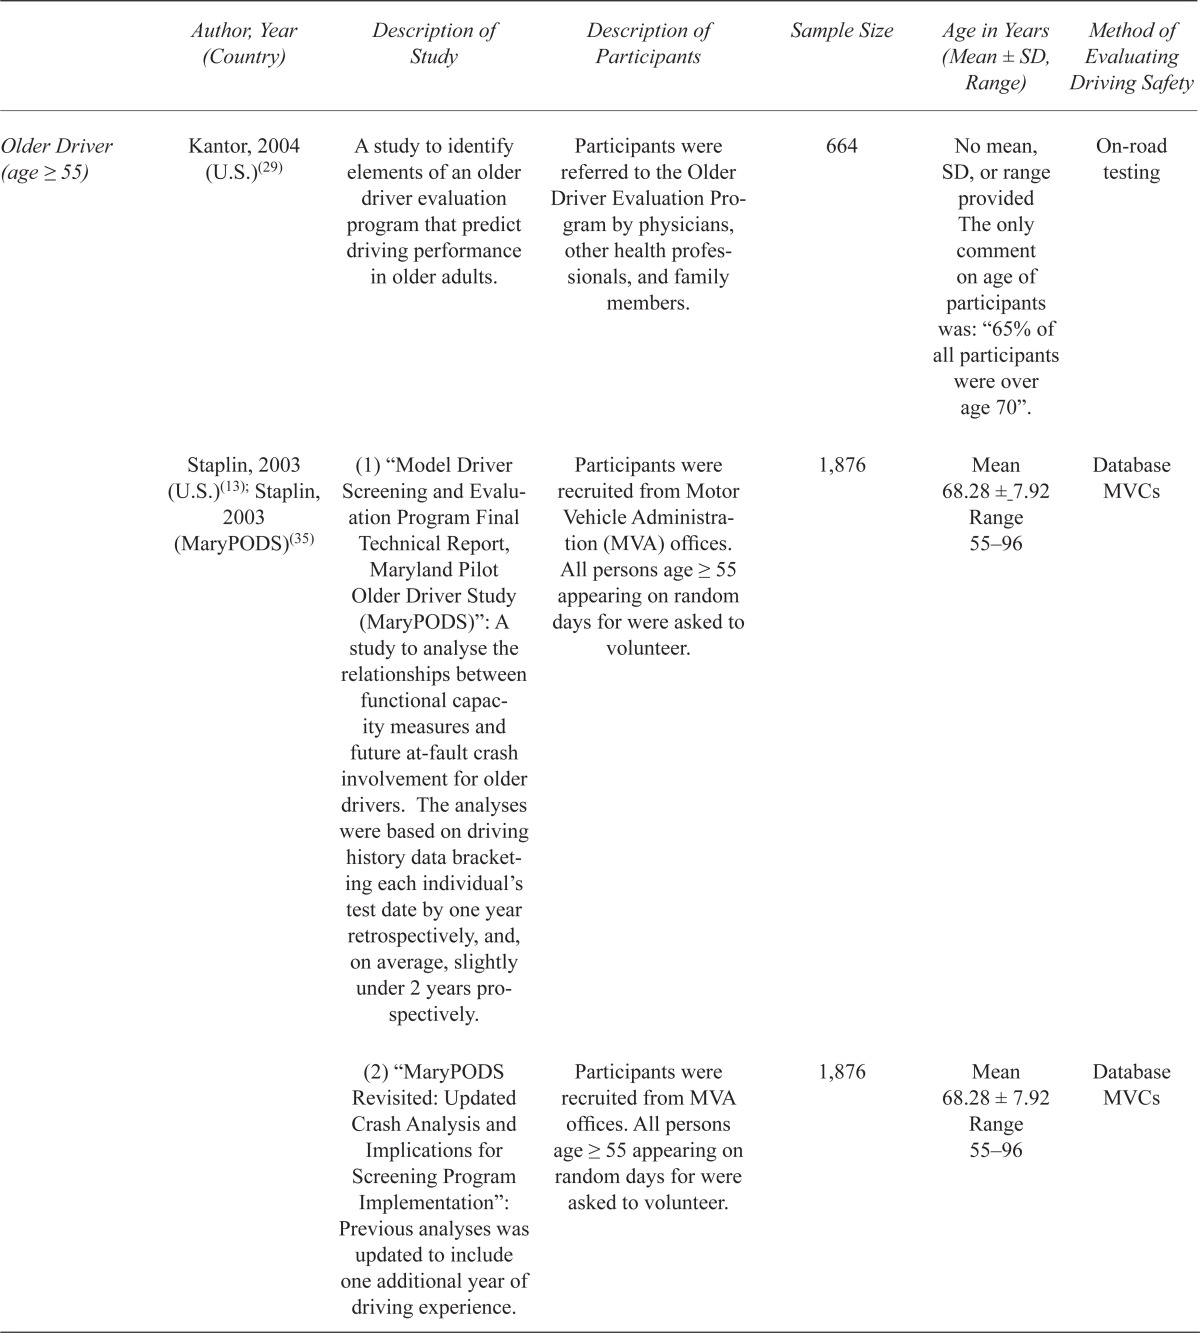
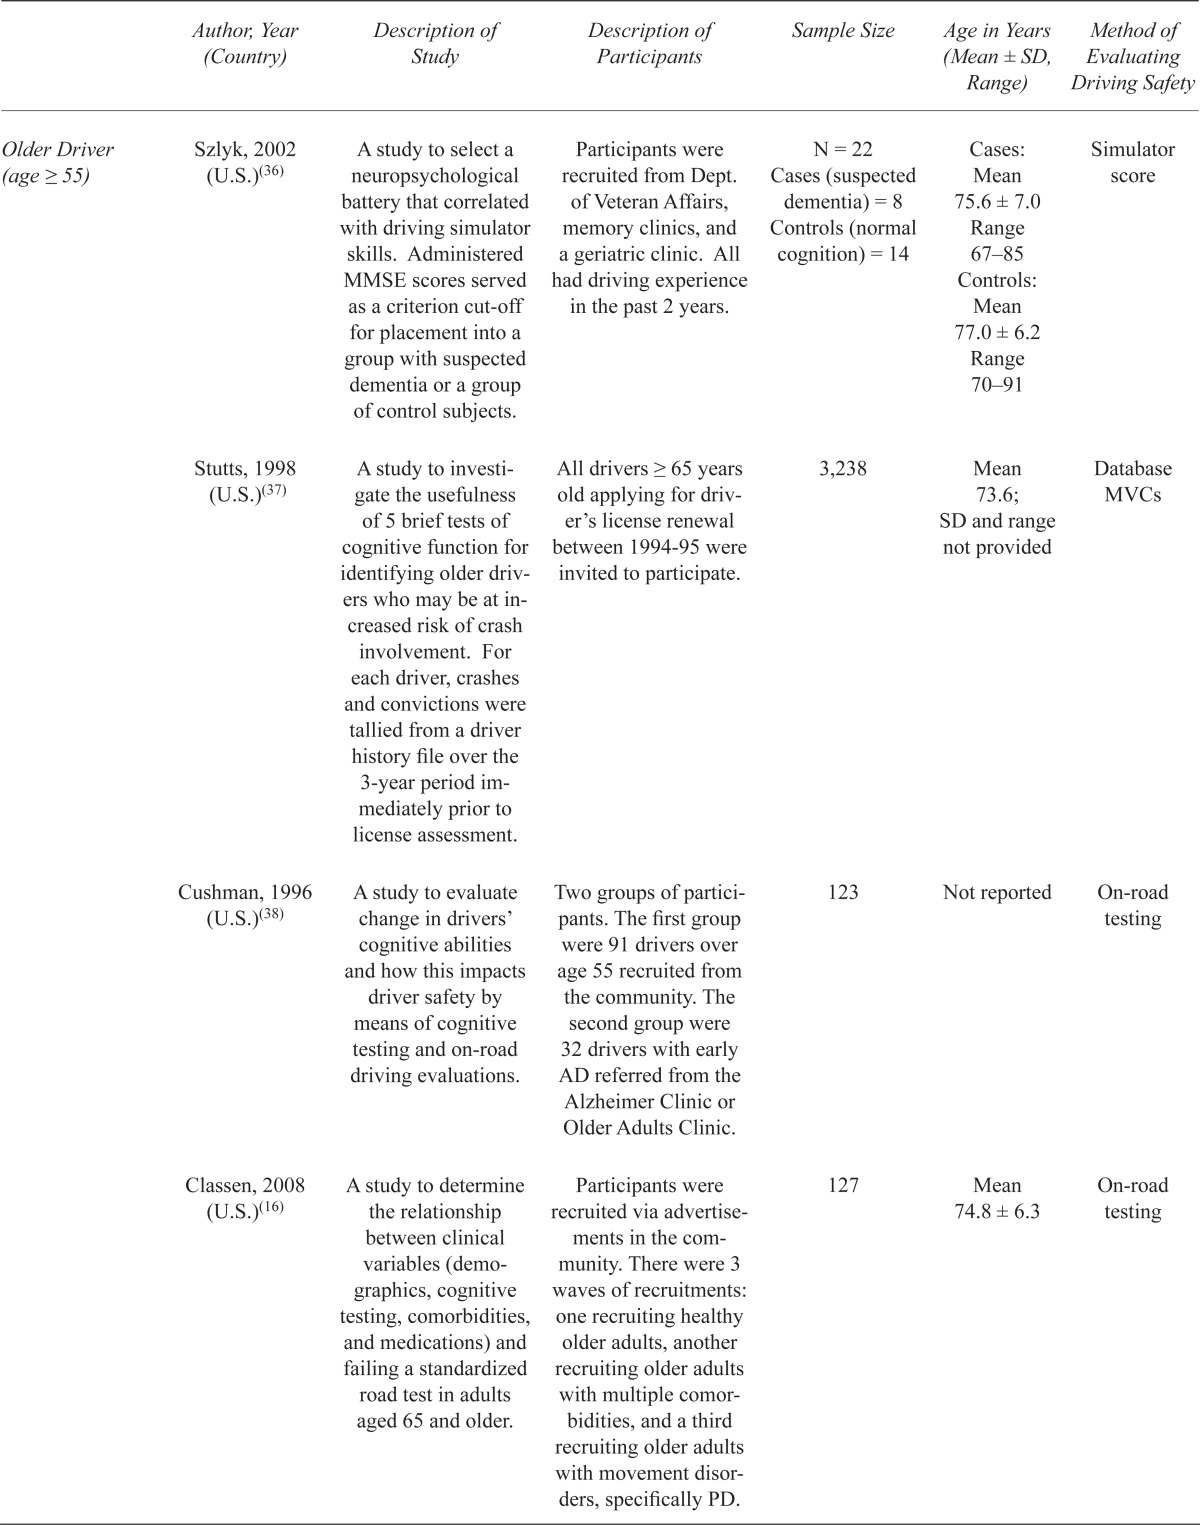
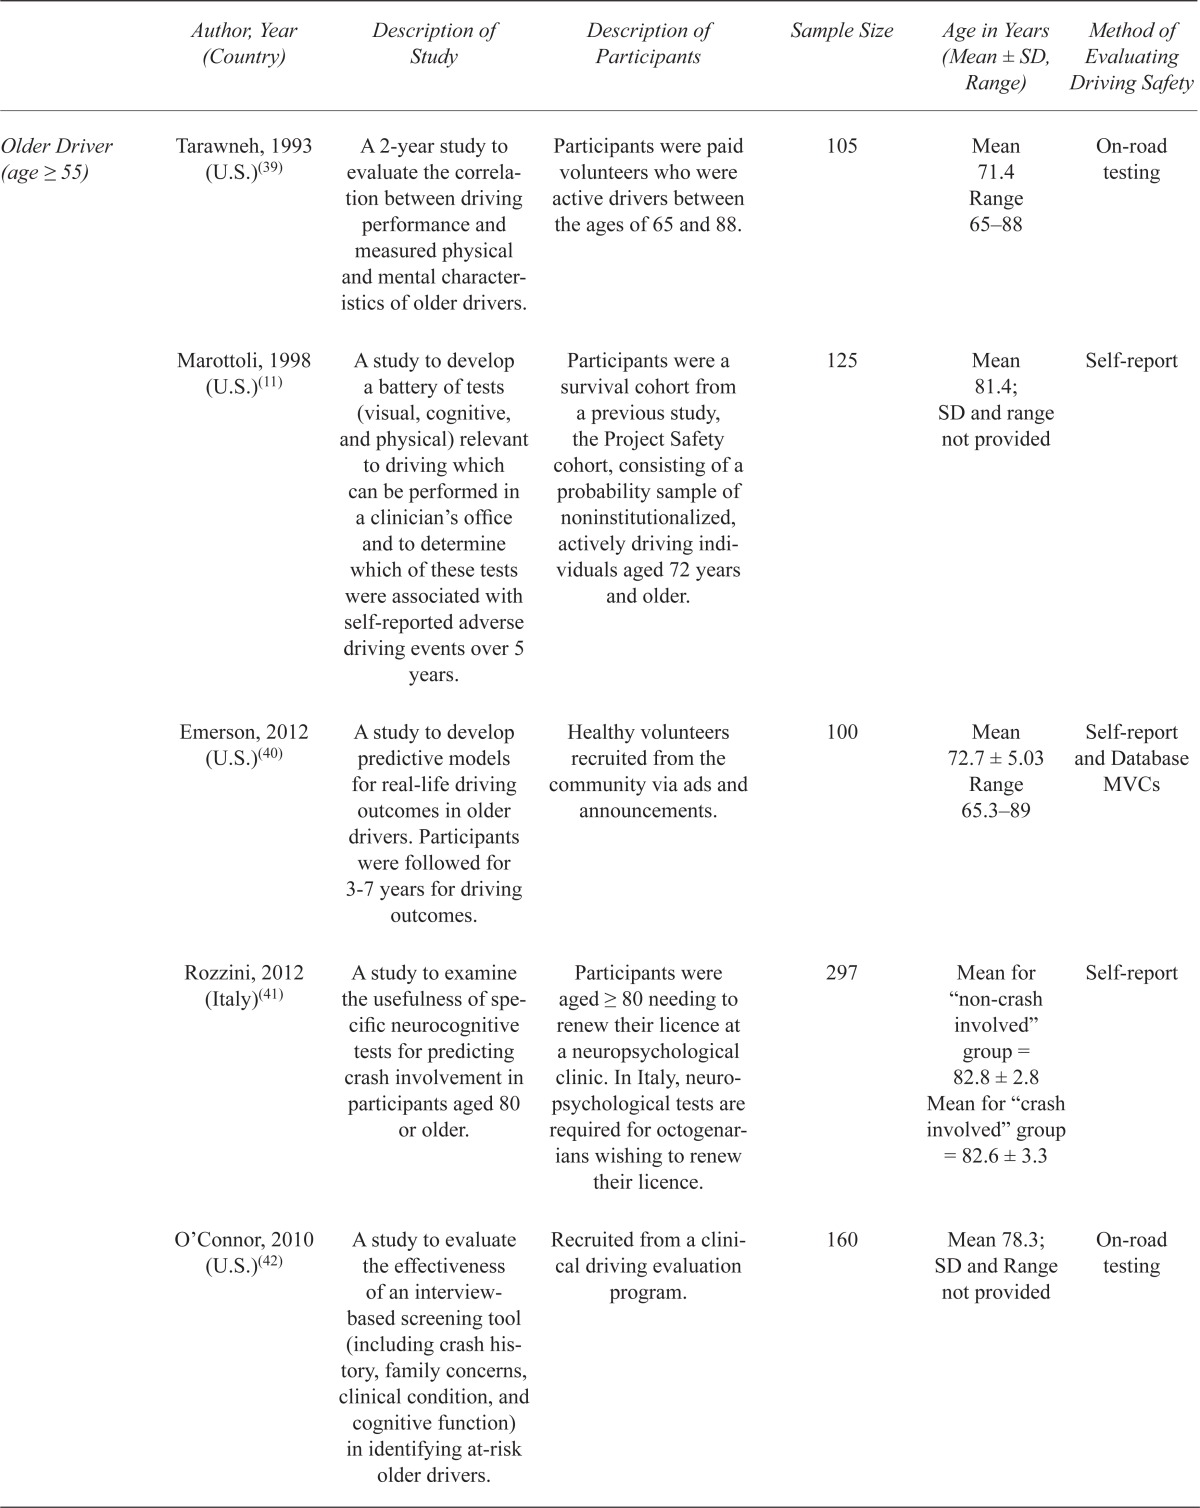

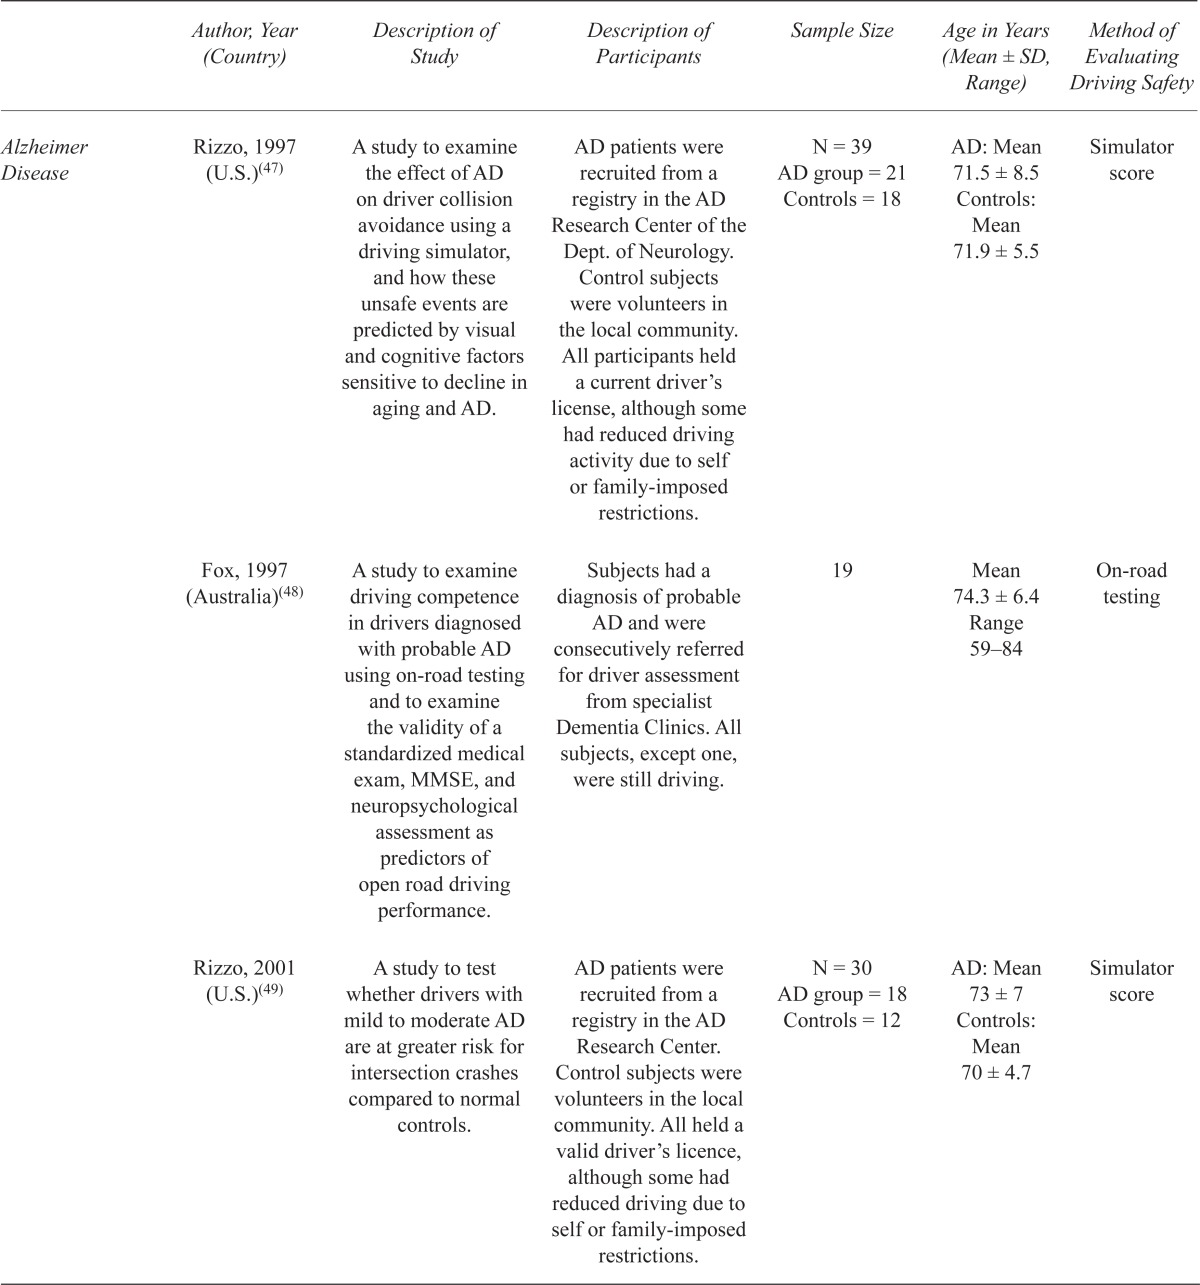
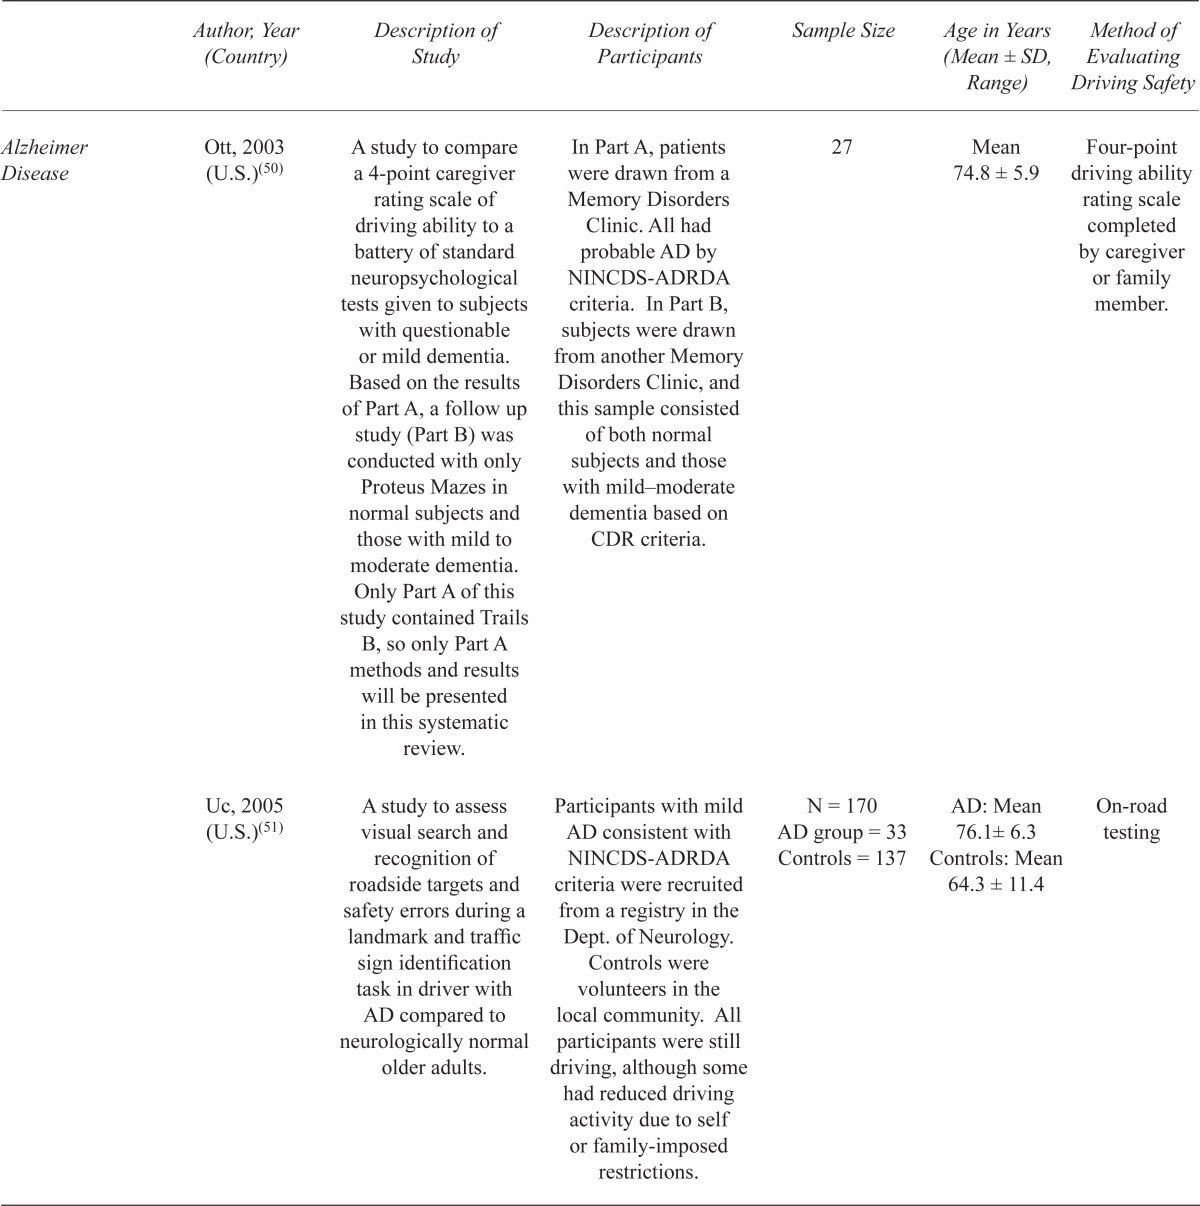
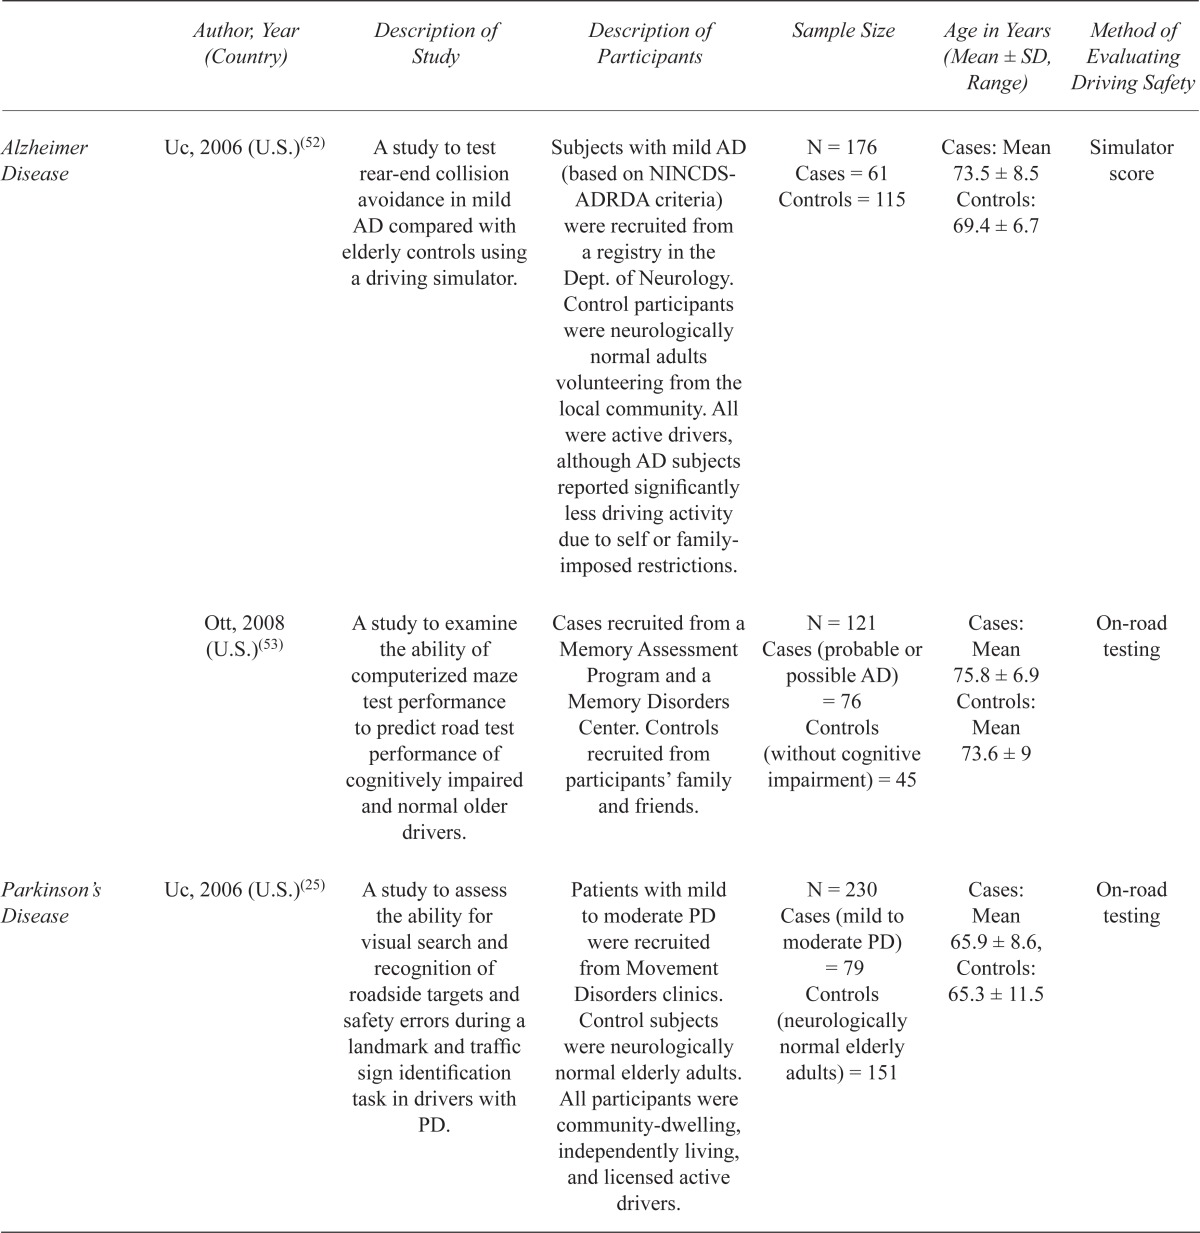


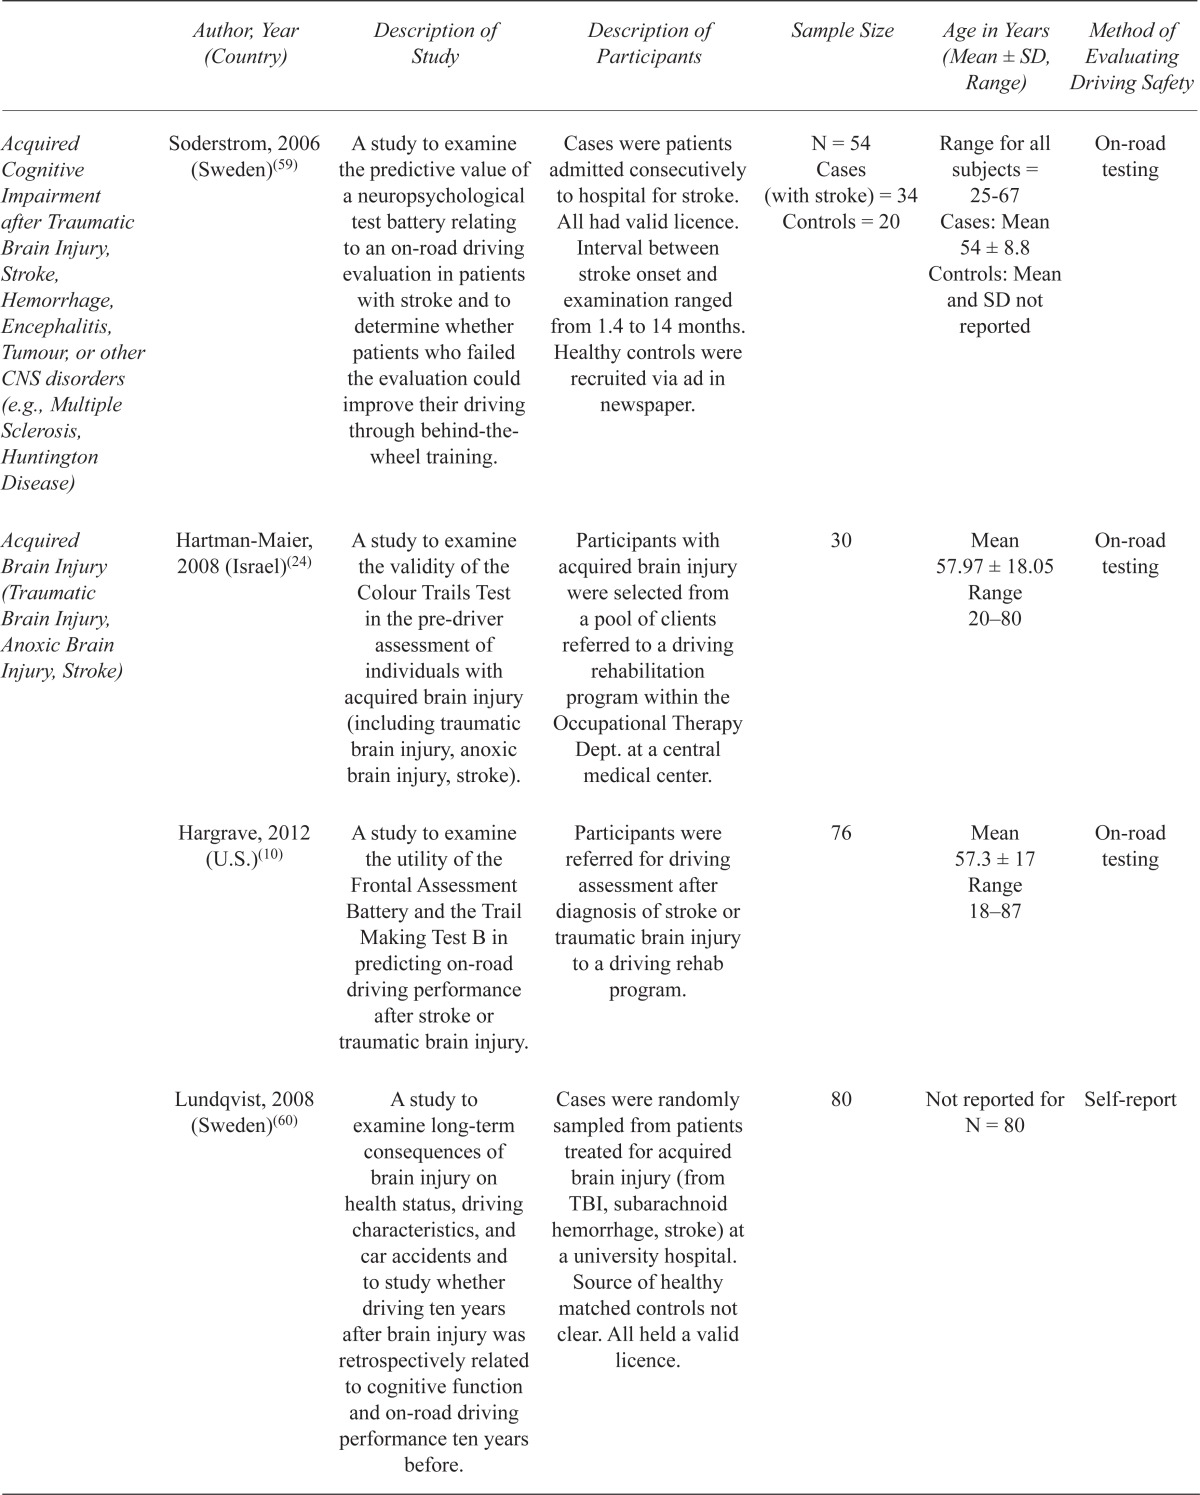
| Author, Year (Country) | Description of Study | Description of Participants | Sample Size | Age in Years (Mean ± SD, Range) | Method of Evaluating Driving Safety | |
|---|---|---|---|---|---|---|
| Adult Driver (no age restriction) | Betz, 2009 (U.S.)(15) | A study at a single Emergency Department at a tertiary care center. TMT B and a survey of health status and driving habits were administered. Time to complete TMT B was compared to published norms. | A convenience sample of patients from the Emergency Department. Participants did not have to be currently driving to be included in the study. | 144 | Mean 59 Range 18–95 |
Self-reported MVCs |
| Elkin-Frankston, 2007 (U.S.)(23) | A study to examine the use of the Colour Trails Tests 1 and 2, compared to Trails A and B, in the assessment of driver competence. | Participants were recruited through a driving assessment program. All participants were referred for evaluation of driving competence by friends, family members, and physicians. | 29 | Mean 76.6 ± 9.5 | On-road testing | |
| Niewoehner, 2012 (U.S.)(30) | A study to develop a screening battery for office-based clinicians to assist with deciding who should proceed to road testing in adults with cognitive or visual deficits. | Recruited from a driving evaluation clinic at a Veterans Affairs Medical Centre. | 77 | Mean 67.8 ±18.4 Range 23–91 |
On-road testing | |
| Older Driver (age ≥ 55) | Petrakos, 2009 (U.S.)(31) | A study to describe driving habit characteristics of older drivers referred for formal driving evaluation and to compare habits of drivers found to be unsafe to drive with those of safe and restricted drivers. | A sample from a driving evaluation clinic to where subjects had been referred from DMV, family physicians, law enforcement and family members. All were either current drivers or their licenses were recently suspended. | 57 | Mean 78.5 ± 7.0 | Simulator score |
| Freund, 2008 (U.S.)(32) | A study to describe a population of older drivers with driving restrictions, their most common restrictions, and to compare restricted drivers to their safe and unsafe counterparts. | Participants from a driving clinic referred by physicians, family, friends, DMV, or self referred. All had a valid driver’s license. | 108 | Safe group: Mean 77.63 ± 6.62 Range 62–86 |
Simulator score | |
| Restricted group: Mean 78.06 ± 8.64 Range 60–99 | ||||||
| Unsafe group: Mean 76.98±7.60 Range 62–97 | ||||||
| Freund, 2008 (U.S.)(33) | A study to assess to what extent specific cognitive functions contribute to pedal errors among older drivers. | Participants recruited through a driving evaluation clinic, referred by family physicians, DMV, or self referred. All were currently driving. | 176 | Mean 76 Range 65–89 |
Simulator score | |
| Wood, 2008 (Australia)(34) | A study to identify a battery of tests that predicts safe and unsafe performance on an on-road assessment of driving. | Participants were community-dwelling individuals ≥ 70 years old who were living independently without walking aids. They were recruited through the electoral roll to participate in a larger study. Those who were current drivers were invited to participate in this study. | 270 | Mean 75.8 ± 4.0 Range 70–88 |
On-road testing | |
| Ball, 2006 (U.S.)(12) | A study to evaluate the relationship between performance-based risk factors and subsequent, future at-fault motor vehicle collision involvement in a cohort of older drivers. | Participants were older adults (≥ 55 years old) presenting to renew their driver’s license at MVA offices. This is a similar population to the MaryPODS study – see below. | 1,910 | Mean 68.55 ±7.95 Range 55–96 |
Database MVCs | |
| Kantor, 2004 (U.S.)(29) | A study to identify elements of an older driver evaluation program that predict driving performance in older adults. | Participants were referred to the Older Driver Evaluation Program by physicians, other health professionals, and family members. | 664 | No mean, SD, or range provided The only comment on age of participants was: “65% of all participants were over age 70”. | On-road testing | |
| Staplin, 2003 (U.S.)(13); Staplin, 2003 (MaryPODS)(35) | (1) “Model Driver Screening and Evaluation Program Final Technical Report, Maryland Pilot Older Driver Study (MaryPODS)”: A study to analyse the relationships between functional capacity measures and future at-fault crash involvement for older drivers. The analyses were based on driving history data bracketing each individual’s test date by one year retrospectively, and, on average, slightly under 2 years prospectively. | Participants were recruited from Motor Vehicle Administration (MVA) offices. All persons age ≥ 55 appearing on random days for were asked to volunteer. | 1,876 | Mean 68.28 ± 7.92 Range 55–96 |
Database MVCs | |
| (2) “MaryPODS Revisited: Updated Crash Analysis and Implications for Screening Program Implementation”: Previous analyses was updated to include one additional year of driving experience. | Participants were recruited from MVA offices. All persons age ≥ 55 appearing on random days for were asked to volunteer. | 1,876 | Mean 68.28 ± 7.92 Range 55–96 |
Database MVCs | ||
| Szlyk, 2002 (U.S.)(36) | A study to select a neuropsychological battery that correlated with driving simulator skills. Administered MMSE scores served as a criterion cut-off for placement into a group with suspected dementia or a group of control subjects. | Participants were recruited from Dept. of Veteran Affairs, memory clinics, and a geriatric clinic. All had driving experience in the past 2 years. | N = 22 Cases (suspected dementia) = 8 Controls (normal cognition) = 14 |
Cases: Mean 75.6 ± 7.0 Range 67–85 Controls: Mean 77.0 ± 6.2 Range 70–91 |
Simulator score | |
| Stutts, 1998 (U.S.)(37) | A study to investigate the usefulness of 5 brief tests of cognitive function for identifying older drivers who may be at increased risk of crash involvement. For each driver, crashes and convictions were tallied from a driver history file over the 3-year period immediately prior to license assessment. | All drivers ≥ 65 years old applying for driver’s license renewal between 1994–95 were invited to participate. | 3,238 | Mean 73.6; SD and range not provided | Database MVCs | |
| Cushman, 1996 (U.S.)(38) | A study to evaluate change in drivers’ cognitive abilities and how this impacts driver safety by means of cognitive testing and on-road driving evaluations. | Two groups of participants. The first group were 91 drivers over age 55 recruited from the community. The second group were 32 drivers with early AD referred from the Alzheimer Clinic or Older Adults Clinic. | 123 | Not reported | On-road testing | |
| Classen, 2008 (U.S.)(16) | A study to determine the relationship between clinical variables (demographics, cognitive testing, comorbidities, and medications) and failing a standardized road test in adults aged 65 and older. | Participants were recruited via advertisements in the community. There were 3 waves of recruitments: one recruiting healthy older adults, another recruiting older adults with multiple comorbidities, and a third recruiting older adults with movement disorders, specifically PD. | 127 | Mean 74.8 ± 6.3 | On-road testing | |
| Tarawneh, 1993 (U.S.)(39) | A 2-year study to evaluate the correlation between driving performance and measured physical and mental characteristics of older drivers. | Participants were paid volunteers who were active drivers between the ages of 65 and 88. | 105 | Mean 71.4 Range 65–88 |
On-road testing | |
| Marottoli, 1998 (U.S.)(11) | A study to develop a battery of tests (visual, cognitive, and physical) relevant to driving which can be performed in a clinician’s office and to determine which of these tests were associated with self-reported adverse driving events over 5 years. | Participants were a survival cohort from a previous study, the Project Safety cohort, consisting of a probability sample of noninstitutionalized, actively driving individuals aged 72 years and older. | 125 | Mean 81.4; SD and range not provided | Self-report | |
| Emerson, 2012 (U.S.)(40) | A study to develop predictive models for real-life driving outcomes in older drivers. Participants were followed for 3–7 years for driving outcomes. | Healthy volunteers recruited from the community via ads and announcements. | 100 | Mean 72.7 ± 5.03 Range 65.3–89 |
Self-report and Database MVCs | |
| Rozzini, 2012 (Italy)(41) | A study to examine the usefulness of specific neurocognitive tests for predicting crash involvement in participants aged 80 or older. | Participants were aged ≥ 80 needing to renew their licence at a neuropsychological clinic. In Italy, neuropsychological tests are required for octogenarians wishing to renew their licence. | 297 | Mean for “non-crash involved” group = 82.8 ± 2.8 Mean for “crash involved” group = 82.6 ± 3.3 |
Self-report | |
| O’Connor, 2010 (U.S.)(42) | A study to evaluate the effectiveness of an interview-based screening tool (including crash history, family concerns, clinical condition, and cognitive function) in identifying at-risk older drivers. | Recruited from a clinical driving evaluation program. | 160 | Mean 78.3; SD and Range not provided | On-road testing | |
| Park, 2011 (Korea)(43) | A study to find an association between cognitive-perceptual problems of older drivers and unsafe driving performance during driving on a simulator. | Cases recruited from a driver evaluation clinic. Source of controls unclear. | N = 103 Cases (age ≥ 65) = 55 Controls (age late 20’s to early 40’s) = 48 |
Cases: Mean 69.91 ± 3.63 Controls: Mean 34.25 ± 3.62 |
Simulator score | |
| Selander, 2011 (Sweden)(44) | A study to investigate driving errors characteristic for older drivers and relationships between cognitive off-road and on-road test results. | Older drivers (age 65+) randomly selected from Vehicle Registration Office. Participation voluntary. | 85 | Mean 72 ± 5.3 Range 65–85 |
On-road testing | |
| Alzheimer Disease | Dawson, 2009 (U.S.)(45) | A study to measure the association of cognition, visual perception, and motor function with driving safety in AD. | AD patients were recruited from a registry maintained by the Dept. of Neurology. Controls were volunteers in the local community, with no neurological diagnosis or complaints and no personal or family report of abnormal cognitive decline. All were active drivers. | N = 155 Cases (probable early dementia) = 40 Controls (neurologically normal) = 115 |
Cases: Mean 75.1 ± 7.7 Controls: Mean 69.4 ± 7.0 |
On-road testing |
| Grace, 2005 (U.S.)(46) | A study to examine neuropsychological and motor deficits in PD that may contribute to driving impairment, comparing patients with PD to patients with AD and to healthy elderly controls. | PD patients were drawn consecutively from a hospital-based movement disorders clinic. AD patients were recruited through a hospital-based memory disorders clinic. Control subjects were age and education matched community volunteers or nondemented spouses of AD patients. All participants were currently driving. | N = 62 PD group = 21 AD group = 20 Controls = 21 |
PD: Mean 68.1 ± 8.5 Range 45–83 AD: Mean 70.8 ± 7.1 Range 59–85 Controls: Mean 69.0 ± 10.4 Range 46–85 |
On-road testing | |
| Rizzo, 1997 (U.S.)(47) | A study to examine the effect of AD on driver collision avoidance using a driving simulator, and how these unsafe events are predicted by visual and cognitive factors sensitive to decline in aging and AD. | AD patients were recruited from a registry in the AD Research Center of the Dept. of Neurology. Control subjects were volunteers in the local community. All participants held a current driver’s license, although some had reduced driving activity due to self or family-imposed restrictions. | N = 39 AD group = 21 Controls = 18 |
AD: Mean 71.5 ± 8.5 Controls: Mean 71.9 ± 5.5 |
Simulator score | |
| Fox, 1997 (Australia)(48) | A study to examine driving competence in drivers diagnosed with probable AD using on-road testing and to examine the validity of a standardized medical exam, MMSE, and neuropsychological assessment as predictors of open road driving performance. | Subjects had a diagnosis of probable AD and were consecutively referred for driver assessment from specialist Dementia Clinics. All subjects, except one, were still driving. | 19 | Mean 74.3 ± 6.4 Range 59–84 |
On-road testing | |
| Rizzo, 2001 (U.S.)(49) | A study to test whether drivers with mild to moderate AD are at greater risk for intersection crashes compared to normal controls. | AD patients were recruited from a registry in the AD Research Center. Control subjects were volunteers in the local community. All held a valid driver’s licence, although some had reduced driving due to self or family-imposed restrictions. | N = 30 AD group = 18 Controls = 12 |
AD: Mean 73 ± 7 Controls: Mean 70 ± 4.7 |
Simulator score | |
| Ott, 2003 (U.S.)(50) | A study to compare a 4-point caregiver rating scale of driving ability to a battery of standard neuropsychological tests given to subjects with questionable or mild dementia. Based on the results of Part A, a follow up study (Part B) was conducted with only Proteus Mazes in normal subjects and those with mild to moderate dementia. Only Part A of this study contained Trails B, so only Part A methods and results will be presented in this systematic review. | In Part A, patients were drawn from a Memory Disorders Clinic. All had probable AD by NINCDS-ADRDA criteria. In Part B, subjects were drawn from another Memory Disorders Clinic, and this sample consisted of both normal subjects and those with mild–moderate dementia based on CDR criteria. | 27 | Mean 74.8 ± 5.9 | Four-point driving ability rating scale completed by caregiver or family member. | |
| Uc, 2005 (U.S.)(51) | A study to assess visual search and recognition of roadside targets and safety errors during a landmark and traffic sign identification task in driver with AD compared to neurologically normal older adults. | Participants with mild AD consistent with NINCDS-ADRDA criteria were recruited from a registry in the Dept. of Neurology. Controls were volunteers in the local community. All participants were still driving, although some had reduced driving activity due to self or family-imposed restrictions. | N = 170 AD group = 33 Controls = 137 |
AD: Mean 76.1± 6.3 Controls: Mean 64.3 ± 11.4 |
On-road testing | |
| Uc, 2006 (U.S.)(52) | A study to test rear-end collision avoidance in mild AD compared with elderly controls using a driving simulator. | Subjects with mild AD (based on NINCDS-ADRDA criteria) were recruited from a registry in the Dept. of Neurology. Control participants were neurologically normal adults volunteering from the local community. All were active drivers, although AD subjects reported significantly less driving activity due to self or family-imposed restrictions. | N = 176 Cases = 61 Controls = 115 |
Cases: Mean 73.5 ± 8.5 Controls: 69.4 ± 6.7 |
Simulator score | |
| Ott, 2008 (U.S.)(53) | A study to examine the ability of computerized maze test performance to predict road test performance of cognitively impaired and normal older drivers. | Cases recruited from a Memory Assessment Program and a Memory Disorders Center. Controls recruited from participants’ family and friends. | N = 121 Cases (probable or possible AD) = 76 Controls (without cognitive impairment) = 45 |
Cases: Mean 75.8 ± 6.9 Controls: Mean 73.6 ± 9 |
On-road testing | |
| Parkinson’s Disease | Uc, 2006 (U.S.)(25) | A study to assess the ability for visual search and recognition of roadside targets and safety errors during a landmark and traffic sign identification task in drivers with PD. | Patients with mild to moderate PD were recruited from Movement Disorders clinics. Control subjects were neurologically normal elderly adults. All participants were community-dwelling, independently living, and licensed active drivers. | N = 230 Cases (mild to moderate PD) = 79 Controls (neurologically normal elderly adults) = 151 |
Cases: Mean 65.9 ± 8.6, Controls: 65.3 ± 11.5 |
On-road testing |
| Grace, 2005 (U.S.) (46) | A study to examine neuropsychological and motor deficits in PD that may contribute to driving impairment, comparing patients with PD to patients with AD and to healthy elderly controls. | PD patients were drawn consecutively forma hospital-based movement disorders clinic. AD patients were recruited through a hospital-based memory disorders clinic. Control subjects were age and education matched community volunteers or nondemented spouses of AD patients. All participants were currently driving. | N = 62 PD group = 21 AD group = 20 Controls = 21 |
PD: Mean 68.1 ± 8.5 Range 45–83 AD: Mean 70.8 ± 7.1 Range 59–85 Controls: Mean 69.0 ± 10.4 Range 46–85 |
On-road testing | |
| Scally, 2011 (Australia)(26) | A study to investigate the impact of external cue validity on simulated driving performance in PD compared to controls. | Cases were drivers with PD diagnosed by a neurologist. Source of cases and controls not explicitly stated. | N = 28 Cases (with PD) = 19 Controls (healthy, age-matched) = 19 |
Cases: Mean 68.74 ± 6.72 Range 52–81 Controls: Mean 68.05 ±7.2 Range 56–78 |
Simulator score | |
| Dementia, not specified | Carr, 2011 (U.S.)(54) | A study to develop a cognitive and functional screening battery for the on-road performance of older drivers with dementia. | Recruited from a driving evaluation clinic. Participants had a diagnosis of dementia from physician referral or from AD-8 (Aging and Dementia-8) questionnaire completed by an informant. | 85 | Mean 74.2 ±9 Range 52–90 |
On-road testing |
| Questionable Dementia (CDR = 0.5) including possible AD, stroke, remote history of alcohol abuse, or head trauma | Whelihan, 2005 (U.S.)(55) | A study to investigate the role of visual attention and executive measures in predicting driving competence in older individuals with early-stage cognitive decline compared to age-matched controls. | Participants in the patient group all had a CDR of 0.5 and were recruited sequentially from a Memory Disorders Clinic. Controls all had a CDR of 0 (cognitively intact) and were recruited from the local community via ads. | N = 46 Questionable dementia group (CDR 0.5) = 23 Controls (CDR 0) = 23 |
Cases: Mean 78.2 ± 9.3 Controls: Mean 74.3 ±7.3 |
On-road testing |
| Acquired Cognitive Impairment after Traumatic Brain Injury, Stroke, Hemorrhage, Encephalitis, Tumour, or other CNS disorders (e.g., Multiple Sclerosis, Huntington Disease) | Alexandersen, 2009 (Norway)(56) | A study to investigate the predictive value of neuropsychological tests for on-road evaluation outcome after inconclusive assessment. | Outpatients at Dept. of Physical Medicine and Rehabilitation referred for evaluation of fitness to drive after inconclusive neuropsychological assessment. | 35 | Mean 47.4 ± 13.7 | On-road testing |
| Lundqvist, 2007 (Sweden)(57) | A study to assess drivers with acquired brain injury on cognitive functions, driving performance, and the drivers’ self-rating of their driving. | The participants were a consecutive sample of patients with brain injury who received outpatient rehabilitation services at the Dept. of Rehabilitation Medicine. | 30 | Mean 51.6 ± 11.21 Range 21–75 |
On-road testing | |
| Mazer, 1998 (Canada)(14) | A study to determine the ability of perceptual testing to predict on-road driving outcome in subjects with stroke. | Subjects with stroke referred to a Driving Evaluation Service, including both inpatients at a Rehabilitation Hospital and outpatient referrals. | 84 | Mean 60.8 ± 11.9 Range 27–84 |
On-road testing | |
| Devos, 2012 (Belgium)(58) | A study to identify the most accurate clinical predictors of fitness to drive in HD. | Cases were all active drivers recruited from HD clinic at a university hospital. Source of controls not clear. | N = 60 Cases (with HD) = 30 Healthy controls = 30 |
Cases: Mean 50.2 ± 12.4 Controls: Mean 50.26 ± 12.64 |
On-road testing | |
| Bliokas, 2011 (Australia)(17) | A study to evaluate a neuropsychological assessment battery and its individual test components to assess fitness to drive in cognitively impaired individuals (including traumatic brain injury, stroke, PD, dementia). | Participants were referred for driving assessment after neurological injury to a Brain Injury Service and Rehab Unit. | 104 | Mean 61.35 ± 16.71 Range 17–93 |
On-road testing | |
| Soderstrom, 2006 (Sweden)(59) | A study to examine the predictive value of a neuropsychological test battery relating to an on-road driving evaluation in patients with stroke and to determine whether patients who failed the evaluation could improve their driving through behind-the-wheel training. | Cases were patients admitted consecutively to hospital for stroke. All had valid licence. Interval between stroke onset and examination ranged from 1.4 to 14 months. Healthy controls were recruited via ad in newspaper. | N = 54 Cases (with stroke) = 34 Controls = 20 |
Range for all subjects = 25–67 Cases: Mean 54 ± 8.8 Controls: Mean and SD not reported |
On-road testing | |
| Acquired Brain Injury (Traumatic Brain Injury, Anoxic Brain Injury, Stroke) | Hartman-Maier, 2008 (Israel)(24) | A study to examine the validity of the Colour Trails Test in the pre-driver assessment of individuals with acquired brain injury (including traumatic brain injury, anoxic brain injury, stroke). | Participants with acquired brain injury were selected from a pool of clients referred to a driving rehabilitation program within the Occupational Therapy Dept. at a central medical center. | 30 | Mean 57.97 ± 18.05 Range 20–80 |
On-road testing |
| Hargrave, 2012 (U.S.)(10) | A study to examine the utility of the Frontal Assessment Battery and the Trail Making Test B in predicting on-road driving performance after stroke or traumatic brain injury. | Participants were referred for driving assessment after diagnosis of stroke or traumatic brain injury to a driving rehab program. | 76 | Mean 57.3 ± 17 Range 18–87 |
On-road testing | |
| Lundqvist, 2008 (Sweden)(60) | A study to examine long-term consequences of brain injury on health status, driving characteristics, and car accidents and to study whether driving ten years after brain injury was retrospectively related to cognitive function and on-road driving performance ten years before. | Cases were randomly sampled from patients treated for acquired brain injury (from TBI, subarachnoid hemorrhage, stroke) at a university hospital. Source of healthy matched controls not clear. All held a valid licence. | 80 | Not reported for N = 80 | Self-report | |
| Traumatic Brain Injury | Novack, 2006 (U.S.)(61) | A study to investigate the relationship between performance on the Useful Field of View test and driving performance following TBI. | Participants were referred for evaluation by a physician to Dept. of Rehab Services, based on documented progress following TBI. All subjects had a valid driver’s license. If participation in on-road test was approved by the driving evaluator, client consent was obtained. | 60 | Mean 33 Range 16–68 |
On-road testing |
| Brooke, 1992 (U.S.)(62) | A study to examine the relationship between standardized measures of cognitive function and measures of driving performance in patients with closed head injuries and in their age-matched relative or friend cohorts. | Participants were patients admitted to a regional Level I Trauma Center with a diagnosis of closed head injury 3–6 months ago. Controls were age-matched family and friends of these patients. | N = 20 Cases = 13 (TBI) Controls = 7 (a friend or relative within 5 years of the patient’s age) |
Mean, SD, and Range not provided. The only comment on age of participants is range of age in inclusion criteria = 18–65. | On-road testing | |
| Epilepsy | Crizzle, 2012 (U.S.)(63) | A study to determine which tests, from a clinical battery, are correlated with driving errors in people with epilepsy using a simulator. | Drivers with epilepsy recruited from the epilepsy monitoring unit at a university hospital. | 16 | Mean 44.3 ± 12.0 Range 22–68 |
Simulator score |
ad = Alzheimer Disease, ad-8 = Aging and Dementia −8 questionnaire, cdr = Clinical Dementia Rating scale, cns = Central Nervous System, dmv = Department of Motor Vehicle, hd = Huntington Disease, mva = Motor Vehicle Administration, mmse = Mini Mental State Examination, mvc = Motor Vehicle Collision, nincds-adrda = National Institute of Neurological and Com municative Disorders and Stroke and the Alzheimer’s Disease and Related Disorders Association, pd = Parkinson’s Disease, tbi = Traumatic Brain Injury.
Table 2 shows the associations of Trails B with predicting driving safety (primary outcome), organized according to sample sizes in ascending order. Trails B was positively associated with determining fitness-to-drive in 32 out of 47 (68.1%) studies and found to have no association in 15 (31.9%) studies.
TABLE 2.
Reported associations of Trails B with predicting driving safety (studies with no association shaded in gray)
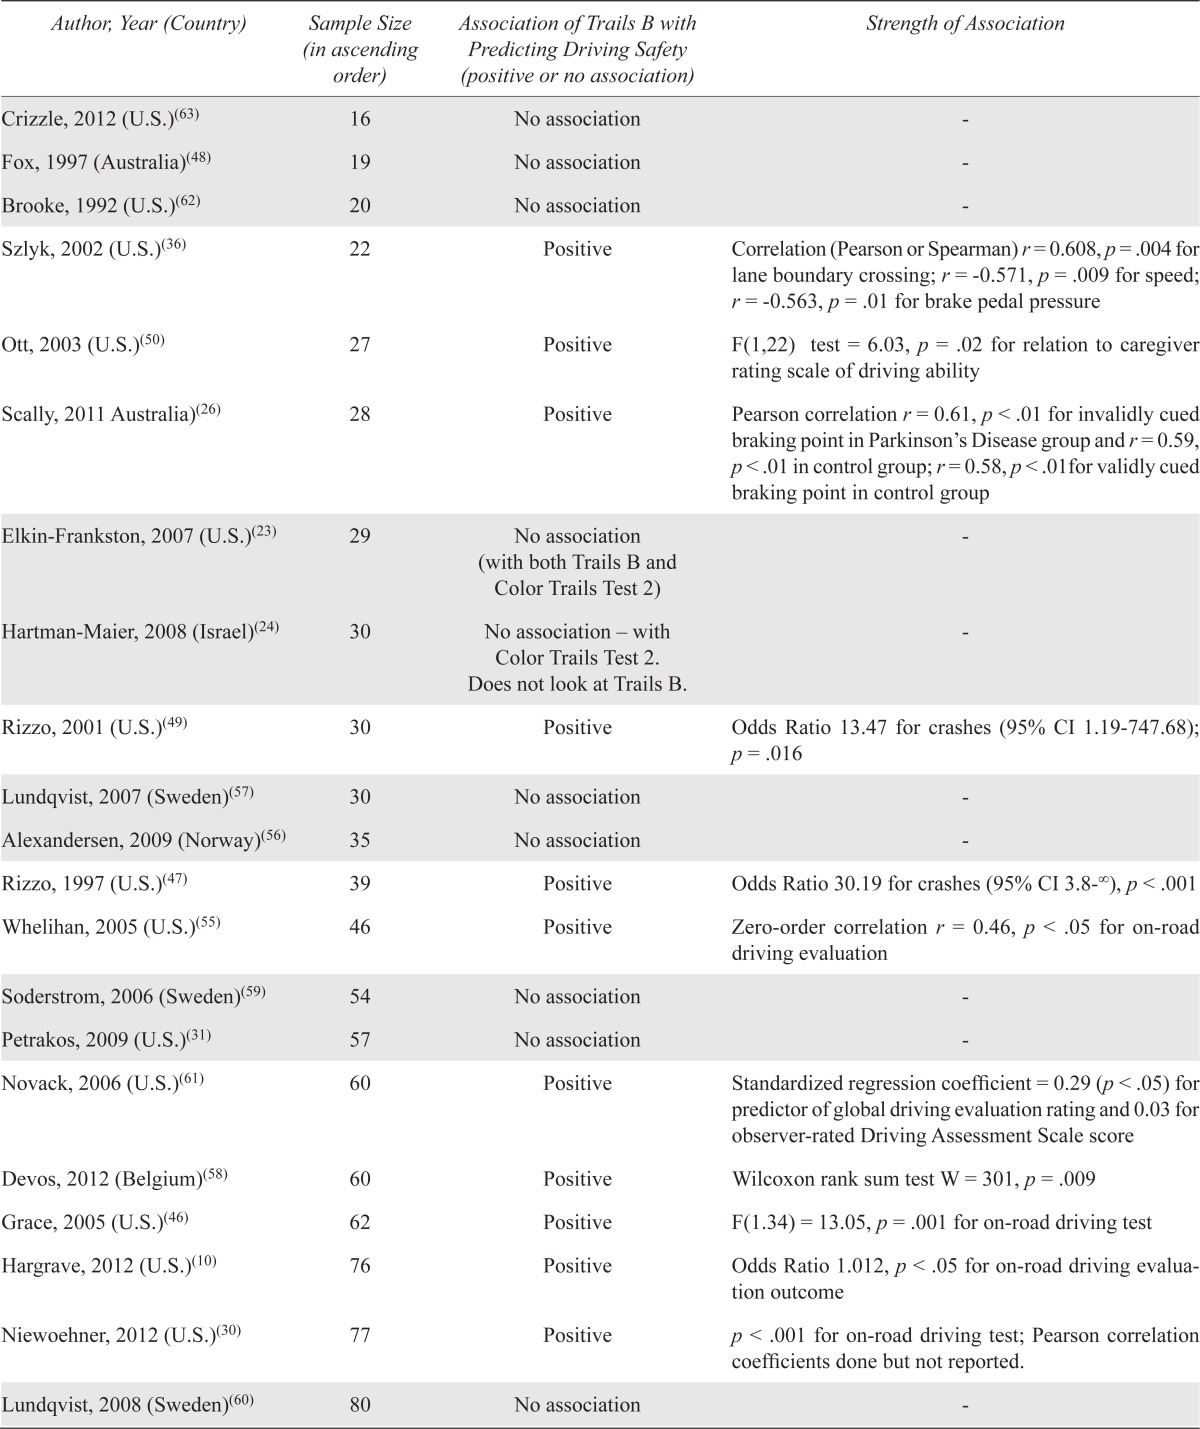
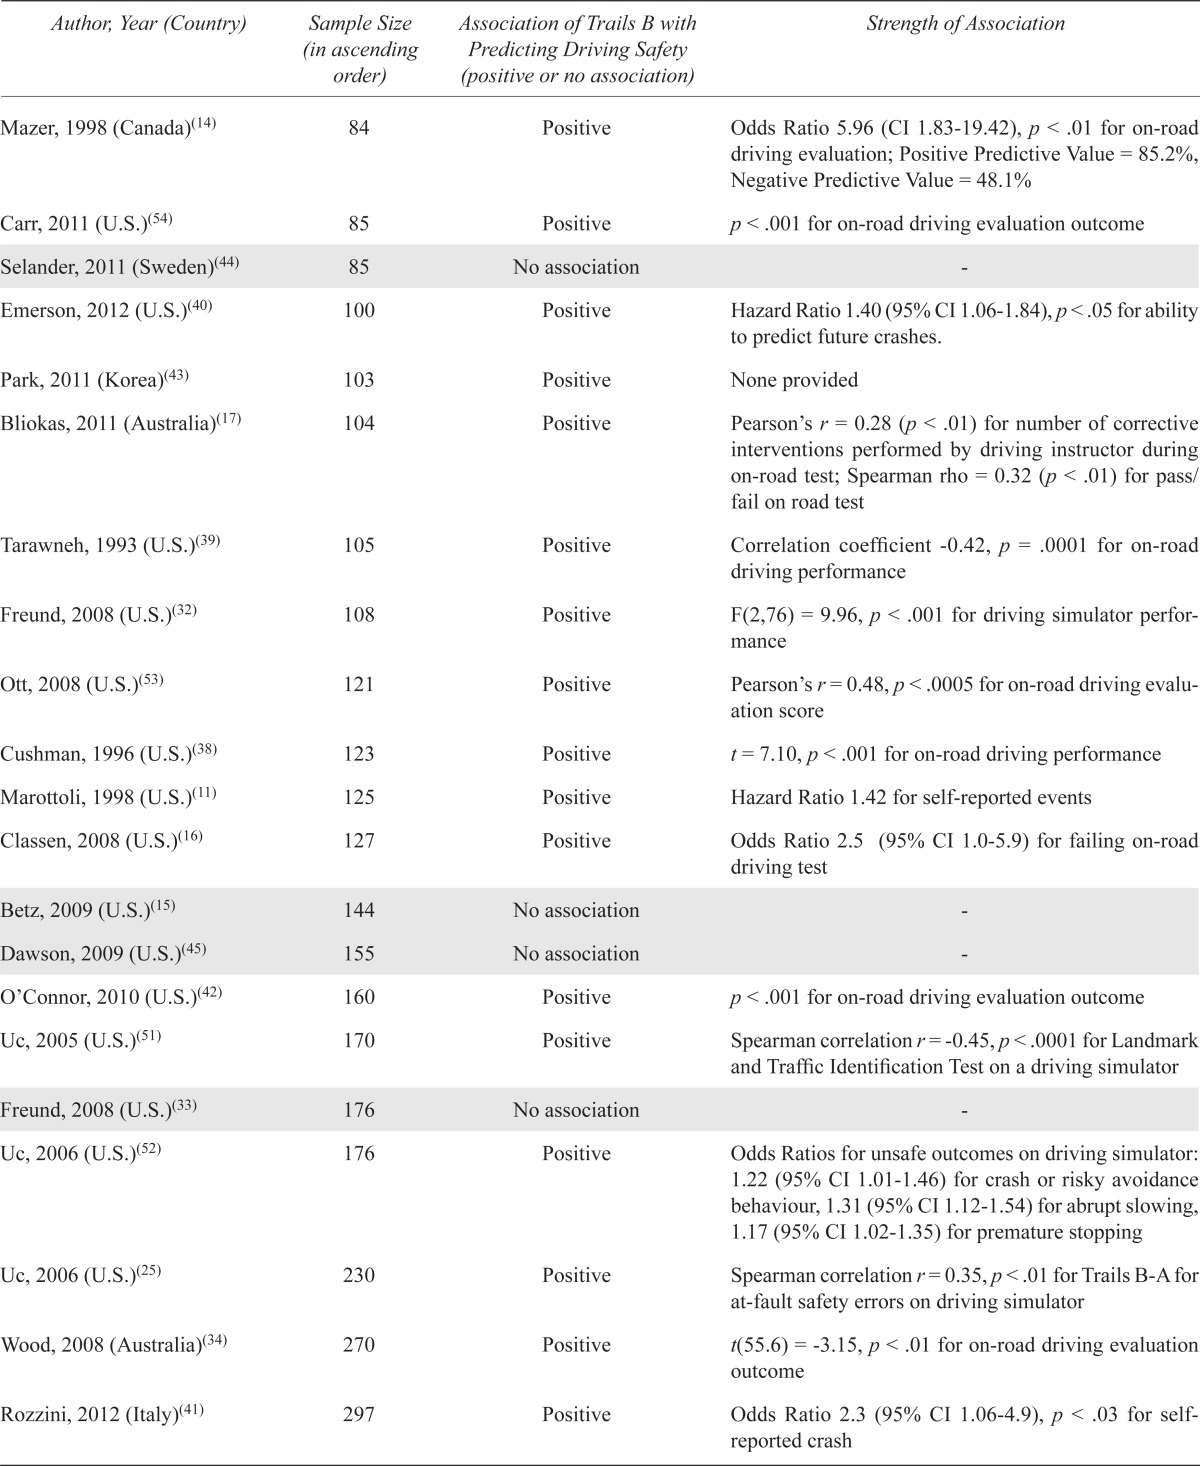
| Author, Year (Country) | Sample Size (in ascending order) | Association of Trails B with Predicting Driving Safety (positive or no association) | Strength of Association |
|---|---|---|---|
| Crizzle, 2012 (U.S.)(63) | 16 | No association | - |
| Fox, 1997 (Australia)(48) | 19 | No association | - |
| Brooke, 1992 (U.S.)(62) | 20 | No association | - |
| Szlyk, 2002 (U.S.)(36) | 22 | Positive | Correlation (Pearson or Spearman) r = 0.608, p = .004 for lane boundary crossing; r = −0.571, p = .009 for speed; r = −0.563, p = .01 for brake pedal pressure |
| Ott, 2003 (U.S.)(50) | 27 | Positive | F(1,22) test = 6.03, p = .02 for relation to caregiver rating scale of driving ability |
| Scally, 2011 Australia)(26) | 28 | Positive | Pearson correlation r = 0.61, p < .01 for invalidly cued braking point in Parkinson’s Disease group and r = 0.59, p < .01 in control group; r = 0.58, p < .01for validly cued braking point in control group |
| Elkin-Frankston, 2007 (U.S.)(23) | 29 | No association (with both Trails B and Color Trails Test 2) | - |
| Hartman-Maier, 2008 (Israel)(24) | 30 | No association – with Color Trails Test 2. Does not look at Trails B. | - |
| Rizzo, 2001 (U.S.)(49) | 30 | Positive | Odds Ratio 13.47 for crashes (95% CI 1.19–747.68); p = .016 |
| Lundqvist, 2007 (Sweden)(57) | 30 | No association | - |
| Alexandersen, 2009 (Norway)(56) | 35 | No association | - |
| Rizzo, 1997 (U.S.)(47) | 39 | Positive | Odds Ratio 30.19 for crashes (95% CI 3.8−∞), p < .001 |
| Whelihan, 2005 (U.S.)(55) | 46 | Positive | Zero-order correlation r = 0.46, p < .05 for on-road driving evaluation |
| Soderstrom, 2006 (Sweden)(59) | 54 | No association | - |
| Petrakos, 2009 (U.S.)(31) | 57 | No association | - |
| Novack, 2006 (U.S.)(61) | 60 | Positive | Standardized regression coefficient = 0.29 (p < .05) for predictor of global driving evaluation rating and 0.03 for observer-rated Driving Assessment Scale score |
| Devos, 2012 (Belgium)(58) | 60 | Positive | Wilcoxon rank sum test W = 301, p = .009 |
| Grace, 2005 (U.S.)(46) | 62 | Positive | F(1.34) = 13.05, p = .001 for on-road driving test |
| Hargrave, 2012 (U.S.)(10) | 76 | Positive | Odds Ratio 1.012, p < .05 for on-road driving evaluation outcome |
| Niewoehner, 2012 (U.S.)(30) | 77 | Positive | p < .001 for on-road driving test; Pearson correlation coefficients done but not reported. |
| Lundqvist, 2008 (Sweden)(60) | 80 | No association | - |
| Mazer, 1998 (Canada)(14) | 84 | Positive | Odds Ratio 5.96 (CI 1.83–19.42), p < .01 for on-road driving evaluation; Positive Predictive Value = 85.2%, Negative Predictive Value = 48.1% |
| Carr, 2011 (U.S.)(54) | 85 | Positive | p < .001 for on-road driving evaluation outcome |
| Selander, 2011 (Sweden)(44) | 85 | No association | - |
| Emerson, 2012 (U.S.)(40) | 100 | Positive | Hazard Ratio 1.40 (95% CI 1.06–1.84), p < .05 for ability to predict future crashes. |
| Park, 2011 (Korea)(43) | 103 | Positive | None provided |
| Bliokas, 2011 (Australia)(17) | 104 | Positive | Pearson’s r = 0.28 (p < .01) for number of corrective interventions performed by driving instructor during on-road test; Spearman rho = 0.32 (p < .01) for pass/fail on road test |
| Tarawneh, 1993 (U.S.)(39) | 105 | Positive | Correlation coefficient −0.42, p = .0001 for on-road driving performance |
| Freund, 2008 (U.S.)(32) | 108 | Positive | F(2,76) = 9.96, p < .001 for driving simulator performance |
| Ott, 2008 (U.S.)(53) | 121 | Positive | Pearson’s r = 0.48, p < .0005 for on-road driving evaluation score |
| Cushman, 1996 (U.S.)(38) | 123 | Positive | t = 7.10, p < .001 for on-road driving performance |
| Marottoli, 1998 (U.S.)(11) | 125 | Positive | Hazard Ratio 1.42 for self-reported events |
| Classen, 2008 (U.S.)(16) | 127 | Positive | Odds Ratio 2.5 (95% CI 1.0–5.9) for failing on-road driving test |
| Betz, 2009 (U.S.)(15) | 144 | No association | - |
| Dawson, 2009 (U.S.)(45) | 155 | No association | - |
| O’Connor, 2010 (U.S.)(42) | 160 | Positive | p < .001 for on-road driving evaluation outcome |
| Uc, 2005 (U.S.)(51) | 170 | Positive | Spearman correlation r = −0.45, p < .0001 for Landmark and Traffic Identification Test on a driving simulator |
| Freund, 2008 (U.S.)(33) | 176 | No association | - |
| Uc, 2006 (U.S.)(52) | 176 | Positive | Odds Ratios for unsafe outcomes on driving simulator: 1.22 (95% CI 1.01–1.46) for crash or risky avoidance behaviour, 1.31 (95% CI 1.12–1.54) for abrupt slowing, 1.17 (95% CI 1.02–1.35) for premature stopping |
| Uc, 2006 (U.S.)(25) | 230 | Positive | Spearman correlation r = 0.35, p < .01 for Trails B-A for at-fault safety errors on driving simulator |
| Wood, 2008 (Australia)(34) | 270 | Positive | t(55.6) = −3.15, p < .01 for on-road driving evaluation outcome |
| Rozzini, 2012 (Italy)(41) | 297 | Positive | Odds Ratio 2.3 (95% CI 1.06–4.9), p < .03 for self-reported crash |
| Kantor, 2004 (U.S.)(29) | 664 | Positive Reports positive association as cues needed to complete Trails B – methodology for determining “cue score” was not mentioned. |
Statistical analysis for Trails B alone not provided in clear terms |
| Staplin, 2003 (U.S.) (original MaryPODS data)(13) | 1876 | Positive The original data included two years of prospective crash data. |
Odds Ratio 3.50, p < .01 for at-fault crashes; Odds Ratio 1.72, p < .01 for frequencies of violations |
| Staplin, 2003 (U.S.) (updated MaryPODS data)(35) | 1876 | No association This updated analysis included one additional year of driving experience. |
- |
| Ball, 2006 (U.S.)(12) | 1910 | Positive | Odds Ratio 1.21 (95% CI 1.01–1.44), p = .04 for future at-fault crashes |
| Stutts, 1998 (U.S.)(37) | 3238 | Positive | Odds Ratio 1.06 (95% CI 1.01–1.11) for crash involvement |
None of the studies justified sample sizes via formal calculations. The sample sizes of many of the studies were small, with 24 (51.1%) studies having fewer than 100 participants (Table 2). Eleven of these 24 studies with N < 100 did not find an association of Trails B with driving safety. Stated another way, of the 15 studies showing no association (shaded in gray in Table 2), 11 (73.3%) had small sizes of ≤ 100. The remaining four studies with no association had sample sizes of 144, 155, 176, and 1,876.
Table 3 shows the studies that reported cut-off values for Trails B in predicting fitness-to-drive. Eight of the 47 studies (17.0%) reported cut-off values for Trails B from various sources. Five of these studies reported cut-off values derived from analysis of their data (i.e., primary research): 90 seconds,(10) 133 seconds,(11) 147 seconds,(12) 180 seconds,(13) and < 3 errors.(14)
TABLE 3.
Studies reporting Trails B cut-off values
| Author, Year (Country) | Reported Trails B Cut-off Value | Source of Reported Cut-off |
|---|---|---|
| Hargrave, 2012 (U.S.)(10) | 90 seconds | Analysis of primary driving research |
| Marottoli, 1998 (U.S.)(11) | 133 seconds | |
| Ball, 2006 (U.S.)(12) | 147 seconds | |
| Staplin, 2003 (U.S.) (original MaryPODS data)(13) | 180 seconds | |
| Mazer, 1998 (Canada)(14) | <3 errors | |
| Betz, 2009 (U.S.)(15) | 180 seconds | References (Wang 2003(18) and Tombaugh 2004(6))a |
| Classen, 2008 (U.S.)(16) | 3 minutes | References (Fals-Stewart 1992(20) and Franzen 1996(21))a |
| Bliokas, 2011 (Australia)(17) | ≥ 292 seconds | Reference (Lezak 1983(19))a |
Cut-offs provided in these studies are not based on primary driving research.
Three studies reported cut-off values from references cited within their papers: 180 seconds (3 minutes)(15,16) and ≥ 292 seconds.(17) Two of these references (Table 3) are not original research,(18,19) and the remaining three references are not driving studies.(6,20,21) The 292 second cut-off was derived from a neuropsychology textbook,(22) not a driving study.
Therefore, in addition to the three continuing medical education articles(2,7,8) recommending a 3 minute or 3 error cut-off (the ‘3 or 3 rule’), this systematic review uncovered four additional articles supporting this cut-off (15,13,16,14) and three other studies recommending even shorter time cut-offs ranging from 90 seconds to 147 seconds.(10, 11, 12)
DISCUSSION
Some have argued that no in-office tests can determine fitness-to-drive in all situations. This statement is correct, but is often misinterpreted as meaning in-office tests can never be used to determine fitness-to-drive in any situation. While it is obvious that no single in-office tests can be expected to be able to determine fitness-to-drive in all situations, it is a fundamental error in logic to assume therefore that in-office tests cannot determine fitness-to-drive in some situations.
To illustrate the point, as performance on tests such as Trails B progressively worsens with longer completion times and/or more errors, then clinicians should become increasingly comfortable stating a patient “has a potential functional impairment that may increase the risk of crash”. For instance, if a patient took 10 minutes to complete Trails B and made ten errors with no concerns regarding the validity of the test, then most physicians would likely feel justified in sending this information to their Ministry of Transportation as a finding that could impact on fitness-to-drive.
The extreme findings described above represent situations in which physicians can determine fitness-to-drive using in-office tests. Situations in which deficits are less glaring are more challenging. One way to address more borderline situations is for physicians to carefully consider precisely what they are being asked to evaluate. In Ontario, Canada, the Highway Traffic Act requires the following:
203. (1) Every legally qualified medical practitioner shall report to the Registrar the name, address and clinical condition of every person sixteen years of age or over attending upon the medical practitioner for medical services who, in the opinion of the medical practitioner, is suffering from a condition that may make it dangerous for the person to operate a motor vehicle. R.S.O. 1990, c. H.8, s. 203.(1)
In Ontario, physicians are not asked to determine fitness-to-drive (i.e., they are not asked to report patients as fit or unfit to drive), but rather are asked to report findings that may make it dangerous for the person to drive. The Ministry of Transportation retains responsibility for the final determination of fitness-to-drive. When viewed from this perspective, when selecting Trails B cut-offs that may indicate functional impairment that may impact on fitness-to-drive rather than as a final determination of fitness-to-drive, then Trails B cut-offs of 3 minutes or 3 errors (the ‘3 or 3 rule’) remain reasonable to consider when deciding whether or not to bring findings to the attention of the Ministry of Transportation. It is entirely appropriate that the Ministries of Transportation remain responsible for the final determination of fitness-to-drive rather than off-loading their responsibility on MDs.
It is also critical that tests such as Trails B not be misused—they must be accurately interpreted in the context of a number of critical considerations, in order to ensure that they are a valid reflection of function.(1) In order to avoid generating false results, Trails B scores should always be interpreted in the overall clinical context when determining fitness-to-drive.(7) The clinician should confirm that the Trails B results are consistent with the history provided by caregivers and other tests. Low scores must be verified as not to be due to confounding variables such as language barrier, low education, dyslexia, performance anxiety, depression, or sensory deficits, for example.
The administration of Trails B should also be standardized, as cognitive performance can be influenced by many factors. Ideally, all assessors should receive identical instructions on test administration. A practical recommendation may be that assessors receive training through continuing medical education.
For a review of considerations in applying in-office tests to the assessment of fitness-to-drive, please see page 11 of http://www.canadiangeriatrics.ca/default/index.cfm/linkservid/0D194943-EF73-7DAB-77450BB92BFF239A/showMeta/0/.(7) Furthermore, tests such as Trails B can be employed within a more detailed assessment process, as described in http://www.cfp.ca/content/56/11/1123.full.pdf+html?sid=6ddf379a-874a-4d6f-9c64-02c6bf939312.(2)
The evidence from the Tombaugh article(6) (that the mean Trails B score for all age groups is < 3 minutes and only a small number of outliers have Trails B > 3 minutes) and the articles listing fitness-to-drive cut-offs of 3 minutes or 3 errors,(15,13,16,14) support the finding that the best evidence-informed cut-offs we have to date are 3 minutes or 3 errors, as described in three continuing medical education articles.(2,7,8)
In this systematic review, none of the studies justified sample sizes via formal calculations. Eleven of the 15 studies which showed no association between Trails B and driving had small sample sizes of ≤ 100. Due to the risk of type II (beta) errors (i.e., false negative results caused by inadequate sample size or insufficient power), the findings of these 11 small studies cannot be interpreted with any degree of confidence (i.e., we cannot tell if they are true negative or false negative studies). This concern may also be true for the additional three negative studies with sample sizes ranging from 144 to 176.
A limitation of the Trail Making Test is that it requires knowledge of the numbers and letters used in the English language and, thus, may not be appropriate for individuals whose primary language does not employ similar letters and numbers or those who are illiterate. One instrument that has been developed to address this concern is the Color Trails Test (CTT). The CTT is a language-free analogue of the Trails test designed to be applicable across various cultural contexts. Two studies(23,24) (Table 2) looked at the CTT and its association with ability to predict fitness-to-drive. CTT 2 is similar to Trails B. It has two sets of 25 numbers in yellow and pink circles with instructions to connect the numbers in ascending order alternating between the two color sets. Both studies failed to show an association between CTT 2 and driving. However, it should once again be noted that both studies had small sample sizes (N = 29 and 30) and did not show sample size calculations. Therefore, as discussed above, this could have created possible false negative results in both studies.
CONCLUSION
While the evidence for Trails B cut-offs of 3 minutes or 3 errors (the ‘3 or 3 rule’) is limited, this systematic review reveals that these represent the best evidence-informed cut-offs available to date. It is logical to assume that as the test score worsens (e.g., the time to completion and/or the numbers of errors increase), the person’s fitness-to-drive also worsens (i.e., risk of crash increases). It is, at the very least, reasonable for physicians to consider reporting findings to their Ministry of Transportation if the Trails B score is worse than 3 minutes or 3 errors, provided the test results are felt to be a valid reflection of function.
The body of evidence for Trails B cut-off scores is limited, in part, due to major methodological limitations of driving research uncovered in this study including: (1) lack of justification of sample size making the interpretation of small negative trials impossible as some negative findings may represent Type II or Beta Error (i.e., falsely negative findings due to inadequate sample size/insufficient power); and (2) the fact that most research is focused on associations but often ignores the derivation of cut-off scores, resulting in findings that are not clinically useful.
Not only is more research into Trails B cut-offs needed, but the quality of the research being done (i.e., the methodological standards) must improve. Recommendations for future driving research should therefore include:
The determination of sample size to prevent future small studies from reporting potentially falsely negative findings due to inadequate sample size/insufficient power (Type II or Beta Error). The fact that such sample size calculations are challenging does not justify their exclusion.
The determination of potential clinically useful cut-off scores using Receiver Operating Characteristic (ROC) curve analytic techniques that plot sensitivity vs. 1 - specificity to permit the evaluation of the properties (e.g., sensitivity and specificity) of all potential cut-offs.
Given that there are likely no perfect cut-off scores with perfect sensitivity and specificity, techniques (e.g., Delphi techniques) that balance the risks and benefits of different cut-off scores, derived from ROC analyses, should be incorporated into driving research. Ultimately decisions regarding the best cut-offs need to be based on balancing the risks of missing cases of unsafe drivers vs. the risk of inappropriate loss of driving privileges.
Exploring the use of two cut-off scores to promote Trichotomization—see page 11 of http://www.canadiangeriatrics.ca/default/index.cfm/linkservid/0D194943-EF73-7DAB-77450BB92BFF239A/showMeta/0/(7) and http://onlinelibrary.wiley.com/doi/10.1111/j.1532-5415.2006.00967.x/pdf.(22)
Exploring different scoring methods for Trails B such as Trails (B-A)(25,26,27,28) and Trails B/A.(29) Trails (B-A) has been described as reflecting “the attention and set-switching components of Trails B independent of psychomotor speed”(26) and is often considered the standard index of set-shifting. It is also “a measure of global executive function”.(27) It has been examined in various driving studies with Parkinson’s Disease patients,(25,26,27) and has been found to be a good predictor of driving safety. It is thought that “the flexibility of the cognitive system”, as tested by Trails B-A, “allows drivers to cope with dynamic traffic situations”.(28) Although it is certainly a measure that is worth examining, we chose not to investigate cut-off scores for Trails (B-A) in this systematic review because current guidelines from medical associations recommend the use of Trails B only, not Trails B-A.
-
Different forms of Trails B that can overcome literacy barriers such as Color Trails.(23,24)
In fact, we do not need to wait to add to this body of evidence. Researchers who have previously published Trails B research (or their MSc and PhD students) can immediately study the following in their existing databases: i) dichotomization via single cut-off scores (both time and number of errors), ii) trichotomization via two cut-off scores (both time and number of errors), and iii) novel scoring methods such as Trails (B – A) and Trails B/A.
Acknowledgments
We wish to thank Debbie Ayotte, librarian, for her extensive assistance with literature searches.
CONFLICT OF INTEREST DISCLOSURES
The authors declare that no conflicts of interest exist. Neither author has received financial support from private industry for work on the assessment of fitness-to-drive. Both authors were involved in the preparation of this manuscript.
REFERENCES
- 1.CMA CMA driver’s guide: determining medical fitness to operate motor vehicles (8th Edition) Available from: http://www.cma.ca/driversguide.
- 2.Molnar F, Simpson C. Approach to assessing fitness to drive in patients with cardiac and cognitive conditions. Can Fam Physician. 2010;56(11):1123–29. Available from: http://www.cfp.ca/content/56/11/1123.full.pdf+html?sid=a5434c3c-fa40-4c13-b5fc-3297d24d60e6. [PMC free article] [PubMed] [Google Scholar]
- 3.Canadian Council of Motor Transport Administrators Determining driver fitness in Canada: Part 1: A model for the administration of driver fitness programs and Part 2: CCMTA medical standards for drivers (Version: Draft 8, 2011) Available from: http://www.ccmta.ca/english/pdf/medical_admin_process_part_1_may2011.pdf.
- 4.Driver and Vehicle Licensing Agency Review of medical driver licensing (February 2006) Available from: http://www.dft.gov.uk/dvla/medical/medical_advisory_information/reviewofdm.aspx.
- 5.American Medical Association Physician’s guide to assessing and counseling older drivers (September 2003) Available from: http://www.nhtsa.dot.gov/people/injury/olddrive/OlderDriversBook.
- 6.Tombaugh T. Trail Making Test A and B: normative data stratified by age and education. Arch Clin Neuropsychol. 2004;19(2):203–14. doi: 10.1016/S0887-6177(03)00039-8. [DOI] [PubMed] [Google Scholar]
- 7.Molnar F, Rapoport M, Roy M. Dementia and driving: maximizing the utility of in-office screening and assessment tools. CGS. 2012;2(2):11–14. Available from: http://www.canadiangeriatrics.ca/default/index.cfm/linkservid/0D194943-EF73-7DAB-77450BB92BFF239A/showMeta/0/ [Google Scholar]
- 8.Byszewski A, Molnar F, Rapoport M, et al. Practical experience-based approaches to assessing fitness to drive in dementia. Geriatr Aging. 2009;12(2):83–92. [Google Scholar]
- 9.Moher D, Liberati A, Tetzlaff J, et al. Preferred reporting items for systematic reviews and meta-analyses: the PRISMA statement. Ann Intern Med. 2009;151(4):264–69. doi: 10.7326/0003-4819-151-4-200908180-00135. [DOI] [PubMed] [Google Scholar]
- 10.Hargrave D, Nupp J, Erickson R. Two brief measures of executive function in the prediction of driving ability after acquired brain injury. Neuropsychol Rehabil. 2012;22(4):489–500. doi: 10.1080/09602011.2012.662333. [DOI] [PubMed] [Google Scholar]
- 11.Marottoli R, Richardson E, Stowe M, et al. Development of a test battery to identify older drivers at risk for self-reported adverse driving events. J Am Geriatr Soc. 1998;46(5):562–68. doi: 10.1111/j.1532-5415.1998.tb01071.x. [DOI] [PubMed] [Google Scholar]
- 12.Ball KK, Roenker DL, Wadley VG, et al. Can high-risk older drivers be identified through performance-based measures in a Department of Motor Vehicles setting? J Am Geriatr Soc. 2006;54(1):77–84. doi: 10.1111/j.1532-5415.2005.00568.x. [DOI] [PubMed] [Google Scholar]
- 13.Staplin L, Lococo K, Gish K, et al. Model driver screening and education program. Final technical report. Volume 2: Maryland Pilot Older Driver Study. Report no. DOT HS 809 583. Washington (DC): National Highway Traffic Safety Administration; 2003. [Google Scholar]
- 14.Mazer B, Korner-Bitensky N, Sofer S. Predicting ability to drive after stroke. Arch Phys Med Rehabil. 1998;79(7):743–50. doi: 10.1016/S0003-9993(98)90350-1. [DOI] [PubMed] [Google Scholar]
- 15.Betz M, Fisher J. The Trail-Making Test B and driver screening in the emergency department. Traffic Inj Prev. 2009;10(5):415–20. doi: 10.1080/15389580903132819. [DOI] [PubMed] [Google Scholar]
- 16.Classen S, Horgas A, Awadzi K, et al. Clinical predictors of older driver performance on a standardized road test. Traffic Inj Prev. 2008;9(5):456–62. doi: 10.1080/15389580802260026. [DOI] [PubMed] [Google Scholar]
- 17.Bliokas V, Taylor J, Leung J, et al. Neuropsychological assessment of fitness to drive following acquired cognitive impairment. Brain Injury. 2011;25(5):471–487. doi: 10.3109/02699052.2011.559609. [DOI] [PubMed] [Google Scholar]
- 18.Wang C, Kosinski C, Schwartzberg J, et al. AMA physician’s guide to assessing and counseling older drivers. Washington (DC): National Highway Traffic Safety Administration and American Medical Association; 2003. Available from: http://www.ama-assn.org/ama/pub/physician-resources/publichealth/promoting-healthy-lifestyles/geriatric-health/olderdriver-safety/assessing-counseling-older-drivers.page. [Google Scholar]
- 19.Lezak M. Neuropsychological assessment. 2nd ed. New York: Oxford University Press; 1983. [Google Scholar]
- 20.Fals-Stewart W. An interrater reliability study of the Trail Making Test (parts A and B) Perceptual Motor Skills. 1992;74(1):39–42. doi: 10.2466/pms.1992.74.1.39. [DOI] [Google Scholar]
- 21.Franzen M, Paul D, Iverson G. Reliability of alternate forms of the trail making test. Clin Neuropsychol. 1996;10(2):125–29. doi: 10.1080/13854049608406672. [DOI] [Google Scholar]
- 22.Molnar F, Patel A, Marshall S, et al. Clinical utility of office-based predictors of fitness to drive in persons with dementia: a systematic review. J Am Geriatr Soc. 2006;54(12):1809–24. doi: 10.1111/j.1532-5415.2006.00967.x. Available from: http://onlinelibrary.wiley.com/doi/10.1111/j.1532-5415.2006.00967.x/pdf. [DOI] [PubMed] [Google Scholar]
- 23.Elkin-Frankston S, Lebowitz B, Kapust L, et al. The use of the Color Trails Test in the assessment of driver competence: preliminary report of a culture-fair instrument. Arch Clin Neuropsychol. 2007;22(5):631–35. doi: 10.1016/j.acn.2007.04.004. [DOI] [PubMed] [Google Scholar]
- 24.Hartman-Maeir A, Bar-Haim Erez A, Ratzon N, et al. The validity of the Color Trail Test in the pre-driver assessment of individuals with acquired brain injury. Brain Inj. 2008;22(13–14):994–98. doi: 10.1080/02699050802491305. [DOI] [PubMed] [Google Scholar]
- 25.Uc E, Rizzo M, Anderson S, et al. Impaired visual search in drivers with Parkinson’s disease. Ann Neurol. 2006;60(4):407–13. doi: 10.1002/ana.20958. [DOI] [PubMed] [Google Scholar]
- 26.Scally K, Charlton J, Iansek R, et al. Impact of external cue validity on driving performance in Parkinson’s disease. Parkinson’s Dis. 2011 doi: 10.4061/2011/159621. Epub 2011 Jun 8. [DOI] [PMC free article] [PubMed] [Google Scholar]
- 27.Ranchet M, Paire-Ficout L, Marin-Lamellet C, et al. Impaired updating ability in drivers with Parkinson’s disease. J Neurol Neurosurg Psychiatry. 2011;82(2):218–23. doi: 10.1136/jnnp.2009.203166. [DOI] [PubMed] [Google Scholar]
- 28.Adrian J, Postal V, Moessinger M, et al. Personality traits and executive functions related to on-road driving performance among older drivers. Accid Anal Prev. 2011;43(5):1652–59. doi: 10.1016/j.aap.2011.03.023. [DOI] [PubMed] [Google Scholar]
- 29.Kantor B, Mauger L, Richardson V, et al. An analysis of an older driver evaluation program. J Am Geriatr Soc. 2004;52(8):1326–30. doi: 10.1111/j.1532-5415.2004.52363.x. [DOI] [PubMed] [Google Scholar]
- 30.Niewoehner P, Henderson R, Dalchow J, et al. Predicting road test performance in adults with cognitive or visual impairment referred to a veterans affairs medical center driving clinic. J Am Geriatr Soc. 2012;60(11):2070–74. doi: 10.1111/j.1532-5415.2012.04201.x. [DOI] [PMC free article] [PubMed] [Google Scholar]
- 31.Petrakos D, Freund B. Driving habits of older drivers 3 months before driving evaluation. Topic Geriatr Rehabil. 2009;25(2):118–34. [Google Scholar]
- 32.Freund B, Colgrove L. Error specific restrictions for older drivers: promoting continued independence and public safety. Accid Anal Prev. 2008;40(1):97–103. doi: 10.1016/j.aap.2007.04.010. [DOI] [PubMed] [Google Scholar]
- 33.Freund B, Colgrove L, Petrakos D, et al. In my car the brake is on the right: pedal errors among older drivers. Accid Anal Prev. 2008;40(1):403–09. doi: 10.1016/j.aap.2007.07.012. [DOI] [PubMed] [Google Scholar]
- 34.Wood J, Anstey K, Kerr G, et al. A multidomain approach for predicting older driver safety under in-traffic road conditions. J Am Geriatr Soc. 2008;56(6):986–93. doi: 10.1111/j.1532-5415.2008.01709.x. [DOI] [PubMed] [Google Scholar]
- 35.Staplin L, Gish K, Wagner E. MaryPODS revisited: updated crash analysis and implications for screening program implementation. J Safety Res. 2003;34(4):389–97. doi: 10.1016/j.jsr.2003.09.002. [DOI] [PubMed] [Google Scholar]
- 36.Szlyk J, Myers L, Zhang Y, et al. Development and assessment of a neuropsychological battery to aid in predicting driving performance. J Rehabil Res Dev. 2002;39(4):483–96. [PubMed] [Google Scholar]
- 37.Stutts J, Stewart J, Martell C. Cognitive test performance and crash risk in an older driver population. Accid Anal Prev. 1998;30(3):337–46. doi: 10.1016/S0001-4575(97)00108-5. [DOI] [PubMed] [Google Scholar]
- 38.Cushman L. Cognitive capacity and concurrent driving performance in older drivers. IATSS Res. 1996;20(1):38–45. [Google Scholar]
- 39.Tarawneh M, McCoy P, Bishu R, et al. Factors associated with driving performance of older drivers. Transportation Res Record. 1993;1405:64–71. [Google Scholar]
- 40.Emerson J, Johnson A, Dawson J, et al. Predictors of driving outcomes in advancing age. Psychol Aging. 2012;27(3):550–59. doi: 10.1037/a0026359. [DOI] [PMC free article] [PubMed] [Google Scholar]
- 41.Rozzini L, Riva M, Zanetti M, et al. The impact of cognitive deficit on self-reported car crashes in ultra-octogenarian population: data of an Italian population-based study. Int J Geriatr Psychiatry. 2012;28(6):562–66. doi: 10.1002/gps.3857. [DOI] [PubMed] [Google Scholar]
- 42.O’Connor M, Kapust L, Lin B, et al. The 4Cs (crash history, family concerns, clinical condition, and cognitive functions): a screening tool for the evaluation of the at-risk driver. J Am Geriatr Soc. 2010;58(6):1104–08. doi: 10.1111/j.1532-5415.2010.02855.x. [DOI] [PubMed] [Google Scholar]
- 43.Park S, Choi E, Lim M, et al. Association between unsafe driving performance and cognitive-perceptual dysfunction in older drivers. PM R. 2011;3(3):198–203. doi: 10.1016/j.pmrj.2010.12.008. [DOI] [PubMed] [Google Scholar]
- 44.Selander H, Lee H, Johansson K, et al. Older drivers: on-road and off-road test results. Accid Anal Prev. 2011;43(4):1348–54. doi: 10.1016/j.aap.2011.02.007. [DOI] [PubMed] [Google Scholar]
- 45.Dawson J, Anderson S, Uc E, et al. Predictors of driving safety in early Alzheimer disease. Neurology. 2009;72(6):521–27. doi: 10.1212/01.wnl.0000341931.35870.49. [DOI] [PMC free article] [PubMed] [Google Scholar]
- 46.Grace J, Amick M, D’Abreau A, et al. Neuropsychological deficits associated with driving performance in Parkinson’s and Alzheimer’s disease. J Int Neuropsychol Soc. 2005;11(6):766–75. doi: 10.1017/S1355617705050848. [DOI] [PMC free article] [PubMed] [Google Scholar]
- 47.Rizzo M, Reinach S, McGehee D, et al. Simulated car crashes and crash predictors in drivers with Alzheimer disease. Arch Neurol. 1997;54(5):545–51. doi: 10.1001/archneur.1997.00550170027011. [DOI] [PubMed] [Google Scholar]
- 48.Fox G, Bowden S, Bashford G, et al. Alzheimer’s disease and driving: prediction and assessment of driving performance. J Am Geriatr Soc. 1997;45(8):949–53. doi: 10.1111/j.1532-5415.1997.tb02965.x. [DOI] [PubMed] [Google Scholar]
- 49.Rizzo M, McGhee D, Dawson J, et al. Simulated car crashes at intersections in drivers with Alzheimer disease. Alzheimer Dis Assoc Disord. 2001;15(1):10–20. doi: 10.1097/00002093-200101000-00002. [DOI] [PubMed] [Google Scholar]
- 50.Ott B, Heindel W, Whelihan W, et al. Maze test performance and reported driving ability in early dementia. J Geriatr Psychiatry Neurol. 2003;16(3):151–55. doi: 10.1177/0891988703255688. [DOI] [PMC free article] [PubMed] [Google Scholar]
- 51.Uc E, Rizzo M, Anderson S, et al. Driver landmark and traffic sign identification in early Alzheimer’s disease. J Neurol Neurosurg Psychiatry. 2005;76(6):764–68. doi: 10.1136/jnnp.2004.049338. [DOI] [PMC free article] [PubMed] [Google Scholar]
- 52.Uc E, Rizzo M, Anderson S, et al. Unsafe rear-end collision avoidance in Alzheimer’s disease. J Neurol Sci. 2006;251(1–2):35–43. doi: 10.1016/j.jns.2006.08.011. [DOI] [PubMed] [Google Scholar]
- 53.Ott B, Festa E, Amick M, et al. Computerized maze navigation and on-road performance by drivers with dementia. J Geriatr Psychiatry Neurol. 2008;21(1):18–25. doi: 10.1177/0891988707311031. [DOI] [PMC free article] [PubMed] [Google Scholar]
- 54.Carr D, Barco P, Wallendorf M, et al. Predicting road test performance in drivers with dementia. J Am Geriatr Soc. 2011;59(11):2112–17. doi: 10.1111/j.1532-5415.2011.03657.x. [DOI] [PMC free article] [PubMed] [Google Scholar]
- 55.Whelihan W, DiCarlo M, Paul R. The relationship of neuropsychological functioning to driving competence in older persons with early cognitive decline. Arch Clin Neuropsychol. 2005;20(2):217–28. doi: 10.1016/j.acn.2004.07.002. [DOI] [PubMed] [Google Scholar]
- 56.Alexandersen A, Dalen K, Bronnick K. Prediction of driving ability after inconclusive neuropsychological investigation. Brain Inj. 2009;23(4):313–21. doi: 10.1080/02699050902788428. [DOI] [PubMed] [Google Scholar]
- 57.Lundqvist A, Alinder J. Driving after brain injury: self-awareness and coping at the tactical level of control. Brain Inj. 2007;21(11):1109–17. doi: 10.1080/02699050701651660. [DOI] [PubMed] [Google Scholar]
- 58.Devos H, Nieuwboer A, Tant M, et al. Determinants of fitness to drive in Huntington disease. Neurology. 2012;79(19):1975–82. doi: 10.1212/WNL.0b013e3182735d11. [DOI] [PubMed] [Google Scholar]
- 59.Soderstrom S, Pettersson R, Leppert J. Prediction of driving ability after stroke and the effect of behind-the-wheel training. Scand J Psychol. 2006;47(5):419–29. doi: 10.1111/j.1467-9450.2006.00550.x. [DOI] [PubMed] [Google Scholar]
- 60.Lundqvist A, Alinder J, Ronnberg J. Factors influencing driving 10 years after brain injury. Brain Inj. 2008;22(4):295–304. doi: 10.1080/02699050801966133. [DOI] [PubMed] [Google Scholar]
- 61.Novack T, Banos J, Alderson A, et al. UFOV performance and driving ability following traumatic brain injury. Brain Inj. 2006;20(5):455–61. doi: 10.1080/02699050600664541. [DOI] [PubMed] [Google Scholar]
- 62.Brooke M, Questad K, Patterson D, et al. Driving evaluation after traumatic brain injury. Am J Phys Med Rehabil. 1992;71(3):177–82. doi: 10.1097/00002060-199206000-00009. [DOI] [PubMed] [Google Scholar]
- 63.Crizzle A, Classen S, Winter S, et al. Associations between clinical tests and simulated driving performance in persons with epilepsy. Epilepsy Behav. 2012;23(3):241–46. doi: 10.1016/j.yebeh.2011.12.019. [DOI] [PubMed] [Google Scholar]


