

Abstract
We developed a flow cytometry method, chromosome flow fluorescence in situ hybridization (FISH), called CFF, to analyze repetitive DNA in chromosomes using FISH with directly labeled peptide nucleic acid (PNA) probes. We used CFF to measure the abundance of interstitial telomeric sequences in Chinese hamster chromosomes and major satellite sequences in mouse chromosomes. Using CFF we also identified parental homologs of human chromosome 18 with different amounts of repetitive DNA.
The chromosomal makeup of cells can be studied with various methods. The most common technique, karyotype analysis, uses chromosomes that are fixed onto slides. In combination with fluorescence in situ hybridization (FISH) this cytogenetic approach is used to detect deletions, translocations1 and copy-number variations2 on specific chromosomes. One can also study chromosomes in suspension using flow cytometry. Flow karyotyping uses fluorescent dyes specific for DNA on isolated chromosomes to cluster specific chromosomes based on their size and DNA content. Flow karyotyping has been used to study variations between human chromosomes3, to detect chromosomal anomalies, to map genes4 and to generate chromosome-specific libraries5. Ideally, one would also like use flow cytometry to study specific DNA sequences in chromosomes. However, there are very few reports using this approach. Polyamides probes that bind to the major groove of double stranded DNA were used to improve the discrimination of chromosome populations in bivariate flow karyograms6. It was also reported that hybridization of specific DNA probes on chromosome suspensions followed by microscopy enabled the detection of chromosomal rearrangements7. However, FISH on isolated chromosomes followed by flow cytometry has not been reported, most likely because chromosome suspensions are believed to poorly tolerate the harsh denaturation and wash steps required for in situ hybridization.
Synthetic oligonucleotide probes allow expansion of the scope of FISH beyond qualitative analyses. For example, quantitative FISH (Q-FISH) is used to measure telomere length by FISH using fluorescently labeled 5′-(CCCTAA)3-3′ peptide nucleic acid (PNA) oligonucleotide probes8. The uncharged peptide backbone of PNA permits annealing to complementary target sequences without the electrostatic repulsion inherent to negatively charged DNA or RNA probes, resulting in higher binding affinity for complementary single stranded DNA and a quantitative relationship between the number of bound fluorescent probes and the length of repetitive DNA target sequences. Q-FISH can be used to quantify telomere length in a chromosome-specific manner8, but acquisition and image data analysis from even a few dozen cells is labor-intensive. Flow FISH9,10, a method for quantitative measurement of telomere repeats in cells by flow cytometry, has a greater statistical power than Q-FISH, but can only be used to measure the average telomere length in cells without chromosome-specific information. Here we report a chromosome-specific, quantitative FISH method that is more rapid than Q-FISH with the high statistical power of flow FISH.
We based our protocol on the polyamine chromosome isolation procedure11, with minor modifications to suit particular cell types. First, we compared bivariate flow karyotypes of chromosome suspensions to that of chromosomes taken through the denaturation and wash steps of FISH before flow analysis using the standard Hoechst 33258 and chromomycin A3 dyes (Fig. 1a and Supplementary Fig. 1). Most chromosome clusters in bivariate plots of Hoechst 33258 versus chromomycin A3 fluorescence could still be recognized after FISH, albeit with some loss of resolution in larger Chinese hamster and human chromosomes. The resolution of mouse flow karyograms appeared to improve after denaturation (Supplementary Fig. 1). Taken together, these data suggest that FISH is compatible with flow karyotyping, enabling FISH analysis of specific chromosomes with PNA probes by flow cytometry.
Figure 1.
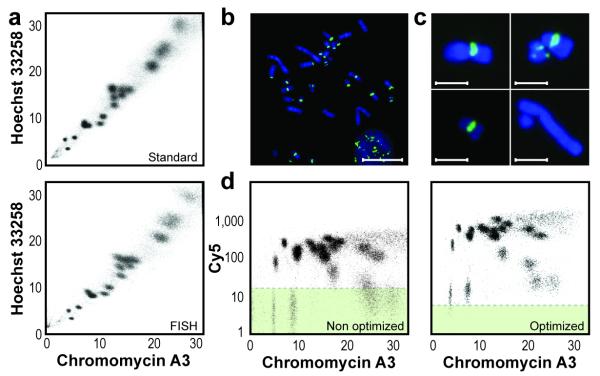
Preservation of flow karyograms after FISH enables chromosome-specific detection of interstitial telomere repeats in CHO cell chromosomes. (a) Hoechst 33258 and chromomycin A3 bivariate flow karyograms of chromosomes isolated from CHO cells using the polyamine method before (standard) and after denaturation of the sample in 70% formamide at 80 °C for 5 min (FISH). (b,c) Hybridization of a telomere probe (5′-Cy5-(CCCTAA)3-3′) on CHO cell metaphase spreads (b) or on chromosomes in suspension (c). Scale bars, 20 μM (b) and 5 μM (c). (d) Chromosome-specific hybridization pattern compared to the background fluorescence in chromosomes hybridized without probe (green background) before (nonoptimized) and after (optimized) selection of optimal hybridization conditions and instrument configuration.
Next, we used Chinese hamster ovary (CHO) cells to optimize the various steps involved in CFF. Hamster chromosomes contain regular 5′-(TTAGGG)n-3′ telomeric sequences as well as interstitial 5′-(TTAGGG)n-3′ sequences12 of variable size that are difficult to measure using traditional methods such as Q-FISH. Hybridization of a fluorescently labeled 5′-Cy5-(CCC-TAA)3-3′ PNA probe on metaphase chromosomes on slides or in suspension showed fluorescence signals corresponding to both telomeric and intrachromosomal 5′-(TTAGGG)n-3′ sequences (Fig. 1b,c). Compared to hybridization without probe, flow-cytometric analysis of chromosomes hybridized with the telomere probe revealed a wide range of Cy5 signal intensities, corresponding to different chromosome clusters (Fig. 1d). We confirmed the specificity of the signal by hybridizing chromosome suspensions with a Cy5-labeled probe to 5′-(TTAGGC)n-3′ repeats of Caenorhabditis elegans telomeres, which displayed no signal on metaphase spreads (data not shown), but had weak fluorescence proportional to chromosome size by flow cytometry, most likely reflecting nonspecific probe binding (Supplementary Fig. 2). We optimized the detection of specific fluorescence in CHO cell chromosomes (Fig. 1d and Supplementary Note 1, Supplementary Figs. 3 and 4) to maximize the distinction of the chromosome clusters by CFF. We validated CFF fluorescence measurements by direct comparison to telomere repeat measurements using Q-FISH (Supplementary Note 1 and Supplementary Fig. 5). We obtained an excellent correlation between CFF and Q-FISH, albeit one that was not linear for very bright fluorescence signals. We presume that the very bright fluorescence from the longest repeat in some CHO cell chromosomes was poorly resolved using Q-FISH because of limitations in the dynamic range of our digital image cytometry setup.
We next tested whether we could transfer conditions optimized for CHO cell chromosomes to different species and PNA probes. We had previously shown that unidirectional, highly repetitive major satellite sequences are present in all mouse chromosomes except the Y chromosome13. We studied the length variability of major satellite sequences on chromosomes isolated from mouse cell lines of different genetic background: 3T6 (Swiss-albino) fibroblasts, C166 (NMRI/GSF × CD-1) endothelial cells and C1 (129/S) embryonic stem cells. Using a PNA probe specific for major satellite DNA, we observed chromosome-specific fluorescence patterns that varied with the mouse genetic background (Fig. 2a and Supplementary Fig. 6). Detection of satellite sequences by CFF improved the resolution of chromosome populations that were poorly resolved in the bivariate flow karyogram (Supplementary Fig. 7). As major satellite DNA repeat expansion patterns differ in mouse chromosomes from distinct backgrounds, CFF appears an attractive method to both analyze and sort chromosomes from hybrid cells. Alternatively, CFF could provide more resolution than in-gel analysis for the detection of satellite DNA instability.
Figure 2.

Chromosome and allele-specific analysis of satellite DNA in mouse and human cell lines. (a) Bivariate flow karyograms of Hoechst 33258 versus chromomycin A3 fluorescence (top panel) and Cy5 versus chromomycin A3 (bottom panel) of C166 mouse chromosomes hybridized with a major satellite PNA probe (5′-Cy5-GACGTGGAATATGGCAAG-3′). (b) Bivariate flow karyograms of Hoechst 33258 versus chromomycin A3 (top panel) and Cy5 versus chromomycin A3 (bottom panel HT1080 human fibrosarcoma chromosomes hybridized with a PNA probe (5′-Cy5-GAGAATTGAACCACCG-3′) specific for L1.84 satellite DNA. Chromosome 18 is shown in red. (c) The Cy5 fluorescence intensity histogram of chromosomes presented in b shows two peaks above background fluorescence (*), corresponding to the two chromosome 18 populations (** and ***) shown in d. Median Cy5 fluorescence and event frequencies are listed. (d) Hybridization of the L1.84 probe on HT1080 metaphase spreads. Note two copies will dull Cy5 fluorescence (**) and one with brighter fluorescence (***). Scale bar, 15 μM.
Finally, we tested the specificity and the sensitivity of CFF by hybridizing human chromosomes with a PNA probe to chromosome 18-specific pericentromeric alpha satellite L1.84 (ref. 14). Hybridization of L1.84 PNA on chromosomes isolated from HT1080 human fibrosarcoma cells identified two populations with distinct Cy5 fluorescence, corresponding to the two parental homologs in those cells (Fig. 2b). Chromosome 18 Cy5 intensity peaks were present at a 2:1 ratio, suggesting a trisomy (Fig. 2c). Hybridization of the same probe onto metaphase spreads confirmed both the trisomy and the L1.84 repeat length difference between the parental homologs (Fig. 2d). The length and sequence diversity of alpha satellite arrays in human chromosomes15 suggests that CFF using various specific alpha satellite probes could enable the purification of parental chromosomes homologs by flow cytometry. Sequencing of libraries built from such purified chromosome populations could be useful to establish haplotypes.
CFF enabled rapid, chromosome-specific measurements of specific DNA repeats. The approach appears promising for quantification of telomere repeats per chromosome and for detection of rare events that can be missed when analyzing limited cell numbers by Q-FISH. We expect that CFF will find many applications for analysis and sorting of chromosomes based on specific DNA repeat sequences. Simultaneous use of multiple probes labeled with different, non-overlapping fluorochromes is expected to increase the analytical power of CFF.
Online Methods
Cell culture and chromosome isolation
CHO cells (American Type Culture Collection; ATCC) were grown in MEM-α (Gibco) supplemented with 10% FCS (Hyclone), 200 μM l-glutamine and penicillin streptomycin (Gibco). C166 mouse epithelial cells (ATCC), 3T6 mouse fibroblasts (ATCC) and HT1080 human fibrosarcoma cells were grown in DMEM (StemCell Technology) supplemented with 10% FCS, 200 μM l-glutamine and penicillin-streptomycin. C1 mouse embryonic stem cells16 were grown in DMEM (StemCell) supplemented with 20% FCS, 100 ng ml−1 leukemia inhibitory factor (LIF), nonessential amino acids (Gibco), sodium pyruvate, l-glutamine and penicillin streptomycin (Invitrogen).
Chromosome suspensions were prepared using a modified polyamine-based method11,17 to obtain good-quality flow karyotypes that can be stored up to a few weeks without degradation18. Briefly, exponentially growing cultures were blocked with 0.1 μg ml−1 of colcemid (Gibco) for 3-4 h, and mitotic cells were collected by mitotic shake off. The cells were centrifuged at 350g for 5 min at room temperature (18-25°C). The pellets were resuspended in hypotonic solution (55 mM KCl and 20 mM HEPES; pH 7.4) for 3 to 15 min, depending on the cell type. We used 5 ml of hypotonic solution when working with ~200,000 or fewer isolated mitotic cells and 10 ml when more cells were collected. CHO cells were treated in hypotonic solution for 15 min, C166 and 3T6 for 5 min, C1 for 3 min and HT1080 for 12 min. The swollen cells were then spun down at 675g for 3 min at room temperature (18-25°C) and resuspended in freshly prepared ice-cold chromosome isolation buffer (2 mM EDTA, 5 mM EGTA, 15 mM Tris-HCl, 80 mM KCl, 20 mM NaCl, 715 mM 2-mercaptoethanol, 0.1% Triton X-100, 0.2 mM spermine and 0.5 mM spermidine). Approximately 1 ml of chromosome isolation buffer per 200,000 collected mitotic cells was used. After 15 min of incubation on ice, the chromosomes were liberated by vigorously vortexing for 75 s. The number of chromosomes obtained per isolation was estimated by counting the number of collected cells and multiplying this number with the estimated mitotic index and the known ploidy. The chromosome suspensions were stored at 4 °C for up to three weeks before use, and we stained them with 40 μg ml−1 chromomycin A3 and 2 μg ml−1 Hoechst 33258 (Sigma) at least 4 h before analysis.
PNA FISH on suspension chromosomes
We pretreated 1-10 million isolated chromosomes per condition with 100 U ml−1 of RNase T1 (Sigma) for 20 min at room temperature (18-25°C). After testing variables as described in Supplementary Note 1, the following hybridization and wash conditions were used. The chromosomes were spun down at 350g for 5 min at 4 °C, and resuspended in 100 μl of hybridization solution (70% deionized formamide (EMD), 0.25% blocking reagent (Perkin Elmer), 5% MgCl2 buffer and 10 mM Tris-HCl; pH 7.4) prewarmed at 80 °C. The PNA probes 5′-Cy5-(CCCTAA)3-3′ (vertebrate telomere probe), 5′-Cy5-(GCCTAA)3-3′ (C. elegans telomere probe) and 5′-Cy5-GAGAATTGAACCACCG-3′ (L1.84 satellite probe) were a gift from Boston Probes (now Applied Biosystems). The 5′-Cy5-GACGTGGAATATGGCAAG-3′ (mouse major satellite DNA) PNA probe was obtained from Panagene. PNA probes were used at a concentration of 0.3 μg ml−1 (telomere probes), 0.2 μg ml−1 (L1.84 probe) and 0.75 μg ml−1 (major satellite probe). Nonoptimized conditions for hybridization of the telomere probe on CHO cell chromosomes were 3 μg ml−1 probe, 5 min denaturation time and two washes after hybridization. The DNA in chromosome suspensions was denatured at 80 °C for 5 min and allowed to hybridize at room temperature (18-25°C) for 60 min. Excess probe was washed twice in 0.5 ml prewarmed hybridization solution for 5 min at 37 °C. Chromosome pellets were resuspended in 350 μl of chromosome isolation buffer, and stained with chromomycin A3 and Hoechst 33258 overnight at 4 °C. Chromosome preparations were filtered using 35 μm cell strainer cap tubes (BD Bioscience) to remove any large clumps that may have been created during the hybridization procedure.
Chromosome sorting and analysis
Chromosome sorting and fluorescence analysis was performed using a BD Influx cell sorter (BD Cytopeia) equipped with two Coherent I305C Argon lasers. The first laser was tuned to emit UV light (351.1 nm) for Hoechst 33258 excitation, and the second laser was tuned to 457.9 nm for chromomycin A3 excitation. Both lasers were used at 200 mW power. Initial experiments (data presented in Fig. 1d and Supplementary Figs. 2 and 4) used a Coherent Radius 30 mW 635 nm diode laser for Cy5 excitation, which was replaced by a 125 mW 642-nm diode laser (Melles Griot 56CRH/52796) for ‘optimized’ experiments. Cy5 excitation power was varied (Supplementary Note 1) using the 125 mW 642 nM laser as follows: 10 mW and 50 mW were obtained using neutral density filters, 117 mW was delivered without any filters, and 180 mW was obtained using a higher-voltage power supply. Excitation power intensity was measured with a laser power meter. Nonoptimized conditions for the detection of Cy5 fluorescence were 30 mW 635 nM laser with 60 mW of PMT amplification. Optimized conditions for the detection of Cy5 fluorescence were 125 mW, 642 nM laser with 50 mW of PMT amplification. Hoechst, chromomycin A3 and Cy5 emission were collected with a 460/50 bandpass filter, a 470-nm long-pass filter and a 670/40 bandpass filter (Semrock), respectively. Hoechst was used as the trigger signal for acquisition. Data on pulse width, Hoechst, chromomycin A3 and forward scatter were collected for 50,000–100,000 events per condition. Flow cytometry data were acquired with the Software Spigot (BD Cytopeia) and results were analyzed with FlowJo version 8.8.6 software (Tree Star). Debris and clumps were excluded from the flow karyograms by gating on high chromomycin A3 and low pulse width (Supplementary Fig. 8).
Q-FISH on metaphase spreads and sorted chromosomes
Q-FISH8 was performed on CHO cell and HT1080 cell metaphase spreads as well as on sorted CHO cell chromosome populations. Metaphase spreads were prepared according to standard procedures. Briefly, exponentially growing cells were blocked using 0.1 μg ml−1 of colcemid (Gibco) for 3-4 h, collected and swollen in hypotonic solution (55 mM KCl and 20 mM HEPES; pH 7.4) for 10 min and fixed 3 times in methanol:acetic acid 3:1. Cells were dropped on slides to obtain metaphase spreads that were taken through the Q-FISH protocol. CHO cell chromosome populations (Supplementary Note 1) were sorted directly onto a microscope slide using the BD Influx cell sorter, fixed for 20 min in 4% formaldehyde and air-dried before being processed through Q-FISH. For the Q-FISH procedure, the slides were fixed with 4% formaldehyde, treated with 1 mg ml−1 pepsin (Sigma), dehydrated in 70%, 90% and 100% ethanol and air-dried. Slides were denatured for 3 min at 80 °C in hybridization mixture (70% formamide, 0.25% blocking reagent (Perkin Elmer), 5% MgCl2 buffer and 10 mM Tris-HCl; pH 7). Probes were used at a concentration of 0.2 μg ml−1 of Cy5-L1.84 PNA (HT1080 metaphase spreads), 0.5 μg ml−1 of Cy5-telomere PNA (CHO cell metaphase spreads) or 0.5 μg ml−1 of Cy3-telomere PNA (sorted CHO cell chromosome populations). Hybridization was performed at room temperature (18-25°C) for 1 h before slides were washed with 70% formamide and 10 mM Tris-HCl (pH 7.2) twice for 15 min each, and with a solution of 0.05 M Tris-HCl (pH 7.2), 0.15 M NaCl and 0.05% Tween-20 three times for 5 min each. Slides were dehydrated, air-dried, counterstained with 0.2 μg ml−1 4′,6-diamidino-2- phenylindole (DAPI) and mounted in antifade solution Vectashield (Vector Laboratories). Fluorescence signal was visualized on a Zeiss Axioplan 2 microscope equipped with an X-Cite 120 high-pressure metal lamp (EXFO) using a 63× oil-immersion objective (Carl Zeiss) and the images were acquired with an Axiocam MRM digital camera controlled by Isis version 5 software (Metasystems). The following filters (Chroma) were used in our microscope setup: 31000 DAPI (350/50 excitation, 400 LP dichroic and 460/50 emission); 41007 Cy3 (535/50 excitation, 565 LP dichroic and 610/75 emission); 41008 Cy5 (620/60 excitation, 660 LP dichroic and 700/75 emission). Separate DAPI and Cy3 images were analyzed with the TFL-TELO V.2 software19 for quantification of interstitial telomere repeats on sorted CHO cell chromosomes (Supplementary Fig. 5).
Statistical analyses
The Q-FISH frequency histograms as well as measured median telomere length and 25th and 75th percentiles (Supplementary Fig. 5c) were obtained using Microcal Origin software version 5.0 (MicroCal). The CFF frequency histograms as well as median Cy5 value and 25th and 75th percentiles (Supplementary Fig. 5c) were obtained using FlowJo version 8.8.6 software (Tree Star). Pearson coefficient correlation (alpha = 0.05) between CFF (median Cy5) and Q-FISH measurements (median telomere length) for the 7 XY pairs corresponding to the six sorted chromosome populations (Supplementary Note 1 and Supplementary Fig. 5) was calculated using GraphPad Prism 5 software (GraphPad Software).
Supplementary Material
ACKNOWLEDGMENTS
We thank B. Harrison, G. de Jong, L. Marmolejo and W. Xu for help with flow cytometry, and G. de Jong, S. Vanderbyl and L. Chavez for help with preparation of chromosome suspensions. HT1080 human fibrosarcoma cells (clone B49.5) were kindly provided by Wendy Bickmore, MRC Human Genetics Unit, Edinburgh, U.K. Work in the Lansdorp laboratory is supported by grants from the Canadian Institutes of Health Research (MOP38075 and GMH79042) and the Canadian Cancer Society (with support from the Terry Fox Run).
Footnotes
COMPETING FINANCIAL INTERESTS
The authors declare competing financial interests: P.M.L. is a founding shareholder in Repeat Diagnostics Inc., a company specializing in leukocyte telomere length measurements using flow FISH.
AUTHOR CONTRIBUTIONS
J.B. performed experiments designed by J.B. and P.M.L J.B. and P.M.L. wrote the paper.
REFERENCES
- 1.Bentz M, et al. Blood. 1994;83:1922–1928. [PubMed] [Google Scholar]
- 2.Kallioniemi A, Visakorpi T, Karhu R, Pinkel D, Kallioniemi OP. Methods. 1996;9:113–121. doi: 10.1006/meth.1996.0015. [DOI] [PubMed] [Google Scholar]
- 3.Mefford H, van den Engh G, Friedman C, Trask BJ. Hum. Genet. 1997;100:138–144. doi: 10.1007/s004390050479. [DOI] [PubMed] [Google Scholar]
- 4.Van Dilla MA, Deaven LL. Cytometry. 1990;11:208–218. doi: 10.1002/cyto.990110124. [DOI] [PubMed] [Google Scholar]
- 5.Davies KE, Young BD, Elles RG, Hill ME, Williamson R. Nature. 1981;293:374–376. doi: 10.1038/293374a0. [DOI] [PubMed] [Google Scholar]
- 6.Gygi MP, et al. Nucleic Acids Res. 2002;30:2790–2799. doi: 10.1093/nar/gkf406. [DOI] [PMC free article] [PubMed] [Google Scholar]
- 7.Dudin G, et al. Hum. Genet. 1987;76:290–292. doi: 10.1007/BF00283626. [DOI] [PubMed] [Google Scholar]
- 8.Lansdorp PM, et al. Hum. Mol. Genet. 1996;5:685–691. doi: 10.1093/hmg/5.5.685. [DOI] [PubMed] [Google Scholar]
- 9.Rufer N, Dragowska W, Thornbury G, Roosnek E, Lansdorp PM. Nat. Biotechnol. 1998;16:743–747. doi: 10.1038/nbt0898-743. [DOI] [PubMed] [Google Scholar]
- 10.Baerlocher GM, Vulto I, de Jong G, Lansdorp PM. Nat. Protoc. 2006;1:2365–2376. doi: 10.1038/nprot.2006.263. [DOI] [PubMed] [Google Scholar]
- 11.Sillar R, Young BD. J. Histochem. Cytochem. 1981;29:74–78. doi: 10.1177/29.1.6162882. [DOI] [PubMed] [Google Scholar]
- 12.Meyne J, et al. Chromosoma. 1990;99:3–10. doi: 10.1007/BF01737283. [DOI] [PubMed] [Google Scholar]
- 13.Falconer E, et al. Nature. 2010;463:93–97. doi: 10.1038/nature08644. [DOI] [PMC free article] [PubMed] [Google Scholar]
- 14.Devilee P, Slagboom P, Cornelisse CJ, Pearson PL. Nucleic Acids Res. 1986;14:2059–2073. doi: 10.1093/nar/14.5.2059. [DOI] [PMC free article] [PubMed] [Google Scholar]
- 15.Choo KH, Vissel B, Nagy A, Earle E, Kalitsis P. Nucleic Acids Res. 1991;19:1179–1182. doi: 10.1093/nar/19.6.1179. [DOI] [PMC free article] [PubMed] [Google Scholar]
SUPPLEMENTARY REFERENCES
- 16.Ding H, et al. Cell. 2004;117:873–886. doi: 10.1016/j.cell.2004.05.026. [DOI] [PubMed] [Google Scholar]
- 17.Carrano AV, Gray JW, Langlois RG, Burkhart-Schultz KJ, Van Dilla MA. Proc. Natl. Acad. Sci. USA. 1979;76:1382–1384. doi: 10.1073/pnas.76.3.1382. [DOI] [PMC free article] [PubMed] [Google Scholar]
- 18.Trask B. In: Flow Cytogenetics. Gray JW, editor. Academic Press Inc.; London, UK: 1989. pp. 43–60. [Google Scholar]
- 19.Poon SS, Martens UM, Ward RK, Lansdorp PM. Cytometry. 1999;36:267–278. doi: 10.1002/(sici)1097-0320(19990801)36:4<267::aid-cyto1>3.0.co;2-o. [DOI] [PubMed] [Google Scholar]
Associated Data
This section collects any data citations, data availability statements, or supplementary materials included in this article.