

Abstract
Background
Inequalities in access to palliative care programs (PCP) by age have been shown to exist in Canada and elsewhere. Few studies have been able to provide greater insight by simultaneously adjusting for multiple demographic, health service, and socio-cultural indicators.
Objective
To re-examine the relationship between age and registration to specialized community-based PCP programs among cancer patients and identify the multiple indicators contributing to these inequalities.
Methods
This retrospective, population-based study was a secondary data analysis of linked individual level information extracted from 6 administrative health databases and contextual (neighborhood level) data from provincial and census information. Subjects included all adults who died due to cancer between 1998 and 2003 living within 2 District Health Authorities in the province of Nova Scotia, Canada. The relationship between registration in a PCP and age was examined using hierarchical nonlinear regression modeling techniques. Identification of potential patient and ecologic contributing indicators was guided by Andersen’s conceptual model of health service utilization.
Results
Overall, 66% of 7511 subjects were registered with a PCP. Older subjects were significantly less likely than those <65 years of age to be registered with a PCP, in particular those aged 85 years and older (adjusted odds ratio: 0.4; 95% confidence interval: 0.3–0.5). Distance to the closest cancer center had a major impact on registration.
Conclusions
Age continues to be a significant predictor of PCP registration in Nova Scotia even after controlling for the confounding effects of many new demographic, health service, and ecologic indicators.
Keywords: aging, disparities, end-of-life care, vulnerable populations
As the leading cause of death in 2004, 68,300 Canadians died of cancer.1 Although age standardized mortality rates for most cancers have leveled off or are declining, the number of cancer deaths will continue to climb steeply due to the aging demographic distribution of our society and the overall growth in population size. The resulting need for end-of-life care will drive greater health service utilization by those dying of cancer from a health system that keeps changing to control costs and limit wait times while, at the same time, trying to monitor and evolve standards of care.
The end-of-life period is often a time of considerable health service utilization, substantial service needs, major health care costs, and a time of focusing primarily on quality of life and community-based supportive care rather than on the goals of cure or prolonging survival. Evidence exists in the United Kingdom, the United States, and Australia of inequalities in access to end-of-life care, particularly between age groups, and that attention to these differences is required.2–7 In Canada, our early research on end-of-life care in Nova Scotia (NS) focusing on palliative care program (PCP) registration among patients in the urban area of Halifax, found that the percent of individuals who died of cancer having made at least one contact with this PCP rose from 39% in 1992 to 62% in 1997, an increase that may have been due, in part, to the expansion of the program.8 The Halifax-based PCP includes an in-patient palliative care unit, hospital and outpatient interdisciplinary team-based consultation and ongoing care, and home-based palliative team care. However, despite this increase in access, this early research also indicated the elderly were the least likely to be cared for by the PCP. Although access did improve for the elderly as well during those years, it remained far behind younger patients. For cancer patients 85 years and older it rose from 22% in 1992 to only 38% in 1997.8
Even though inequalities in PCP access by age have been shown to exist in Canada and elsewhere, few studies provide greater insight by simultaneously adjusting for multiple demographic, health service, and socio-cultural indicators. Issues of need, health service availability, health service utilization, and factors relating to the social, economic, or cultural effect of an individual’s place of residence or “neighborhood” can all potentially affect the estimates associated with PCP access and age.
In this current study, the effect of age on PCP registration among cancer patients is re-examined, but this time all pertinent patient, population, and health system factors available through provincial administrative health databases and 2001 Canadian statistics were used to identify and account for contributing factors to age inequalities.
To guide the identification of these potential contributing factors, Andersen’s9 conceptual model of health service utilization was used (Fig. 1). In this model, primary determinants of health service use and outcomes include environmental factors, population characteristics, and health behaviors. Environmental factors encompass specifics about the health care system such as physician density, funded program availability, and policies. Population characteristics are categorized as: (1) predisposing sociodemographic characteristics; (2) enabling personal, family, and community resources; and (3) evaluated need. Health behaviors include information pertaining to each individual’s health service utilization.
FIGURE 1.

Potential determinants of registration with a Palliative Care Program by hierarchical level: Adapted from the Andersen model.
Although the information used in this study remains retrospective, it is an important step toward the identification of multiple factors contributing to potential inequalities in registration with PCP programs.
METHODS
Design
This retrospective, population-based study is a secondary data analysis of linked individual level information extracted from 6 administrative health databases and contextual (neighborhood level) data made available by the NS Department of Health and the 2001 Canada Census. Ethical approval for this research was provided by the Capital and Cape Breton District Health Authority Research Ethics Boards.
Data
Databases providing individual level information, linked using each individual’s unique encrypted provincial health card number, included: (1) the Queen Elizabeth II Health Sciences Center Oncology Patient Information System [OPIS, encompassing NS Vital Statistics and NS Cancer Registry (NSCR) information], (2) the Capital Health Integrated Palliative Care Service (CHIPCS), (3) the Cape Breton District Health Authority Palliative Care Program (CBDHA PCP), (4) the NS Medical Services Insurance Physician Services file (MSIPS), (5) the Hospital Discharge database for NS (DAD), and (6) provincial SEAscape Continuing Care, homecare information. This latter database was recently developed and only able to provide data pertaining to deaths in 2003. Because we are interested in the end of life, services provided by the physician and hospital were limited to the 6 months or 180 days before the date of death. The last 6 months are commonly used to represent the end of life in studies focusing on care.10–15
Administrative health databases are useful when providing information about service delivery.16 Cancer registry and death certificate information demonstrate a high degree of accuracy and excellent agreement with respect to cancer deaths.17 In NS, Grunfeld et al18 report very high reliability between database (OPIS, CHIPCS, DAD) and patient chart information to assess services provided during the end of life. The MSIPS database includes information on physician service billing claims for virtually all NS residents. Because physician billing claims data undergo regular audit and assessment, they are consequently subject to little over- or under-reporting and represent valid indicators of health services utilization.19
The NS Department of Health and the 2001 Canada Census provided data to create social structure and health system indicators by dissemination area (DA) or neighborhoods. DAs are the smallest, stable, geographic areas for which census information may be obtained.20 This aggregate information was linked to individual level data using each individual’s DA of residence.
Subjects
All adults (18 years of age and older) who died of cancer between January 1, 1998 and December 31, 2003 as identified from death certificate information [International Classification of Diseases, 9th revision (ICD9-CM) and 10th revision (ICD10-CM)] with a pathologically confirmed cancer diagnosis recorded in the NSCR were considered as potential subjects. For this study, subjects were limited to residents of 2 District Health Authorities in the province of NS, Canada that collectively represents 54% of the total provincial population.
Measures
The dependent variable, registration with a PCP, was dichotomized as registered versus not registered. A positive indicator of registration was defined as a record of admission or registration in either of the 2 PCP clinical databases. Age, the primary independent variable of interest, was categorized into 4 groups (<65, 65–74, 75–84, and ≥85 years).
Potential determinants of registration with a PCP, which may contribute to and/or modify age inequalities, were grouped together as environmental factors, population characteristics, or health behaviors. Each was available as either individual level information and/or as aggregate contextual or neighborhood indicators (Fig. 1).
Environmental factors related to the health care system included the distance from each patient’s residence to their nearest cancer center (individual level) and the neighborhood level factors of long-term care (LTC) bed supply and family physician density in each individual’s residential DA. Year of death was included to provide a proxy for external environment effects related to health system policy, program, and funding changes.
Population characteristics encompassed: (1) predisposing characteristics, (2) enabling resources, and (3) need. Predisposing characteristics included each individual’s age, sex, survival time (time from date of diagnosis to death), and social structure contextual indicators. Social structure indicators were developed using 2001 Canada Census information. Using previously developed methods,21–23 7 contextual indicators were created at the DA or neighborhood level: education (≥50% vs. <50% of DA residents were high school graduates), unemployment (≥10% vs. <10% were unemployed), living alone (≥10% vs. <10% live alone), black community (≥10% vs. <10% were black), visible minority community (≥10% vs. <10% consider themselves a visible minority), visible minority community excluding black residents (excluding black residents, ≥10% vs. <10% consider themselves a visible minority), and Francophone community (≥10% vs. <10% consider French their mother tongue).
Enabling resources include personal and community resources. Personal resources considered were whether the individual had been in an LTC setting during their last 6 months of life; neighborhood level contextual resources included urban or rural residency and income quintile. At the present time, there is no electronic record of who in the province has been in LTC. However, visits by physicians to patients in such settings are captured in physician claims data (MSIPS) and for some, LTC residency may be ascertained from the death certificate using the postal code. LTC residency was, therefore, defined as a record of at least 1 visit from a physician, as recorded in the MSIPS database, to an LTC facility during the last 6 months of life or from the death certificate, a postal code associated with a LTC facility. Residential postal code and census information at the DA level were used to develop an indicator of urban or rural residency. Urban areas are defined by Statistics Canada as regions with “a minimum population concentration of 1000 persons and a population density of at least 400 persons per square kilometre.”24 All other areas are considered rural. Because of the lack of individual level income information, median family income quintiles were also developed using census information by neighborhood.
A potentially strong indicator of PCP registration and other health service use is an individual’s “need” for such care. “Need” for formal palliative care services at the end of life may encompass a variety of factors such as disease severity, physical and mental functioning, and informal care-giver availability. Unfortunately, information pertaining to these “needs” is lacking in retrospective studies, particularly those based on secondary information.2 Administrative health data are collected primarily for payment and operational reasons and as such are limited to details of the service being provided. Why the service was required is not routinely collected. Therefore, to incorporate some measure of need, proxy indicators were used as estimates of actual or perceived need. Disease burden was estimated by considering the type of cancer causing death and the extent of comorbidities. Comorbidities, other than cancer, were estimated using the Charlson index.25–28 The length of time the individual spent as a hospital in-patient (0, 1–14, 15–31, ≥32 days) was considered as a proxy for disease severity and functional limitations.
Other provincially funded health services received during the last 6 months of life potentially impacting registration with a PCP were accounted for at the individual level. These included the total number of physician visits made (<20, 21–34, 35–49, ≥50); whether the individual had a medical oncology consultation (yes, no); receipt of palliative radio-therapy (yes, no); and for 2003 deaths only, the receipt of homecare services (yes, no). Distributions of health service utilization variables tended to be highly skewed and therefore categorized for analysis.
Analysis
Initial descriptive statistics and bivariate tests of association were followed by logistic regression analysis using hierarchical nonlinear regression modeling techniques. Hierarchical nonlinear regression modeling recognizes the multilevel nature of the data where patients are clustered within geographic DAs or neighborhoods resulting in more accurate standard error estimates and a reduction in the potential of interpreting grouped data at the individual level (ecologic fallacy).29,30 To detect the contribution and effect modification of individual and contextual level environmental factors, population characteristics and health behaviors on registration with a PCP by age group, a step-up modeling approach for variable inclusion was used with the intercept set as random and slopes fixed. The addition of contextual level 2 characteristics followed the inclusion of level 1 factors. Odds ratios (ORs) and associated 95% confidence intervals (CIs) are reported. Figure 1 provides a summary of the variables included in analyses and at what level they were considered. Analyses were performed using all subjects and then stratified by age. HLM 6 software31 was used to perform the hierarchical nonlinear modeling, and SAS for all other analyses.32 Homecare information was included within a sub-analysis involving 2003 deaths only.
RESULTS
Of the 14,426 eligible Nova Scotians who died due to cancer over the 6-year period, 7511 were residents of 1 of the 2 district health authorities under study and considered as subjects for this study. These 2 authorities encompassed 767 DAs (neighborhoods).
Overall, 65.5% were registered with a PCP. Table 1 summarizes both individual and neighborhood level characteristics by PCP registration status and notes characteristics that varied significantly between registration groups.
TABLE 1.
Subject Individual and Ecologic Characteristics by PCP Registration (1998–2003)
| Potential Determinant | Cancer Deaths by PCP Status, Frequency (%)
|
|
|---|---|---|
| Registered (n = 4923) | Not Registered (n = 2588) | |
| Individual Level | ||
| Age (yrs)§ | ||
| <65 | 1623 (33.0) | 420 (16.2) |
| 65–74 | 1262 (25.6) | 534 (20.6) |
| 75–84 | 1413 (28.7) | 854 (33.0) |
| 85+ | 625 (12.7) | 780 (30.1) |
| Age (yrs)§ | ||
| Mean (SD) | 69.1 (13.0) | 76.0 (11.9) |
| Median (range) | 71 (19–100) | 78 (19–103) |
| Environment | ||
| Distance to closest cancer center (km)§ | ||
| 0–10 | 2824 (57.4) | 1215 (47.0) |
| 11–50 | 1928 (39.2) | 791 (30.6) |
| 51–120 | 171 (3.5) | 582 (22.5) |
| Year of death | ||
| 1998 | 782 (15.9) | 414 (16.0) |
| 1999 | 804 (16.3) | 427 (16.5) |
| 2000 | 802 (16.3) | 423 (16.3) |
| 2001 | 800 (16.3) | 433 (16.7) |
| 2002 | 841 (17.1) | 456 (17.6) |
| 2003 | 894 (18.2) | 435 (16.8) |
| Population Characteristics | ||
| Predisposing | ||
| Sex§ | ||
| Female | 2424 (49.2) | 1145 (44.2) |
| Survival time§ | ||
| ≤60 days | 888 (18.0) | 730 (28.2) |
| 61–120 days | 539 (11.0) | 211 (8.2) |
| 121–183+ days | 3496 (71.0) | 1647 (63.6) |
| Enabling resources | ||
| Long term care resident§ | ||
| At least 1 LTC visit | 345 (7.0) | 511 (19.7) |
| Need | ||
| Cancer cause of death§ | ||
| Breast | 387 (7.9) | 159 (6.1) |
| Lung | 1357 (27.6) | 601 (23.2) |
| Colorectal | 501 (10.2) | 227 (8.8) |
| Gastrointestinal–other | 766 (15.6) | 359 (13.9) |
| Prostate | 234 (4.8) | 193 (7.5) |
| Genitourinary–other | 208 (4.2) | 130 (5.0) |
| Gynecologic | 220 (4.5) | 84 (3.3) |
| Hematological | 275 (5.6) | 240 (9.3) |
| Others | 411 (8.4) | 164 (6.3) |
| Unknown primary | 564 (11.5) | 431 (16.7) |
| Co-morbidities (Charlsen index)§ | ||
| Mean (SD) | 4.9 (2.9) | 3.4 (3.1) |
| Median (range) | 6 (0–12) | 2 (0–15) |
| Health Behavior | ||
| Use of health services | ||
| Inpatient length of stay§ (also viewed as a proxy for “need”) | ||
| 0 days | 608 (12.4) | 494 (19.1) |
| 1–14 days | 1474 (29.9) | 875 (33.8) |
| 15–31 days | 1253 (25.5) | 563 (21.8) |
| 32+ days | 1588 (32.3) | 656 (25.4) |
| All physician visits§ | ||
| <20 | 1188 (24.1) | 857 (33.1) |
| 21–34 | 1348 (27.4) | 684 (26.4) |
| 35–49 | 1014 (20.6) | 423 (16.3) |
| 50 or more | 1373 (27.9) | 624 (24.1) |
| At least 1 chemo-related visit§ | ||
| Yes | 1306 (26.5) | 228 (8.8) |
| Radiotherapy received last 6 mo of life§ | ||
| Yes | 1974 (40.1) | 438 (16.9) |
| Homecare receipt (2003 only)§ | ||
| Yes | 717 (80.2) | 249 (57.2) |
| Neighborhood (contextual) Level | ||
| Environment | ||
| Health care system | ||
| Family physician density, number per 1000 DA population§ | ||
| Mean (SD) | 1.3 (4.5) | 1.9 (7.5) |
| Median (range) | 0 (0–93) | 0 (0–93) |
| Long term care beds availability, number per 1000 DA population§ | ||
| Mean (SD) | 9.1 (59.5) | 23.7 (97.3) |
| Median (range) | 0 (0–607) | 0 (0–607) |
| Population Characteristics | ||
| Predisposing | ||
| High school graduates§ | ||
| ≥50% graduated high school | 4773 (97.5) | 2418 (94.9) |
| Unemployment§ | ||
| ≥10% unemployed | 452 (9.2) | 349 (13.7) |
| Living alone | ||
| ≥10% in DA live alone | 2104 (43.0) | 1137 (44.6) |
| Black community‡ | ||
| ≥10% black | 312 (6.4) | 114 (4.5) |
| Visible minorities (all) in community‡ | ||
| ≥10% visible minorities | 788 (16.1) | 331 (13.0) |
| Visible minorities, excluding black in community§ | ||
| ≥10% visible minorities, excluding blacks | 293 (6.0) | 98 (3.9) |
| Francophone community§ | ||
| ≥10% French as mother tongue | 29 (0.6) | 75 (2.9) |
| Enabling Resources | ||
| Income quintiles§ | ||
| Low | 1028 (20.9) | 548 (21.2) |
| Low-middle | 1041 (21.2) | 616 (23.8) |
| Middle | 947 (19.2) | 512 (19.8) |
| Upper-middle | 897 (18.2 | 393 (15.2) |
| Upper | 873 (17.7) | 379 (14.6) |
| Missing | 137 (2.8) | 140 (5.4) |
| Average 2000 household income§ ($) | ||
| Mean (SD) | 48,879 (20,441) | 45,828 (18,812) |
| Median (range) | 46,513 (0–227,520) | 44,282 (0–181,978) |
| Urban rural indicator§ | ||
| Urban | 3900 (79.3) | 1724 (66.6) |
| Rural | 1015 (20.6) | 863 (33.4) |
Neighborhood (contextual) level, population predisposing characteristics were not available for 68 subjects.
Differences were assessed using χ2 tests of association for categorical variables; t tests for normally distributed variables, and Wilcoxon rank sum test for nonparametric data.
P < 0.001;
P < 0.0001.
The proportion of subjects registered to a PCP over time for each age group is illustrated in Figure 2. Little age group variation was evident over time. However, the disparity in PCP registration between the age groups is significant (P < 0.0001).
FIGURE 2.
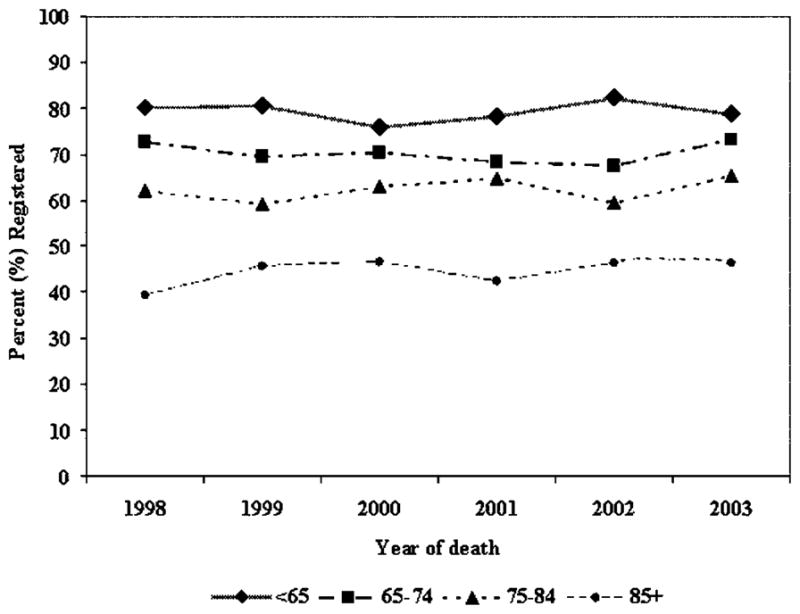
Palliative program registration over time by age group.
The initial unconditional multilevel model indicated significant heterogeneity in PCP registration across neighborhoods (P < 0.0001), thereby supporting the use of level 2 contextual indicators in the model. Table 2 presents the results of the final multivariate, multilevel logistic regression analysis among all individuals and by age grouping. Among all subjects, older individuals remained significantly less likely than those <65 years of age to be registered with a PCP, in particular those aged 85 years and older [adjusted OR (AOR): 0.4; 95% CI: 0.3–0.5], after accounting for all retained individual and neighborhood level indicators. Little change in these age estimates was seen with the addition of homecare information in the sub-analysis of 2003 deaths (for those aged 85 years and older AOR: 0.4; 95% CI: 0.2–0.6). Independent effects on PCP registration were associated with both individual and neighborhood level determinants after simultaneously adjusting for all retained factors. Distance to the closest cancer center was a highly significant environmental determinant of PCP registration. Subjects residing less than 51 km from a tertiary cancer center were 8 times more likely to have been registered to a PCP than those living further away. Men were less likely to be registered than women as were individuals who had spent time in an LTC facility before death. Other associated individual level population characteristics included survival, cancer cause of death, and comorbidities. The odds of being registered with a PCP varied with differing cancer causes of death. With the exception of total physician visits, greater health service utilization was associated with a greater likelihood of PCP registration.
TABLE 2.
Determinants of Registration With a Comprehensive Palliative Care Program From Hierarchical Nonlinear Regression, All Cancer Deaths* and by Age
| Determinants | OR (95% CI)
|
|||||
|---|---|---|---|---|---|---|
| All Patients
|
Age <65 Yrs | Ages 65–74 | Ages 75–84 | Ages 85+ | ||
| Unadjusted | Adjusted† | Adjusted† | ||||
| Individual Level | ||||||
| Age (yrs) (vs. <65) | ||||||
| 65–74 | 0.6 (0.5–0.7) | 0.8 (0.7–0.9) | — | — | — | — |
| 75–84 | 0.4 (0.4–0.5) | 0.7 (0.6–0.8) | ||||
| 85+ | 0.2 (0.2–0.2) | 0.4 (0.3–0.5) | ||||
| Environment | ||||||
| Health care system | ||||||
| Distance to cancer centre (vs. >50 km) | ||||||
| 0–10 km | 7.9 (6.6–9.5) | 8.2 (6.0–11.1) | 8.3 (5.3–13.0) | 12.3 (7.8–19.4) | 9.6 (5.9–15.5) | 17.2 (9.1–32.3) |
| 11–50 km | 8.3 (6.9–10.0) | 8.2 (6.1–11.0) | 7.7 (4.9–12.0) | 10.4 (6.5–16.6) | 9.0 (5.5–14.8) | 14.7 (7.8–27.8) |
| Population Characteristics | ||||||
| Predisposing | ||||||
| Sex (vs. female) | ||||||
| Male | 0.8 (0.8–0.9) | 0.8 (0.7–0.9) | 1.0 (0.7–1.3) | 0.7 (0.5–1.0) | 0.7 (0.5–0.9) | 0.7 (0.5–1.0) |
| Survival groups (vs. < 61 days) | ||||||
| 61–120 days | 2.1 (1.7–2.5) | 1.8 (1.5–2.3) | 2.6 (1.6–4.1) | 2.0 (1.3–3.1) | 1.8 (1.2–2.5) | 2.1 (1.3–3.5) |
| 121–183+ days | 1.7 (1.6–2.0) | 1.5 (1.3–1.8) | 2.1 (1.5–3.0) | 2.0 (1.5–2.7) | 1.5 (1.2–1.9) | 1.1 (0.8–1.6) |
| Enabling resources | ||||||
| Long term care resident (vs. no LTC visit) | ||||||
| At least 1 LTC visit | 0.3 (0.3–0.4) | 0.5 (0.4–0.6) | — | 0.5 (0.3–0.9) | 0.6 (0.4–0.8) | 0.3 (0.2–0.4) |
| Need | ||||||
| Cancer cause of death (vs. colorectal) | ||||||
| Breast | 1.1 (0.9–1.4) | 0.6 (0.4–0.7) | 0.6 (0.3–1.3) | 0.5 (0.3–1.0) | 0.6 (0.4–1.1) | 0.4 (0.2–0.8) |
| Lung | 1.0 (0.9–1.2) | 0.8 (0.7–1.0) | 0.6 (0.3–1.0) | 0.7 (0.5–1.1) | 1.1 (0.8–1.7) | 0.9 (0.6–1.5) |
| Gastrointestinal | 1.0 (0.8–1.2) | 1.1 (0.9–1.4) | 0.9 (0.5–1.6) | 1.0 (0.6–1.7) | 1.2 (0.8–1.7) | 1.0 (0.6–1.8) |
| Prostate | 0.5 (0.4–0.7) | 0.6 (0.4–0.8) | 0.3 (0.1–0.8) | 0.7 (0.4–1.4) | 0.7 (0.5–1.1) | 0.4 (0.2–0.8) |
| Genitourinary | 0.7 (0.6–0.9) | 0.8 (0.6–1.0) | 0.7 (0.3–1.5) | 0.8 (0.4–1.4) | 1.0 (0.6–1.6) | 0.6 (0.3–1.2) |
| Gynecologic | 1.2 (0.9–1.6) | 1.0 (0.7–1.5) | 0.7 (0.3–1.4) | 0.6 (0.3–1.4) | 1.4 (0.8–2.4) | 1.4 (0.6–3.4) |
| Hematological | 0.5 (0.4–0.7) | 0.7 (0.5–0.9) | 0.3 (0.2–0.6) | 0.5 (0.3–1.0) | 0.9 (0.6–1.6) | 0.9 (0.5–1.8) |
| Others | 1.1 (0.9–1.4) | 1.2 (0.9–1.6) | 1.1 (0.6–2.2) | 1.1 (0.6–2.1) | 1.3 (0.8–2.2) | 1.0 (0.5–2.0) |
| Unknown primary | 0.6 (0.5–0.7) | 0.6 (0.5–0.8) | 0.7 (0.4–1.3) | 0.8 (0.5–1.4) | 0.6 (0.4–0.9) | 0.6 (0.4–1.0) |
| Comorbidities (Charlson index) | 1.2 (1.2–1.2) | 1.1 (1.1–1.1) | 1.1 (1.1–1.2) | 1.1 (1.0–1.1) | 1.1 (1.1–1.2) | 1.1 (1.1–1.2) |
| Health Behavior | ||||||
| Use of health services | ||||||
| Total hospital inpatient days (vs. 0; also a proxy for need) | ||||||
| 1–14 | 1.4 (1.2–1.6) | 0.8 (0.7–1.0) | 0.8 (0.5–1.2) | 1.1 (0.7–1.6) | 0.8 (0.6–1.1) | 0.7 (0.5–1.1) |
| 15–31 | 1.8 (1.6–2.1) | 1.3 (1.0–1.6) | 1.2 (0.7–1.8) | 1.7 (1.1–2.7) | 1.2 (0.9–1.6) | 0.8 (0.5–1.4) |
| 32 or more | 2.0 (1.7–2.3) | 1.7 (1.4–2.3) | 1.8 (1.2–2.8) | 1.7 (1.1–2.5) | 1.3 (0.9,1.7) | 1.3 (0.8–2.3) |
| All physician visits (vs. <20) | ||||||
| 20–34 | 1.4 (1.3–1.6) | 1.1 (0.9–1.2) | 1.2 (0.9–1.8) | |||
| 35–49 | 1.7 (1.5–2.0) | 1.0 (0.9–1.3) | — | — | — | 1.4 (0.8–2.3) |
| 50+ | 1.6 (1.4–1.8) | 0.7 (0.6–0.9) | 0.7 (0.4–1.2) | |||
| At least 1 chemo-related visit (vs. no) | ||||||
| Yes | 3.7 (3.2–4.3) | 2.0 (1.7–2.5) | 2.2 (1.6–2.9) | 1.6 (1.2–2.3) | 2.1 (1.4–3.0) | 1.7 (0.9–3.1) |
| Radiotherapy received last 6 mo of life (vs. no) | ||||||
| Yes | 3.3 (2.9–3.7) | 2.7 (2.4–3.1) | 2.3 (1.7–3.1) | 2.7 (2.0–3.7) | 2.6 (2.0–3.4) | 3.2 (2.3–4.6) |
| Neighborhood (contextual) Level | ||||||
| Population Characteristics | ||||||
| Predisposing | ||||||
| Visible minorities excluding black (vs. <10%) | ||||||
| ≥10% visible minorities excluding black | 1.6 (1.3–2.0) | 1.3 (1.0–1.7) | — | — | 1.6 (1.1–2.5) | 1.7 (1.0–3.0) |
| Francophone community (vs. <10% French as mother tongue) | ||||||
| ≥10% French as mother tongue | 0.2 (0.1–0.3) | 0.6 (0.3–1.0) | 0.3 (0.1–0.6) | — | 0.4 (0.2–1.0) | — |
| High school graduates (vs. <50% graduated) | ||||||
| ≥50% graduated high school | 2.1 (1.6–2.7) | — | 2.0 (1.1–3.7) | — | — | — |
| Enabling resources | ||||||
| Urban rural indicator (vs. urban) | ||||||
| Rural | 0.5 (0.5–0.6) | 0.8 (0.7–1.0) | — | — | — | — |
| Income quintiles (vs. upper) | ||||||
| Low | 0.8 (0.7–1.0) | 0.9 (0.7–1.1) | — | — | — | — |
| Low-middle | 0.7 (0.6–0.9) | 0.7 (0.6–0.9) | ||||
| Middle | 0.8 (0.7–0.9) | 0.8 (0.6–1.0) | ||||
| Upper-middle | 1.0 (0.8–1.2) | 1.1 (0.8–1.3) | ||||
All cancer deaths within the Capital District and Cape Breton District Health Authorities.
Final multivariate models. Adjusted for all other factors in the final model. Estimates associated with the population average model with robust standard errors are reported here.
Two predisposing and 2 enabling population characteristics at the neighborhood or contextual level were found to have significant independent effects on PCP registration after adjustments for each other and retained individual level factors. Subjects living in Francophone communities were 40% less likely to be registered with a PCP, whereas residents who lived in communities composed of 10% or more visible minorities, other than of black descent, were 30% more likely. Residents in rural regions compared with urban were less likely to be registered as were individuals living in middle and low-middle income neighborhoods compared with upper income.
Although estimate magnitudes fluctuated, independent individual level determinants associated with PCP registration following stratification by age remained similar to those identified using all subjects (Table 2). From the environmental standpoint, distance to the closest cancer center seemed to be a greater issue among the very elderly. For instance, individuals aged 85 years and over were 17 times more likely to be registered with a PCP if they lived 10 km or less from the cancer center compared with those who lived over 50 km away. For subjects <65 years, this was still an issue, but not to the same degree. As expected, the likelihood of registration with a PCP among those in LTC decreased with advancing age and was not a significant factor among those <65 years of age. Only among individuals aged 85 and older were visits to a physician retained in the model.
In contrast, neighborhood factors effecting PCP registration seemed to differ by age. Only among those 75 years of age and older did residency in a community composed of 10% or more visible minorities (excluding black descents) remain a significant factor associated with PCP registration. The effect of Francophone community residency on PCP registration was also limited to 2 age groups: individuals <65 years of age and those between 75 and 84 years were less likely to be registered. Residency in an urban or rural area and neighborhood income did not remain significant factors within individual age groups. One variable not significantly related to PCP registration in the adjusted model among all subjects but important within an age cohort was being a “high school graduate.” Age stratification suggests this factor is important among those <65 years of age where individuals who graduated from high school were twice as likely to be registered.
DISCUSSION
Even after simultaneously accounting for many more patient, population, and health system factors than in previous research, the age inequality in access to a PCP remains. With advancing years, individuals with cancer remain less likely to be registered than their younger counterparts. This is particularly evident among the very elderly, who in this study, were 60% less likely to be registered than those <65 years. In past studies, some of this disparity was suggested to be due to LTC residency where palliative needs may potentially be met3,8 or associated with a greater comorbidity burden and possible alternative treatment options.33 However, these variables have been controlled for in this study. As expected, individuals who spent at least some time in LTC during the end of life were also less likely to be registered with a PCP, even after adjusting for age. This was especially true for those 85 years and older. Catt et al34 report underutilization among the elderly in the UK is not explained by differing attitudes to end of life and palliative care. In addition, our first use of homecare information, albeit limited, suggests age disparities are not greatly affected by homecare receipt.
Gender differences in registration were found only in the over 65 age groups, where men were less likely to be registered. We speculate that given the earlier overall mortality among men in general, more men had spousal caregivers available to them than women. Indeed, Grande et al35 reports that it is the age of the “carer” that is predictive of the need for palliative homecare.
Distance to the cancer center is a major factor influencing access to PCP for the elderly. In this study, each PCP is physically located at the same location as the cancer center. Although in part this distance influence may be a transportation issue, it is also possible that many elderly have made the choice not to access care from the PCP. It is also possible that for cost-efficiency reasons, our PCPs have limitations on the distances to which they are approved for travel to provide services.
It was necessary to use proxies for the assessment of “need” for PCP in this study, given the lack of actual patient report or clinical assessment of need. Greater comorbidity was consistently and significantly associated with increased odds of PCP registration. As the burden of comorbidity increased by a factor of “1,” the likelihood of PCP registration increased by 10%. Increased hospitalization, particularly among those <75 years of age, was also predictive of PCP registration.
Contact with specialized cancer services such as palliative radiotherapy and chemotherapy during the end of life was positively associated with PCP registration among all age groups and, in 2003, receipt of homecare services. This is in keeping with Grande et al’s 2002 findings that contact with cancer services predicted palliative homecare.36
Interestingly, PCP registration among individuals living in the lowest income neighborhoods did not differ significantly from registration among those residing in the highest income areas. However, individuals living in middle and lower middle income neighborhoods were less likely to be registered. Perhaps those at the lower end of the income spectrum have or qualify for social services that provide much of the supports needed for care, whereas patients in the lower middle or middle income neighborhoods do not qualify for these services. Patient’s residing in the higher end of the income spectrum may have access to alternative resources that facilitate the use of PCP support particularly in the home, such as the ability to pay for expensive pharmaceuticals and equipment. Lackan et al37 found that Americans with low incomes were less likely to be admitted to hospice. Addington-Hall4,5 did not find social class predictive of either in-patient or community specialist care. Variations in the details of social support benefits may account for how patients and families access end-of-life care.
We are challenged to explain why having completed high school is only significant in predicting registration for those under age 65. This may be related to the peer network available to each age group and the knowledge of PCP availability.
Our findings regarding minorities differ from the published literature. We found similar access patterns between the black community and the overall population, visible minorities who were not black were more likely to access PCP than Francophone residents. Both Virnig38 and Lackan37 found lower use of hospice by blacks and nonwhites. Lackan’s studies were not adjusted for other possible covariate influences. The interpretation of these results is challenging. Factors contributing may include how long and well established each minority group might be (for instance longer established black communities with support vs. recent immigrant communities), the cultural appropriateness of the service provided or the availability of health services in the language of the user (Francophone community). These results may also be an artifact resulting from somewhat small numbers and/or our neighborhood level analytic approach. Either way, these factors deserve further investigation from both qualitative and quantitative perspectives.
Limitations
As always, there are limitations when using administrative and census data. Administrative data are very useful to evaluate provincially funded health services used by patients during the end of life, covers the entire population, and allows comparisons over time.16 Unfortunately, such data do not capture information beyond actual use. It was, therefore, necessary to create proxy estimates of need from available administrative data. In the future, data collection strategies need to be found to gather better information about true needs and treatment preferences of patients or caregivers. DA level data may also wash out individual level effects.
Although the use of contextual or ecologic proxies, in particular income, has become common practice in Canada when individual level information is not available,23,39–41 concerns have been raised with respect to misclassification, attenuated findings, and the possibility of “Ecologic Fallacy.”42–46 Most concede, however, that in the absence of individual measures, ecologic proxies may be the only way to address many questions pertaining to health services and public health. In the literature, the use of ecologic information has been deemed successful.23,47,48 In this study, we have used multilevel modeling techniques in our analysis to reduce this potential.
CONCLUSIONS
This study used improved methods to extend our previous statistical analyses. The multilevel conceptual framework of Andersen9 applied to this research using multilevel hierarchical modeling has enhanced our ability to look at the interplay of many factors.
It remains that the elderly are the least likely to be registered with a PCP. Factors also contributing to registration include gender, geography, disease, survival, comorbidities, use of other health services, culture/language origin, income, and education. The interplay of these factors is complex as many communities have overlapping characteristics.
In Canada, the health care system is publicly funded and organized much like the United Kingdom and Australia. Similarly, researchers in the United Kingdom and Australia have also reported age disparities in PCP access.4,5,49 From a health system funding and organization perspective, our results may readily generalize to these countries and others with similar systems. However, we caution that the nature of the health care system may not be responsible for age disparities in PCP registration. We suggest these disparities may be less likely associated with the nature of the health care system and more likely associated with the choices being made by the elderly, their families, or health provider referral bias.
In the future we require finer definitions of “need” before statements can be made beyond inequalities to that of equity.50 We also require information about patient preferences, such as where they choose to be cared for, the type of care they wish to receive or decline, and information about caregiver availability to the dying in the community. None of this is available in existing administrative data. As a first step, a mortality follow-back survey might be a way to capture some of this information from key informants who were close to the decedents before death.51
Acknowledgments
Supported by the Canadian Institutes of Health Research, grant MOP-77641.
References
- 1.National Cancer Institute of Canada. Canadian Cancer Statistics 2004. Toronto, Canada: 2004. [Google Scholar]
- 2.Burt J, Raine R. The effect of age on referral to and use of specialist palliative care services in adult cancer patients: a systematic review. Age Ageing. 2006;35:469–476. doi: 10.1093/ageing/afl001. [DOI] [PubMed] [Google Scholar]
- 3.Rosenwax LK, McNamara BA. Who receives specialist palliative care in Western Australia–and who misses out. Palliat Med. 2006;20:439–445. doi: 10.1191/0269216306pm1146oa. [DOI] [PubMed] [Google Scholar]
- 4.Addington-Hall J, Altmann D, McCarthy M. Which terminally ill cancer patients receive hospice in-patient care? Soc Sci Med. 1998;46:1011–1016. doi: 10.1016/s0277-9536(97)10021-1. [DOI] [PubMed] [Google Scholar]
- 5.Addington-Hall J. Which terminally ill cancer patients in the United Kingdom receive care from community specialist palliative care nurses? J Adv Nurs. 2000;32:799–806. [PubMed] [Google Scholar]
- 6.Davies E, Higginson IJ. Better Palliative Care for Older People. Copenhagen, Denmark: World Health Organization; 2004. p. 40. [Google Scholar]
- 7.House of Commons Health Committee. Palliative Care: Fourth Report of Session 2003–04. 2004 Available at: www.publications.parliament.uk/pa/cm200304/cmselect/cmhealth/454.
- 8.Burge F, Johnston G, Lawson B, et al. Population based trends in referral of the elderly to a comprehensive palliative care program. Palliat Med. 2002;16:255–256. doi: 10.1191/0269216302pm550xx. [DOI] [PubMed] [Google Scholar]
- 9.Andersen RM. Revisiting the behavioral model and access to medical care: does it matter? J Health Soc Behav. 1995;36:1–10. [PubMed] [Google Scholar]
- 10.Burge F, Johnston G, Lawson B. Primary care continuity and location of death for those with cancer. J Palliat Med. 2003;6:911–918. doi: 10.1089/109662103322654794. [DOI] [PubMed] [Google Scholar]
- 11.Burge F, Lawson B, Johnston G. Family physician continuity of care and emergency department use in end-of-life cancer care. Med Care. 2003;41:992–1001. doi: 10.1097/00005650-200308000-00012. [DOI] [PubMed] [Google Scholar]
- 12.Burge FI, Lawson B, Johnston G. Home visits by family physicians during the end-of-life: does patient income or residence play a role? BMC Palliative Care. 2005;4:1. doi: 10.1186/1472-684X-4-1. [DOI] [PMC free article] [PubMed] [Google Scholar]
- 13.Burge FI, Lawson B, Johnston G, et al. Health care restructuring and family physician care for those who died of cancer. BMC Fam Pract. 2005;6:1. doi: 10.1186/1471-2296-6-1. [DOI] [PMC free article] [PubMed] [Google Scholar]
- 14.Somogyi-Zalud E, Zhong Z, Hamel MB, et al. The use of life-sustaining treatments in hospitalized persons aged 80 and older. J Am Geriatr Soc. 2002;50:930–934. doi: 10.1046/j.1532-5415.2002.50222.x. [DOI] [PubMed] [Google Scholar]
- 15.Latimer EA, Verrilli D, Welch WP. Utilization of physician services at the end of life: differences between the United States and Canada. Inquiry. 1999;36:90–100. [PubMed] [Google Scholar]
- 16.Allan DE, Stajduhar KI, Reid RC. The uses of provincial administrative health databases for research on palliative care: insights from British Columbia, Canada. BMC Palliative Care. 2005;4:2. doi: 10.1186/1472-684X-4-2. [DOI] [PMC free article] [PubMed] [Google Scholar]
- 17.Rawson NSB, Robson DL. Concordance on the recording of cancer in the Saskatchewan Cancer Agency Registry, hospital charts and death registrations. Can J Pub Health. 2000;91:390–393. doi: 10.1007/BF03404814. [DOI] [PMC free article] [PubMed] [Google Scholar]
- 18.Grunfeld E, Lethbridge L, Dewar R, et al. Towards using administrative databases to measure population-based indicators of quality of end-of-life care: testing the methodology. Palliat Med. 2006;20:769–777. doi: 10.1177/0269216306072553. [DOI] [PMC free article] [PubMed] [Google Scholar]
- 19.Anderson GM, Grumbach K, Luft HS, et al. Use of coronary artery bypass surgery in the United States and Canada: influence of age and income. JAMA. 1993;269:1661–1666. [PubMed] [Google Scholar]
- 20.Statistics Canada. Definitions, data sources and methods: Geography. Statistics Canada; Oct 16, 2007. [cited November 1, 2007]. Available at: http://www.statcan.ca/english/concepts/definitions/geography.htm. [Google Scholar]
- 21.O’Brien M, Gao J. Detailed methods of data preparation for research on access to end-of-life care for adults dying of cancer in Nova Scotia. Cancer Care Nova Scotia. 2006 [cited October 29, 2007]. Available at: www.cancer.ns.ca/media/documents/DetailedMethods.
- 22.Network for End of Life Studies. End of life care for cancer patients. Cancer Care Nova Scotia. 2006 Jun 20; [cited November 1, 2007]. Available at: http://www.cancercare.ns.ca/inside.asp?cmPageID=314.
- 23.Johnston GM, Boyd CJ, MacIsaac MA. Community-based cultural predictors of Pap smear screening in Nova Scotia. Can J Pub Health. 2004;95:95–98. doi: 10.1007/BF03405774. [DOI] [PMC free article] [PubMed] [Google Scholar]
- 24.Statistics Canada. Definitions, data sources and methods: concepts and variables. Statistics Canada; Mar 7, 2006. [cited November 1, 2007]. Available at: http://www.statcan.ca/english/concepts/definitions/index.htm. [Google Scholar]
- 25.Charlson ME, Pompei P, Ales KL, et al. A new method of classifying prognostic comorbidity in longitudinal studies: development and validation. J Chron Dis. 1987;40:373–383. doi: 10.1016/0021-9681(87)90171-8. [DOI] [PubMed] [Google Scholar]
- 26.Quan H, Parsons GA, Ghali WA. Validity of information on comorbidity derived from ICD-9-CM administrative data. Med Care. 2002;40:675–685. doi: 10.1097/00005650-200208000-00007. [DOI] [PubMed] [Google Scholar]
- 27.Quan H, Sundararajan V, Halfon P, et al. Coding algorithms for defining comorbidities in ICD-9-CM and ICD-10 administrative data. Med Care. 2005;43:1130–1139. doi: 10.1097/01.mlr.0000182534.19832.83. [DOI] [PubMed] [Google Scholar]
- 28.Manitoba Centre for Health Policy. MCHP’s Concept Dictionary. Manitoba Centre for Health Policy; 2003. [cited November 1, 2007]. Available at: http://www.umanitoba.ca/centres/mchp/concept/concept.frame.shtml. [Google Scholar]
- 29.Raudenbush SW, Bryk AS. Hierarchical Linear Models: Applications and Data Analysis Methods. 2. Thousand Oaks, CA: Sage Publications Inc; 2002. [Google Scholar]
- 30.Hox J. Multilevel Analysis: Techniques and Applications. Mahwah, NJ: Lawrence Erlbaum Associates Inc; 2002. [Google Scholar]
- 31.Raudenbush SW, Bryk AS, Cheong YK, et al. HLM 6: Hierarchical Linear and Nonlinear Modeling. Lincolnwood, IL: Scientific Software International; 2004. [Google Scholar]
- 32.SAS/STAT Version 9.1 [computer program] Cary, NC: SAS Institute Inc; 2003. [Google Scholar]
- 33.Johnston GM, Gibbons L, Burge FI, et al. Identifying potential need for cancer palliation in Nova Scotia. Can Med Assoc J. 1998;158:1691–1698. [PMC free article] [PubMed] [Google Scholar]
- 34.Catt S, Blanchard M, Addington-Hall J, et al. Older adults’ attitudes to death, palliative treatment and hospice care. Palliat Med. 2005;19:402–410. doi: 10.1191/0269216305pm1037oa. [DOI] [PubMed] [Google Scholar]
- 35.Grande GE, Farquhar MC, Barclay SI, et al. The influence of patient and carer age in access to palliative care services. Age Ageing. 2006;35:267–273. doi: 10.1093/ageing/afj071. [DOI] [PubMed] [Google Scholar]
- 36.Grande GE, McKerral A, Todd CJ. Which cancer patients are referred to Hospital at Home for palliative care? Palliat Med. 2002;16:115–123. doi: 10.1191/0269216302pm519oa. [DOI] [PubMed] [Google Scholar]
- 37.Lackan NA, Ostir GV, Freeman JL, et al. Decreasing variation in the use of hospice among older adults with breast, colorectal, lung, and prostate cancer. Med Care. 2004;42:116–122. doi: 10.1097/01.mlr.0000108765.86294.1b. [DOI] [PubMed] [Google Scholar]
- 38.Virnig BA, McBean M, Kind S, et al. Hospice use before death: variability across cancer diagnoses. Med Care. 2002;40:73–78. doi: 10.1097/00005650-200201000-00010. [DOI] [PubMed] [Google Scholar]
- 39.Yip AM, Kephart G, Veugelers PJ. Individual and neighbourhood determinants of health care utilization: implications for health policy and resource allocation. Can J Pub Health. 2002;93:303–307. doi: 10.1007/BF03405022. [DOI] [PMC free article] [PubMed] [Google Scholar]
- 40.Kephart G, Thomas VS, MacLean DR. Socioeconomic differences in the use of physician services in Nova Scotia. Am J Public Health. 1998;88:800–803. doi: 10.2105/ajph.88.5.800. [DOI] [PMC free article] [PubMed] [Google Scholar]
- 41.Roos LL, Stranc L, James RC, et al. Complications, comorbidities and mortality: improving classification and prediction. Health Serv Res. 1997;32:229–238. [PMC free article] [PubMed] [Google Scholar]
- 42.Finkelstein MM. Ecologic proxies for household income: how well do they work for the analysis of health and health care utilization? Can J Pub Health. 2004;95:90–94. doi: 10.1007/BF03405773. [DOI] [PMC free article] [PubMed] [Google Scholar]
- 43.Demissie K, Hanley JA, Menzies D, et al. Agreement in measuring socio-economic status: area-based versus individual measures. Chronic Dis Can. 2000;21:1–7. [PubMed] [Google Scholar]
- 44.Kwok RK, Yankaskas BC. The use of census data for determining race and education as SES indicators: a validation study. Ann Epidemiol. 2001;11:171–177. doi: 10.1016/s1047-2797(00)00205-2. [DOI] [PubMed] [Google Scholar]
- 45.Lasserre V, Guihenneuc-Jouyaux C, Richardson S. Biases in ecological studies: utility of including within-area distribution of confounders. Statist Med. 2000;19:45–59. doi: 10.1002/(sici)1097-0258(20000115)19:1<45::aid-sim276>3.0.co;2-5. [DOI] [PubMed] [Google Scholar]
- 46.Tugwell P, Kristjansson B. Moving from description to action: challenges in researching socio-economic inequalities in health. Can J Pub Health. 2004;95:85–87. doi: 10.1007/BF03405772. [DOI] [PMC free article] [PubMed] [Google Scholar]
- 47.Glazier RH, Creatore MI, Agha MM, et al. Socioeconomic misclassification in Ontario’s health care registry. Can J Pub Health. 2003;94:140–143. doi: 10.1007/BF03404588. [DOI] [PMC free article] [PubMed] [Google Scholar]
- 48.Mustard CA, Derksen S, Berthelot JM, et al. Assessing ecologic proxies for household income: a comparison of household and neighbourhood level income measures in the study of population health status. Health Place. 1999;5:157–171. doi: 10.1016/s1353-8292(99)00008-8. [DOI] [PubMed] [Google Scholar]
- 49.Hunt RW, Fazekas BS, Luke CG, et al. The coverage of cancer patients by designated palliative services: a population-based study, South Australia, 1999. Palliat Med. 2002;16:403–409. doi: 10.1191/0269216302pm571oa. [DOI] [PubMed] [Google Scholar]
- 50.Kite S. Palliative care for older people. Age Ageing. 2006;35:459–460. doi: 10.1093/ageing/afl069. [DOI] [PubMed] [Google Scholar]
- 51.Teno JM. Measuring end-of-life care outcomes retrospectively. J Palliat Med. 2005;8(Suppl 1):S42–S49. doi: 10.1089/jpm.2005.8.s-42. [DOI] [PubMed] [Google Scholar]