

Abstract
The intermediate filament network of astrocytes includes Glial fibrillary acidic protein (Gfap) as a major component. Gfap mRNA is alternatively spliced resulting in generation of different protein isoforms where Gfapα is the most predominant isoform. The Gfapδ isoform is expressed in proliferating neurogenic astrocytes of the developing human brain and in the adult human and mouse brain. Here we provide a characterization of mouse Gfapδ mRNA and Gfapδ protein. RT-qPCR analysis showed that Gfapδ mRNA and Gfapα mRNA expression is coordinately increased in the post-natal period. Immunohistochemical staining of developing mouse brain samples showed that Gfapδ is expressed in the sub-ventricular zones in accordance with the described localization in the developing and adult human brain. Immunofluorescence analysis verified incorporation of Gfapδ into the Gfap intermediate filament network and overlap in Gfapδ and Gfapα subcellular localization. Subcellular mRNA localization studies identified different localization patterns of Gfapδ and Gfapα mRNA in mouse primary astrocytes. A larger fraction of Gfapα mRNA showed mRNA localization to astrocyte protrusions compared to Gfapδ mRNA. The differential mRNA localization patterns were dependent on the different 3′-exon sequences included in Gfapδ and Gfapα mRNA. The presented results show that alternative Gfap mRNA splicing results in isoform-specific mRNA localization patterns with resulting different local mRNA concentration ratios which have potential to participate in subcellular region-specific intermediate filament dynamics during brain development, maintenance and in disease.
Introduction
Glial fibrillary acidic protein (Gfap) is a component of the intermediate filaments in astrocytes together with Vimentin and Nestin [1]. The intermediate filaments (diameter 8–12 nm) have an important function for signal transduction and structural properties of astrocytes and form the cellular cytoskeleton together with microtubules (diameter 25 nm) and actin microfilaments (diameter 7 nm) [2], [3]. The intermediate filament proteins have a well conserved central helical rod domain involved in filament assembly through dimerization and multimerization and head and tail domains of variable size and amino acid sequence [2]. The head and tail domains can influence assembly of filaments. Gfap and Vimentin are classified as type III intermediate filament proteins due to their capacity to assembly into both homomeric and heteromeric intermediate filaments whereas Nestin belongs to type IV which requires heteromeric intermediate filament proteins for filament assembly [3], [4].
In humans at gestational week 9–12 Gfap expression starts in the radial glial cells [5], [6], [7]. Radial glial cells are bipolar cells in the ventricular zone (VZ) which express Nestin and Vimentin and have neuronal stem cell potential [8], [9]. During the second half of gestation Gfap expression increases and also becomes evident in the arising subventricular zone (SVZ) which persists into adulthood [5], [7], [10], [11], [12], [13]. Gfap expression increases during the maturation and differentiation of the precursor cells whereas Nestin and Vimentin expression decreases. Some astrocytes maintain co-expression of Vimentin and Gfap [14], [15]. Gfap expression is induced by brain damage and CNS degeneration and is also induced during ageing, and altered Gfap expression is associated with a variety of neurological diseases [16], [17]. Increased expression of Gfap, together with Vimentin and Nestin, and enlargement of astrocytes is indicative of reactive gliosis [18]. Gfap missense mutations in the rod and tail domains are involved in Alexander disease where astrocytes accumulate Gfap containing cytoplasmic aggregates [19]. The differences in Gfap expression can alter the morphology of astrocytes with direct consequences for a variety of astrocyte functions during development and ageing, and also have indirect consequences for other CNS cell types [17].
The Gfap gene has nine exons and spans 10 kb in the human genome. At least eight different Gfap mRNA isoforms exist which are generated as a consequence of alternative mRNA splicing and polyadenylation signal selection [16], [17], [20], [21], [22], [23], [24]. Corresponding Gfap proteins can be expressed in specific astrocyte subtypes and possess the capability to modify the astrocyte intermediate filament network. In humans the most abundant Gfap isoform in the CNS is Gfapα (432 amino acids) [17], [21]. Alternative mRNA splicing combined with alternative polyadenylation of the human Gfap gene intron 7 generates a novel exon, E7a, which together with exons 1 to 7 encodes the Gfapδ isoform (431 amino acids) (Fig. 1A) [21], [22], [25]. We previously abbreviated this isoform Gfapε [20], [21], [26] but accept the nomenclature by Middeldorp and Hol and will following use the nomenclature Gfapδ [17], [22], [25]. The mRNA expression level of Gfapδ is in the order of 10-fold lower than Gfapα [21], [22], [23], [27]. The Gfapδ isoform has a novel tail domain and thereby lacks the capability to assembly into homomeric Gfapδ intermediate filaments but forms heteromeric intermediate filaments with Gfapα and Vimentin [23], [26], [27]. An increased Gfapδ level can result in a Gfap and Vimentin intermediate filament collapse [26], [27]. Moreover, Gfapδ has a specific capacity to form interactions with the Presenilin proteins [21]. Thus, Gfapδ has the potential to function as a modulator of the Gfap filament structure and associations with other proteins, which could influence astrocyte function. In mouse the Gfapδ tail domain is 41 amino acids and 71% homologous to the human Gfapδ tail domain [21], [28]. The rat Gfapδ tail domain is 33 amino acids and 75% homologous to the human Gfapδ tail domain [23], [25], [28]. The degree of homology between mammalian Gfapδ tail domains are lower than for the other Gfap protein sequences [28]. The Gfapδ isoform is only identified in mammals and the alternative exon E7a is proposed to be under a different evolutionary selection pressure than other Gfap gene exons [28].
Figure 1. mRNA for the alternative spliced Gfap isoform Gfapδ is expressed in the postnatal mouse brain.
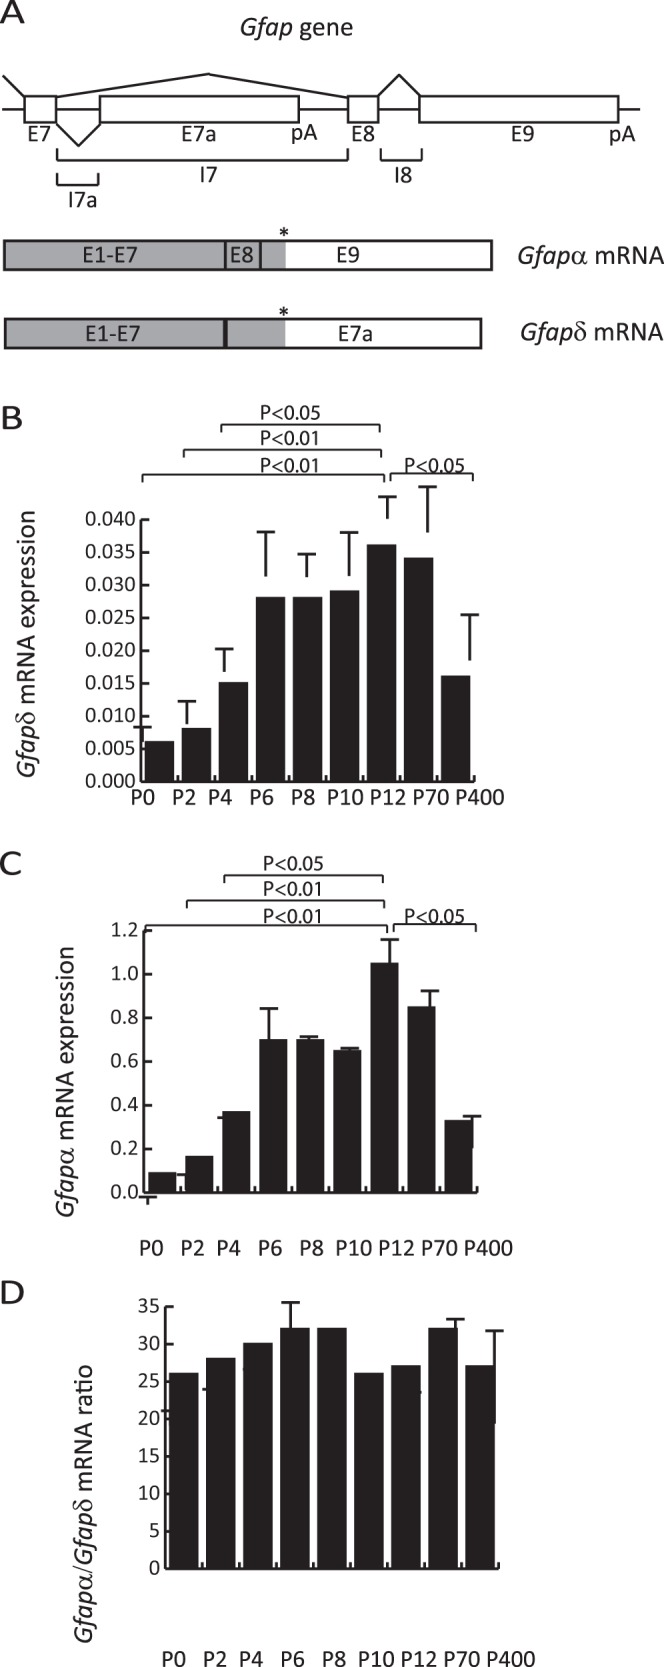
(A) Schematic drawing of the mouse Gfap locus. pA indicate positions of poly-adenylation signals in exons E7a and E9. (*) indicate positions of translational stop codons in exons E7a and E9. Coding regions are shown in grey. (B–C) Expression analysis of Gfapδ (B) and Gfapα (C) mRNA in postnatal mouse brain samples. RNA was isolated from cortices at the indicated time points. cDNA was used in RT-qPCR experiments with primer combinations specific for Gfapδ and Gfapα cDNA. Results are normalized to the b2m mRNA expression level which is determined as reference gene by GeNorm analysis. Results are presented as mean +/− SD. P-values for the expression levels compared to the P12 expression level were calculated by a Student’s unpaired two tailed t-test. The results represent three independent RT-qPCR experiments from one brain sample cohort. Another independent brain sample cohort gave similar results. (D) The post-natal expression ratio between Gfapα and Gfapδ mRNA is constant. The expression ratio at different time points using the values from panels B and C was calculated and presented as mean +/− SD.
A detailed examination of Gfapδ expression has been performed in the developing human brain showing that at 13–15 weeks of gestation Gfapδ and Gfapα are expressed in parallel in the VZ radial glial cells [11]. From around week 17 of gestation, the neuronal progenitors of the SVZ also express Gfapδ and this expression continues until birth [11]. In human and mouse post-natal Gfapδ expression is observed in a specific subpopulation of astrocytes located along the ventricles in the subventricular zone (SVZ) and in the subpial zone [11], [22], [23], [29]. The SVZ astrocytes express more Gfapδ than astrocytes in adjacent locations and the Gfap expression is highly variable [30]. The Gfapδ positive cells are proposed to constitute neural stem cells of the developing and adult brain [17], [23]. Gfapδ expression is also determined in the rostral migratory stream and the olfactory bulb [23], [30]. In addition, subpopulations of astrocytes express Gfapδ and Vimentin such as fibrillary astrocytes in the molecular layer of the supratentorial cortex and astrocytes of the glia limitans [31]. Together, these studies indicate that in the developing and adult human brain a subgroup of Gfapδ positive cells can represent proliferating neurogenic astrocytes. A recent report showed that all astroglia cells in the developing and adult mouse brain express Gfapδ regardless of the neurogenic potential indicating that in mice Gfapδ is not a neural stem cell marker as in humans [32].
We here extend the characterization of Gfapδ in the mouse brain and describe that the Gfapδ and Gfapα mRNA isoforms have distinct subcellular localization patterns which indicates a novel mechanism for regulation of Gfap intermediate filament dynamics.
Materials and Methods
Ethics Statement
Gfap(−/−) and Gfap(+/+) mouse tissue slides were a generous gift from Dr. S. Itohara and the animal experiments to prepare these tissue slides [33], [34] have been approved and performed according to the guidelines of the Animal Care, Regulation of Infectious Agents and Experimental Committee, National Institute of Animal Health, Japan.
Killing of experimental animals (for example for collection of organs for further examinations) without prior intervention (surgery, medical treatments, etc.) is not considered an animal experiment and does not require prior approval.
RNA Purification and RT-qPCR of Brain Samples
Mouse cortices were dissected from P0, P2, P4, P8, P10, P12, P70, and P400 mice. RNA was purified by standard phenol chloroform extraction methods using 1 µg of glycogen for precipitation. cDNA was made using an iScript cDNA synthesis kit (Bio-Rad). 1 µl of total RNA solution was used per reaction. Real time quantitative PCR (RT-qPCR) was performed using SYBR Green 480 master mix (Roche). RT-qPCR analyses were performed using a Roche Lightcycler™ 480 with annealing temperature of 58°C. A common forward primer, Gfap-all, F, ACATCGAGATCGCCACCTACA, was used with the following Gfap isoform specific reverse primers: Gfapδ, R, CCATTTTCAATCTGGTGAGCCTG; Gfapα, R, CCTTCACATCACCACGTCCTTG; Gfapκ, R, AGATGCATGCCCTAGGATCCT [20], [21], [23]. The primers were designed as intron spanning and PCR primers were determined to have amplification efficiencies close to 100% and specificity and integrity of amplicons were verified by gel electrophorese and melting curve peak analysis. All Ct values (for the presented mouse P0 to P400 brain samples) used for quantitation of transcript levels were within the detection limit. RT-qPCR amplifications were made in triplicates for each gene and the Ct values were converted into linear values using the Xo method [35]. Results are presented as mean +/− standard deviation (SD) and represent three independent RT-qPCR experiments. To select for normalization genes in RT-qPCR analysis the expression levels of potential reference genes in the postnatal brain cDNA samples were assessed and used for GeNorm analysis [36]: Gapdh, F, GGTGAAGGTCGGTGTGAACG, R, CTCGCTCCTGGAAGATGGTG; Actb, F, ACACAGTGCTGTCTGGTGGT, R, CTGGAAGGTGGACAGTGAGG; beta-2-Microglobulin (b2m), F, AGACTGATACATACGCCTGCAG, R, GCAGGTTCAAATGAATCTTCAG; Arpc3, F, TTTCCTCTCAACGCCATTTA, R, ACCTTCTCACACAGCCTCAG. b2m was superior in fulfilling the GeNorm criteria and the presented RT-qPCR data for postnatal brain samples are normalized to the b2m mRNA expression level.
Mouse Primary Astrocyte Cultures, Boyden Chamber Analysis and Direct RNA Sequencing (DRS)
Mouse primary astrocyte cultures were prepared from the cerebral cortex of P0 NMR1 mice (Taconic, Denmark) as previously described [37]. RNA and protein from primary astrocyte protrusions were isolated using a modified Boyden chamber assay as described [37]. The RNA expression levels in the cell protrusion fraction (PF, Boyden chamber membrane underside) and in the cell body fraction (CF, Boyden chamber membrane upper side) of Actb, Gfapκ, Gfapδ and Gfapα mRNA were determined by RT-qPCR. The values were used to calculate the relative mRNA localization ratio between PF and CF. Arpc3 mRNA is not differentially localized in mouse primary astrocytes and the localization ratio was given the value 1 [37]. The calculated mRNA localization ratios were normalized to the Arpc3 mRNA localization ratio. Results are presented as mean +/− SD. P-values for differences in the localization ratios were calculated by a Student’s unpaired two tailed t-test. All experiments were repeated three times.
RNA isolated from PF and CF pools from three independent Boyden Chamber assays were sequenced by the direct RNA sequencing (DRS) method using the Helicos Biosciences platform (Helicos Biosciences) as previously described [38]. Expression values were processed as RNA transcripts per million reads (tpm). The RNA enrichment in cell protrusions was presented as the relative expression value in PF compared to CF. P-values for DRS mRNA localization data were calculated by Fisher’s exact test.
FISH
Single RNA FISH was essentially made as described in previous protocols [39]. Briefly, probes consisting of 50-mer single stranded DNA oligonucleotides were synthesized and labeled with Cy3 fluorophore for Gfapα FISH analysis or Cy3.5 fluorophore for Gfapδ FISH analysis. A total of eight various oligonucleotides were hybridized to each target mRNA. The Gfap FISH probes were synthesized by an automated DNA/RNA synthesizer Model 392/394 (Applied Biosystems). Sequences of FISH probes are available in Table S1. Mouse primary astrocytes were seeded onto 18 mm Ø, 0.17 mm thick coverslips (Marienfeld) and cultured as described above. At approximately 60% confluence cells were fixed in 4% paraformaldehyde for 20 min at room temperature, and washed and stored in PBS at 4°C. Before hybridization cells were permeabilized using 0.5% triton X-100 in PBS for 10 min at room temperature, washed in PBS, and then incubated in prehybridization solution, 50% formamide (Sigma; F4761) and 2×SSC (Ambion), for 15 min at room temperature. The probes were hybridized in prehybridization solution supplemented with 2 mg/ml BSA (Roche), 0.2 mg/ml Escherichia coli tRNA (Roche), and 0.2 mg/ml sheared salmon sperm DNA (Sigma; D7656) for 3 h at 37°C. 10 ng DNA probe was used per coverslip. Cells were washed twice with prehybridization solution for 20 min at 37°C, then 10 min in 2 × SSC at room temperature, and in PBS for 10 min at room temperature. Cell nuclei were counterstained with DAPI (0.5 mg/L in PBS). After a final wash in PBS, coverslips were rinsed in double distilled water to remove excess salt, dried and mounted using ProLong gold (Invitrogen).
Immunohistochemistry
Rabbit monoclonal antibodies were raised against a peptide with a sequence from the mouse Gfapδ tail, GGKSTKEGEGQKVTRPLKRL, on a commercial basis (Thermo Scientific). The antibodies were affinity purified before usage. By western blotting and immunohistochemical the Gfapδ antibody PA2190 was selected for use in the subsequent analysis. We note the presence of a DBA and 129X1 mice SNP which changes the P residue to H in the mouse Gfapδ tail sequence from which the antigen peptide was selected.
Mouse brains from ages P3, P10 and P70 were immersion fixed in formalin, and paraffin-embedded tissue blocks were produced from various brain regions. 10 µm coronal sections were mounted on coated glass slides. The sections were de-paraffinized and boiled in PBS for 25 min to obtain antigen retrieval. The slides were treated with peroxidase block (DAKO) for 5 min, and blocked with bovine serum albumin (BSA) (1 mg/ml) for 10 min. Immunohistochemical analysis were performed using the EnVision+ System-HRP-DAB (DAKO). Pan-Gfap antibody (Polyclonal Rabbit Anti-Gfap, Z0334, Dako) was diluted 1∶3000 incubation 30 min; Nestin antibody (Ms x Nestin, MAB353, Millipore) was diluted 1∶200 incubation 30 min; Vimentin antibody (Mouse monoclonal [VI-10], ab20346, Abcam) was diluted 1∶1500 incubation30 min; Gfapδ antibody (PA2190) was diluted 1∶400 incubation 2 h. The pan-Gfap antibody recognizes both Gfapδ and Gfapα. The brain sections were counterstained with haematoxylen solution. The slides were finally cover slipped with Faramount Aqueous Mounting Medium (DAKO), and analysed by a Leica DM 2500 microscope using Leica IM50 4.0 software. Gfap(−/−) and Gfap(+/+) mouse tissue slides were a generous gift from Dr. S. Itohara and prepared as described [33], [34]. Briefly, brains from 3 month mice were fixed by intracardiac perfusion with neutral buffered formalin followed by rehydration and embedding in paraffin. Coronal sections (4 µm) including the hippocampal region were used for immunohistochemical staining as described above.
siRNA and DNA Vector Transfections
For siRNA experiments 1000000 primary mouse astrocytes were immediately before the transfection plated into 10 cm dishes in DMEM with 10% FCS. In 640 µl serum free medium was mixed siRNA to a final concentration of 2 µM and incubated for 5 min. 13 µl Dharmafect was mixed with 1267 µl serum free medium and incubated 5 min. The two solutions were mixed and incubated 20 min, added to the cells, and incubated 24 h. The medium was changed to serum free medium and cells incubated for further 48 h. For Gfapδ depletion we used a mix of two siRNA both targeting the Gfapδ 3′-UTR. siRNA sequences (sense): Gfapδ (1), GGUUAUACCGAUAGAGCUA(dTdT); Gfapδ(2), GAUUCAGCCCAGAGGGUUA(dTdT); non-specific control: AGGUAGUGUAAUCGCCUUG(dTdT) (Eurofins MWG Operon). In the mouse Gfapδ NM_001131020 reference sequence Gfapδ(1)siRNA target nucleotides 1669–1687 and Gfapδ(2) siRNA target nucleotides 2517–2535, both in the 3′-UTR. We note that these siRNA also will target the Gfapκ isoform (data not shown) since the entire Gfapδ mRNA sequence is included in the Gfapκ mRNA [40]. Results are presented as mean +/− SD and represent three independent RT-qPCR experiments. Data were normalized for the gapdh expression level or actb expression level with similar results (data not shown). The siRNA transfections and examination of mRNA and corresponding protein levels were verified in a biological replicate.
The Gfap minigene in the background of pTAG4 was previously described [20]. For each transfection were used 150000 NIH3T3 cells or primary mouse astrocytes cells in 6-well plates using 200 µl serum free medium and 3 µl Xtreme Gene 9 DNA transfection reagent version 03 (Roche). Cells were incubated 24 h before a medium shift to serum free medium and a subsequent incubation for 24 h. The cells were used in a standard Boyden chamber assay with 1.0 µM membranes and RNA was purified from the protrusion fraction (PF) and cell body fraction (CF) from 3 membranes for each transfection and pooled. Primers for RT-qPCR analysis of Gfapδ and Gfapα chimerical mRNA expressed from pTAG4 were previously described [20]. Results are presented as mean +/− SD and P-values for differences in the localization ratios were calculated by a Student’s unpaired two tailed t-test.
Western Blotting
A P2 mouse brain extract and protein fractions isolated from the Boyden chamber upper and lower sides were mixed with 5× Loading buffer (Fermentas) and 20× Reducing agent (Fermentas) to a final concentration of 1×. The samples were heated to 95°C for 5 min and centrifuged 1 min at 16000 rpm at room temperature. Samples were loaded onto a Tris-HCl Ready Gel 4–15% (Biorad) and processed at 45 mA until the loading buffer had reached the bottom. Proteins were transferred to a hybond-P membrane (GE Healthcare) at 75V for 30 min at 4°C, and the membrane blocked in 10% skimmed milk powder (Difco) mixed with PBS and 1% Tween 20 (Sigma-Aldrich) for 4 h at room temperature. The membrane was incubated with primary antibodies diluted in PTM buffer (PBS containing 0.5% skimmed milk power and 0.1% Tween 20) ON at 4°C. The membrane was washed in PTM three times and incubated with secondary polyclonal HRP-conjugated antibodies (Dako) diluted 1∶10000 in PTM-buffer 1 h at room temperature, and washed 5× in PTM-buffer. For signal detection was used BM Chemo-luminescence blotting substrate (Roche) and the signal developed (AGFA Curix 60) and monitored with X-ray film (Konica Minolta).
Immunofluorescence and Double Immunofluorescence
Cells were grown on 18×18×0.17 mm coverslips until 60% confluence, fixed in 4% paraformaldehyde for 20 min at room temperature, washed in PBS and stored in PBS at 4°C. Coverslips were incubated in 0.5% triton X-100 in PBS for 10 min at room temperature followed by several washes in PBS. Blocking was done using 1% BSA in PBS for 30 min at room temperature. Primary antibodies were dissolved in blocking buffer and incubated for 1 h at room temperature. Cells were washed 3 times in PBS and incubating with secondary antibody dissolved in blocking buffer. After 3 washes in PBS double immunofluorescence was performed as described above with a second treatment of primary and secondary antibodies. After final secondary antibody incubation cell were washed 2× and cell nuclei were stained with DAPI, then washed 1× in PBS. Coverslips were rinsed in double distilled water to remove salt, dried, and mounted with ProLong gold. Antibodies used were: Rabbit anti-Gfapδ (PA2190) diluted 1∶100; mouse anti-Vimentin (Abcam; ab20346) diluted 1∶100; and goat anti-Gfapα (GFAP (C-19), sc-6170, Santa Cruz) diluted 1∶100 [11]. Alexa conjugated secondary antibodies (InVitrogen) were diluted 1∶2000.
Microscopy and Image Processing
All images for FISH and IF analysis were made on a Zeiss axiovert 200 m microscope, with a plan apochromatic 63×1.4 NA objective, a HBO 100 W mercury light source, and a CoolSNAP-HQ cooled CCD camera (Photometrics) operated by MetaMorph®. Filters were from Chroma, Cy3 (41003), FITC (41001), and DAPI (31000), and narrow band pass filters were used for dual labeled RNA FISH Cy3 (SP-102v1) and Cy3.5 (SP-103v1). For RNA FISH we took z-stacks with 20 sections 0.2 µm step size and 500 ms exposure. For detection of RNA on a single molecule resolution, images were processed using the open source software Image J. Background noise was reduced by convolving all frames of a z-stack using a 9×9 gaussian kernel. Z-stacks were collapsed to a 2D maximum intensity projection, and single RNA molecule spots were detected using the “Find Maxima” function in Image J. For the shown immunofluorescence images a single, best in focus, 2D image was selected from a 20 sections z-stack.
Results
Characterization of the Gfapδ Isoform in Mouse
The mouse Gfapδ mRNA isoform from the Gfap gene was identified due to the homology to human Gfapδ [21] and the mRNA and protein expression was recently described in the mouse brain [23], [32]. A schematic description of the alternative Gfap splicing resulting in Gfapδ and Gfapα is shown in Fig. 1A. To examine Gfapδ expression during brain development mouse brain RNA was purified from different developmental times. In brain samples from embryonic mice Gfapδ expression was below the cut-off detection limit of the used RT-qPCR quantification method. From P0 to P12 an increased Gfapδ mRNA expression was detected (Fig. 1B). Expression was also present at the age of 14 months which was the last time point examined (Fig. 1B). The expression profile of Gfapδ was similar to Gfapα (Fig. 1C). In accordance, the ratio between the Gfapα and Gfapδ mRNA expression levels was constant at the examined time points (Fig. 1D). RT-qPCR analysis with different Gfapδ and Gfapα specific primer combinations systematically indicated an expression level in mouse of Gfapα 10-fold to 25-fold higher than Gfapδ (data not shown). This is in accordance with previous results [21], [23], [32].
Gfapδ is Expressed in Mouse Brain Astrocytes with Proximity to Ventricles
Due to the relatively low conservation of the Gfapδ tail domain between human, rat, and mouse, the cross reactivity of already developed human Gfapδ antibodies has not been satisfactory for immunocytochemically based analysis. To monitor the expression of Gfapδ protein we raised polyclonal antibodies against a peptide sequence corresponding to a mouse Gfapδ tail specific sequence. Western blotting analysis of mouse brain extracts with the antibody PA2190 showed reactivity towards protein with the expected Gfapδ size (Fig. 2A). Other generated antibodies showed similar recognition patterns in mouse brain protein extracts but the PA2190 Gfapδ antibody was used in subsequent analysis due to highest sensitivity. Mouse primary astrocytes were transfected with siRNA targeting Gfapδ mRNA, which resulted in a ten-fold reduction of the Gfapδ mRNA expression (Fig. 2B). We note a significant down regulation of Gfapα mRNA level, which could be explained by the siRNA complementarity to the Gfapα intron 7 (Fig. 2B). Notably, we observed reduced Gfapδ protein amounts upon siRNA treatment supporting the specificity of the Gfapδ antibody PA2190 (Fig. 2C). However, pan-Gfap Western blotting showed no significant decrease in Gfap protein despite the observed reduction in also Gfapα mRNA (Fig. 2B and 2C). For further control of Gfapδ antibody specificity we performed immunohistochemical staining on brain tissue slides from Gfap knock-out mice, Gfap(−/−), and corresponding Gfap(+/+) control with same genetic background (Figure 2D). Gfapδ staining that was seen in some cells close to ventricles in the wt mouse was absent in the Gfap(−/−) mouse (Fig. 2D). The observed staining at the cellular level was in accordance with staining of intermediate filament structures (Fig. 2D). Altogether these results supported that the used immunohistochemical staining protocol was specific for Gfapδ.
Figure 2. Characterization of mouse Gfapδ.

(A) Western blot analysis. A P0 mouse brain extract was analyzed by the Gfapδ antibody. (B) siRNA based characterization of Gfapδ. Mouse primary astrocytes were transfected with Gfapδ or control siRNA and RNA subsequently purified. Expression of Gfapα and Gfapδ mRNA was determined by RT-qPCR. Results are presented as mean +/− SD and represent three independent RT-qPCR experiments from material of 3 transfections. P-values were calculated by a Student’s unpaired two tailed t-test. (C) Western-blot analysis of mouse primary astrocytes transfected with Gfapδ or control siRNA. The purified protein extract were analyzed with antibodies for Gfapδ and pan-Gfap. For loading controls were used antibodies for histone H3 and Tubulin. (D) Gfapδ antibody specificity confirmation by immunohistochemical staining of Gfap(+/+) and Gfap(−/−) mouse brain slides. Immunohistochemical staining of formalin fixed Gfap(−/−) and corresponding wild type mouse Gfap(+/+) brain slides by Gfapδ antibody. The brain slides represent formalin fixed brains from 3 month old mice cut in coronal sections (4 µm) with the hippocampal region shown. The sections were counterstained with haematoxylin solution. DG, Dentate granule cells; M; Dentate molecular layer; LV, lateral ventricle. Right panels represent 10-fold enlargement of the boxed regions 1 and 2 shown in the left panels. Scale bar in left panels 200 µm. Scale bar in right panels 20 µm. Arrowheads in the right panels show Gfapδ staining along the LV in Gfap(+/+) mouse brain.
We performed a more detailed immunohistochemical analysis on mouse brain tissue from P3, P10 and P70. Consecutive brain slides were stained for Gfapδ, pan-Gfap, Vimentin, and Nestin expression (Fig. 3). The overall pattern of Gfapδ staining appeared as few positive cells in the P70 and P10 brains whereas Gfapδ immune reactivity was hardly detected in the P3 brain. In P70 and P10 brains most of the detected Gfapδ positive cells were present in regions with proximity to ventricles or directly along ventricles in a location corresponding to the SVZ (Fig. 3). The distribution of the Gfapδ positive cells along the ventricles was rather non-uniform (Fig. 3). The overall Gfapδ staining pattern was relatively similar at P70 and P10 (Fig. 3). Sections from P70 and P10 were stained with a pan-Gfap antibody which primarily targets Gfapα according to the highest absolute expression of this isoform. The pan-Gfap antibody also recognizes Gfapδ and we selected the use of pan-Gfap to visualize total amount of Gfap due to the very low efficiency of tested Gfapα specific antibodies in our immunohistochemical analysis. pan-Gfap showed a more widespread staining pattern than the Gfapδ antibody. The regions positive for Gfapδ were also positive in the pan-Gfap staining (Fig. 3). At P3 a clear pan-Gfap staining was observed (Fig. 3). Vimentin staining was observed at P70, P10 and P3. In the ventricular areas positive for Gfapδ some Vimentin staining was observed in agreement with co-expression in these cells of the intermediate filament proteins (Fig. 3). Nestin staining in the mouse P70, P10, and P3 brains was more restricted than Vimentin and pan-Gfap staining (Fig. 3). Only in a few groups of ependymal and ventricular cell areas Nestin and Gfap expression were overlapping (Fig. 3). In conclusion, the Gfapδ staining pattern in the post-natal mouse brain resembles findings in the adult human brain and supports that Gfapδ positive mouse brain regions also are Gfapα positive [11], [22], [29], [30], [31].
Figure 3. Immunohistochemical staining of Gfapδ in the mouse brain.

(A–B) Immunohistochemical staining of mouse P70 brain for Gfapδ (1), pan-Gfap (2), Vimentin (3) and Nestin (4). The sections were counterstained with haematoxylin solution. Upper section panels (A) illustrate lateral ventricle and lower section panels (B) the roof of 3rd ventricle. Ep, Ependymal lining; V, 3rd ventricle; CC, corpus callosum. (C–D) Immunohistochemical staining of mouse P10 brain. Upper section panels illustrate hippocampus (C) and lower section panels brain stem (D). Experimental settings were similar to panels in A–B. Ep, Ependymal lining; V, 4rd ventricle; H, Dentate Hilus; DG, Dentate granule cells; M; Dentate molecular layer; LV, lateral ventricle; DC, Diencephalon. (E) Immunohistochemical staining of mouse P3 brain. Panels illustrate brain stem. Experimental settings were similar to panels in A–B. Ep, Ependymal lining; V, 4rd ventricle. In all Gfapδ panels arrowheads indicate representative Gfapδ antibody stained cells and the corresponding regions also indicated by arrowheads in the pan-Gfap, Vimentin and Nestin stained sections. For all panels scale bar 20 µm.
Immunofluorescence Analysis of Gfapδ in Mouse Primary Astrocytes
To examine the subcellular localization of mouse Gfapδ we performed immunofluorescence analysis on cultured primary murine astrocytes. Most of the cells showed a filamentous localization with a Gfapα specific antibody [11]. We used a Gfapα specific antibody instead of pan-GFAP to allow detection of eventual lack in co-localization of Gfapα and Gfapδ. In the fraction of astrocytes with most Gfapα a filamentous Gfapδ localization also was observed (Fig. 4A and data not shown). Co-localization studies showed largely overlapping Gfapδ and Gfapα immunostaining patterns (Fig. 4A). The immunohistochemical analyses (Fig. 3) were pointing towards the existence of some brain regions with co-expression of Vimentin and Gfapδ [11]. Immunofluorescence analysis of the mouse primary astrocytes showed the existence of cells with a filamentous expression of both Gfapδ and Vimentin (Fig. 4B). Co-localization analysis showed only a partial overlap between Vimentin and Gfapδ containing filaments (Fig. 4B). In conclusion, immunofluorescence analysis showed also the presence of Gfapδ in the most Gfapα positive cells supporting that the two Gfap mRNA isoforms are transcriptional co-expressed.
Figure 4. Immunofluorescence analysis of Gfapδ.

(A) Co-localization analysis of Gfapα and Gfapδ. Mouse primary astrocytes were stained with primary Gfapδ antibody and Gfapα antibody. The nuclei were counterstained with DAPI. Merged image is included with Gfapα labeled green, Gfapδ labeled red and DAPI labeled blue. (B) Gfapδ and Vimentin have partial co-localization. Mouse primary astrocytes were stained with primary Gfapδ antibody and Vimentin antibody. The nuclei were counterstained with DAPI. Merged image is included with Vimentin labeled red, Gfapδ labeled green and DAPI labeled blue. Scale bar 10 µm.
Subcellular mRNA Localization Analyses of Gfapα and Gfapδ
Subcellular mRNA localization is mediated by a combination of mRNA cis-elements, as for example the Zip-code and G-rich sequences, and associated transport involved protein factors [41], [42]. Cis-regulatory elements are often residing in the 3′-UTR, and alternative splicing and polyadenylation consequently generate different coding regions and 3′-UTRs of the Gfapα and Gfapδ isoforms [21]. Previous studies indicated that a fraction of the Gfap mRNA is actively localized to cell protrusions [43]. Therefore, we examined if mRNA localization could be different between Gfapα and Gfapδ. We have recently described a modified Boyden chamber based method to isolate mRNA present in astrocyte protrusions [37]. The mRNA present in protrusions from mouse primary astrocytes was isolated from the underside of the Boyden chamber membrane, whereas total cellular mRNA was represented by cell material from the membrane upper side. By RT-qPCR we examined for Gfapδ and Gfapα mRNA accumulation in the protrusion fraction (PF) and compared it to the entire cell represented by the Boyden chamber upper side cell body fraction (CF). The primer combinations described in Fig. 1 were used for the RT-qPCR analysis. In addition, we analyzed the expression of Actb mRNA and Arpc3 mRNA where the latter have uniform distribution in the mouse primary astrocyte cytoplasm [37]. Relative to arpc3 mRNA, a 13-times increase in Gfapα mRNA accumulation was observed in primary astrocyte protrusions (Fig. 5A). To this end, it is very important to note that only a small fraction of the total amount of Gfapα mRNA localizes to the protrusions and the localization ratio indicates the grade of Gfapα mRNA enrichment relatively to Arpc3 mRNA. The localization ratio for Gfapδ mRNA was similar to Actb and Arpc3 mRNA (Fig. 5A). This supports that the exon E7a present in Gfapδ lacks mRNA localization signals present in the 3′-sequence of Gfapα mRNA. The Gfapκ mRNA isoform includes the intron 7a sequence compared to the Gfapδ mRNA [40] (Fig. 1A) and accordingly Gfapκ mRNA also lacks Gfapα exon 8 and exon 9 which could contribute to mRNA localization. By RT-qPCR we determined that Gfapκ mRNA, similar to Gfapδ mRNA, lacked mRNA localization in astrocyte protrusions (Fig. 5A). Thus, the different Gfap mRNA isoforms display different mRNA localization patterns in astrocyte protrusions.
Figure 5. Gfapα and Gfapδ have isoform specific subcellular mRNA localization.

(A) RT-qPCR analysis of the relative localization of Gfapα, Gfapκ and Gfapδ mRNA from the astrocyte protrusion fraction (PF) and the cell body fraction (CF). The localization ratio is visualized relative to the localization ratio for Arpc3 mRNA given the value 1. actb mRNA localization was also examined. Results are presented as mean +/− SD and represent three independent RT-qPCR experiments from material representing 2 independent Boyden chamber inserts. P-values were calculated by a Student’s unpaired two tailed t-test. (B) Western blotting analysis of Gfapδ, pan-Gfap, Actb and histone H3 protein from astrocyte protrusion fraction (PF) and cell body fraction (CF). (*) indicates an uncharacterized band of approximately 60 kD enriched in protrusions. (C) Gfap minigene based mRNA localization analyses. Mouse primary astrocytes and NIH3T3 cells were transfected with a Gfap minigene inserted in the pTAG4 vector. Following a Boyden chamber analysis purified RNA samples from protrusions and cell bodies were analyzed by RT-qPCR with primer combinations specific for Gfapα and Gfapδ mRNA expressed from the pTAG4 minigene and mRNA localization ratios determined by division. Results are presented as mean +/− SD and represent three independent RT-qPCR experiments from 2 independent Boyden chamber inserts. P-values were calculated by a Student’s unpaired two tailed t-test. (D–E) FISH analyses showing representative examples of Gfapα and Gfapδ mRNA localization in mouse primary astrocytes. The cells were probed with a mixture of 8 Gfapδ mRNA Cy3.5 labeled probes and 8 Gfapα mRNA Cy3 labeled probes (left panels). FISH images were analyzed for spot detection (central panels) as described in the materials and methods section. The nuclei were counterstained with DAPI. A merged image is shown with Gfapα labeled red, Gfapδ labeled green and DAPI labeled blue. Arrowheads show astrocyte protrusions and for all panels scale bars represent 20 µm.
We performed a direct RNA sequencing (DRS) of polyadenylated RNA isolated from primary mouse astrocyte protrusions and cell bodies. In this experiment no amplifications of material is introduced and RNA sequences are obtained corresponding to the polyadenylated region. Extracting Gfap mRNA data from the DRS experiment again showed a relative increased Gfapα mRNA localization to cell protrusions compared to Gfapδ (Table 1). It should be noted that the Gfapκ isoform share a common mRNA 3′-terminal exon sequence with Gfapδ, and therefore sequence reads from both isoforms will be uniformly aligned and counted in the DRS experiment. Notably, Gfapδ is expressed to a higher level than Gfapκ pointing that Gfapδ will be the primary detected isoform in DRS [20], [23], [40].
Table 1. Direct RNA sequence analyses of Gfap mRNA isoform localization in mouse primary astrocyte protrusions.
| Transcript | Accession number | TPm Cell bodies | TPM protrusions | Ratio | P-value |
| Gfapα | NM_010277 | 6003 | 30759 | 5.12 | 9.4E-31 |
| Gfapδ | NM_001131020 | 581 | 269 | 0.46 | 0.54 |
| actb | NM_007393 | 6921 | 3849 | 0.56 | 1 |
| arpc3 | NM_019824 | 600 | 331 | 0.55 | 1 |
| tuba1a | NM_011653 | 5301 | 6154 | 1.16 | 7.0E-4 |
| rpl13 | NM_016738 | 2498 | 3699 | 1.48 | 2.4E-6 |
TPM, transcript number per million sequence reads. The total number of sequence reads was 5444770 for the cell body fraction and 2147050 for the protrusion fraction. Two-tailed p-values were calculated by Fisher’s exact test.
Protein expression analyses of cell fractions from protrusions (PF) and cell bodies (CF) from Boyden chamber experiments showed the same relative distribution of Actb, Gfapδ and Gfapα (Fig. 5B). Thus, the differences in Gfap mRNA localization were not equivalently reflected in major differences in protein localization patterns. This was in accordance with only a minor amount of the total Gfapα mRNA population specifically localizing to protrusions.
To determine if the different compositions of 3′-exons in Gfapδ and Gfapα were involved in mediating the localization of Gfapα mRNA to cell protrusions we performed cell transfection analyses with a Gfap minigene including the Gfap gene sequences from exon 6 to 1000 bp downstream the exon 9 located polyadenylation signal used for generation of Gfapα mRNA [20]. Mouse primary astrocytes were transfected with the minigene. Following a Boyden assay RNA was purified from protrusions and cell bodies and synthesized cDNA examined by RT-qPCR. The ectopic mRNA was measured by a common forward primer recognizing chimeric exon sequences from the minigene vector pTAG4 and reverse primers specifically for Gfapδ or Gfapα. Calculation of mRNA localization ratios showed 3.5-fold increased Gfapα mRNA localization relatively to Gfapδ (Fig. 5C). We observed a systematically inefficient transfection efficiency of mouse primary astrocytes with the Gfap minigene and accordingly also performed the localization experiment in a readably transfectable mouse cell line. For this we transfected the Gfap minigene in mouse NIH3T3 cells which previously were used as model in mRNA localization studies [41]. In this cellular background we observed 20-fold increase in Gfapα mRNA localization relatively to Gfapδ (Fig. 5C). From the minigene transfection experiments we conclude that the Gfapα specific 3′-exons include sequence determinants for Gfapα mRNA localization.
The RNA localization studies were extended by single molecule RNA fluorescence in situ hybridization (FISH) analysis. Primary astrocytes were analyzed simultaneous with 8 Gfapα and 8 Gfapδ mRNA FISH probes labeled with Cy3 and Cy3.5, respectively. The FISH probe sets were designed to have specificity towards each Gfap isoform (Table S1). Gfapδ mRNA FISH analysis resulted in a relative faint number of total signals (148 and 303 single RNA foci in the representative pictures shown in Fig. 5D and 5E, respectively) and with mRNA signals mostly restricted to the cell soma (Fig. 5D–E). Gfapα mRNA FISH analysis resulted in a larger number of signals (808 and 1469 single RNA foci in the representative pictures shown in Fig. 5D and 5E, respectively) dispersed through the cell including the cytoplasm, rim and protrusions (Fig. 5D–E). The Increased appearance of Gfapα FISH signals compared to Gfapδ supports the presence of a lower amount of Gfapδ mRNA compared to Gfapα mRNA. Incubating the cells with either Gfapα or Gfapδ mRNA probes individually gave similar results (data not shown). The FISH analysis further supported the localization of a fraction of Gfapα mRNA in astrocyte protrusions in alignment with the Boyden chamber analysis. The low level of Gfapδ mRNA hampered significant conclusions from the FISH analyses concerning a relative lower localization ratio of this isoform compared to Gfapα mRNA in astrocyte protrusions but were indicative of relative more Gfapδ mRNA in the central part of the cells.
Discussion
We here describe the characterization of the mouse Gfapδ isoform at the levels of mRNA and protein. The alternative processing of Gfap mRNA which results in generation of the Gfapδ protein isoform is conserved between human and mouse [20], [21], [23], [28]. In the Gfapδ transcript the exon 8 and 9 sequences used for generating the Gfapα mRNA isoform are skipped whereas a novel exon E7a generated from intron 7 is included [17], [21]. Exon E7a includes a novel polyadenylation signal whereby eliminating the use of the exon 9 located polyadenylation signal used for generation of Gfapα [20], [21]. Of notable difference in the Gfap gene structure between human and mouse is the presence of repetitive elements immediately after the Gfapδ exon E7a stop codon in mouse. The relative mRNA expression level of Gfapδ compared to Gfapα was previously estimated to be in the order of 10% [21], [23], [27], [32]. Our RT-qPCR analysis and direct sequence analysis are also in support of an mRNA expression ratio of this magnitude for these two Gfap isoforms. By screening postnatal mouse brain tissue for Gfapα and Gfapδ mRNA expression we found a coordinated expression. In embryonic tissue, the mRNA expression level of Gfapδ was undetectable with the sensitivity by our used RT-qPCR approach, whereas Gfapα expression was significantly detected, but to a relative low level (Data not shown). Vimentin and Nestin mRNA have expression levels in the mouse brain which gradually decreases post-natal. The Gfap expression results are concordant with previous analysis from the human, pig and mouse brains in where Gfapδ and Gfapα expression emerges from mid-gestation [11], [17], [22], [23], [32], [40].
The low degree of homology between the Gfapδ protein tail domains in mouse and human has hampered the use of antibodies developed to detect the human Gfapδ isoform in mouse tissue. Recently, a mouse Gfapδ antibody was described and Gfapδ expression in the adult and developing mouse brain carefully characterized [23], [32]. We here describe the generation of another antibody detecting mouse Gfapδ. In the characterization of the antibody specificity in Gfapδ siRNA transfected mouse primary astrocytes we observed that Gfapδ siRNA also was targeting the Gfapα mRNA expression level despite only recognizing intron 7 in the Gfapα primary RNA. Gfapδ and Gfapα expression levels were 10-fold and 3-fold down regulated, respectively. A coordinated Gfapδ protein down regulation was observed, but we did not observe such an effect for the Gfapα protein level. An effect of the siRNA for Gfapα mRNA expression could be dependent on nuclear events at the level of transcription and RNA processing and thereby affecting the de novo generation of Gfapα mRNA. This scenario is similar to the described transcriptional gene silencing by intron targeting exogenous siRNA [44]. In addition, the siRNA effect on the Gfapδ mRNA level could be on stability and translation of already present Gfapδ mRNA at the time of siRNA transfection and thereby have stronger effect on the Gfapδ protein level in the time frame of the siRNA experiment. Possible different protein stabilities of Gfapα and Gfapδ could also participate to the observation. We performed a characterization of Gfapδ expression at the protein level in the developing post-natal mouse brain and at the subcellular level in mouse primary astrocytes. In line with a coordinated expression of Gfapδ and Gfapα the immunofluorescence studies in mouse primary astrocytes showed that all filamentous Gfapδ positive cells also were filamentous Gfapα positive, and that a high Gfapα expression was prognostic for Gfapδ expression. Cells with an intermediate or low Gfapα expression had only faint or no filamentous Gfapδ staining. Gfapδ and Vimentin immunofluorescence studies showed that a subset of the primary astrocytes expresses both proteins, but that only partial co-localization was evident.
Immunohistochemistry studies showed rather identical Gfapδ staining patterns in P10 and P70 mouse brains. Immunohistochemistry analysis showed that Gfapδ expression in our assays was only at the limit of detection in the P3 mouse brain whereas at P3 we observed Gfapα, Vimentin and Nestin expression. We note that Gfapδ expression recently was described to increase from E18 to P5 and then decrease until plateauing at P25 [32]. One explanation of the faint Gfapδ staining at P3 in the immunohistochemical analysis could be the use of formalin fixed brain samples and not cryosections as described which could interfere with intermediate filament protein detection [32]. Gfapδ staining P10 and P70 was evident in proximity to the ventricles and was similar to Gfapδ staining patterns in the adult human brain [11], [22], [29], [30], [31] and in the adult mouse brain [23], [32]. The Gfapδ positive regions were also positive for Gfapα, shown by a pan-Gfap antibody, but this pan-Gfap staining was also present throughout other brain regions in accordance with a general astrocyte staining. The lack of detectable Gfapδ staining in such cells could be a consequence of sensitivity according to the relative low level of Gfapδ expression. Vimentin and Nestin staining was only incompletely overlapping in the Gfapδ positive regions. The lineage and function of Gfap positive astrocytes and ependymal cells of the postnatal SVZ have been carefully described [45], [46]. Radial glial cells transform into Gfap positive cells and ependymal cells in the SVZ and astrocytes at other locations. The Gfap positive cells are progenitors for neuroblasts and glioblasts. The glioblasts can differentiate into astrocytes or oligodendrocytes during development and following brain injury. In many ways, ependymal cells resemble astrocytes: they express Gfap, are derived from radial glial transformation, and maintain glycogen as a functional energy store. However, they are unique in that they possess cilia and do not contact neuroblasts. We found that Gfapδ is highest expressed in the SVZ in the mouse post-natal brain. This is largely concordant with other observations concerning Gfapδ [11], [22], [23], [29], [30], [31]. Recently it was shown that all astroglia cells in the developing and adult mouse brain express Gfapδ regardless of the neurogenic potential indicating that in mice Gfapδ is not a neural stem cell marker as in humans [32]. Our studies, together with previous observations, suggest that Gfapδ positive cells always express a high level of Gfapα and that the relative expression ratio is constant [20], [21], [23], [27], [31], [32]. That Gfapδ was detected only in a subset of the pan-Gfap positive cells could be a matter of detection sensitivity.
Much attention has been denoted to understanding how intermediate filaments are regulated during cell growth, migration and morphology changes. Transcriptional regulations, post-translational modifications, capability to assembly into filaments, and protein localization have been carefully addressed. Moreover, it has been more and more established from studies in various cell models that mRNA localization regulates local protein synthesis during cell growth and migration. Many localized mRNA species have been described and their localization identified in several cell types [42], [47], [48]. Only few studies have described localization of mRNA for intermediate filament proteins in astrocytes. Dahlstrand et al. demonstrated subcellular localization of the nestin mRNA in processes of pial end-feet of radial glial cells by in situ hybridization assay on tissue sections from embryonic E10 mouse brains [49]. Other studies have demonstrated localization of Gfap mRNA in the branch points and distal parts of astrocyte protrusion by In situ hybridization studies on cultured rat type-2 astrocytes and in Müller cells of the rat eye retina [43], [50]. We here show that the different 3′-exon sequences included in Gfapδ and Gfapα mRNA determines different subcellular mRNA localization patterns. The Gfapα mRNA is present at a higher relative level in cell processes compared to the cell body if compared to the Gfapδ mRNA. It is important to note that only a very minor fraction of the total amount of Gfapα mRNA is localized to protrusions. However, the ratio between Gfapα and Gfapδ mRNA will be different in astrocyte protrusions compared to cell bodies by this different mRNA localization capability. Whereas the general expression ratio between Gfapα and Gfapδ mRNA is constant during development and in different astroglia cell types, variations in ratios between the different Gfap mRNA isoforms can still exist at the subcellular level. The differences in mRNA localization are determined by mRNA sequences present in the distal part of the transcripts and in accordance with the general pattern for RNA localization cis-elements to be located in the 3′-UTR [42], yet, the exact mechanisms involved in the localization of Gfapα mRNA need further examination. In general, Gfap expression is gradually up-regulated as Nestin and Vimentin expression decreases during brain development. Vimentin and Nestin containing intermediate filaments have potential to act as scaffolds for the establishment of long term Gfap intermediate filaments [1], [49]. It is straightforward to make a simple model wherein Gfap filaments within astrocytes initially can be locally synthesized at specific subcellular regions as a consequence of mechanisms which at least to some extend includes specific mRNA localization, and during astrocyte maturation, Gfap filaments are expanded and become more uniformly distributed throughout the cytoplasm. In such a scenario it can be important to decrease the relative concentration of the Gfapδ isoform at specific intracellular localizations due to specific functional properties of Gfapδ in terms of filament forming capacity and interaction with other proteins [21], [23], [26]. This could generate Gfap intermediate filaments with distinct surface structures and accordingly functional capacities at specific subcellular regions within astrocytes. How Gfap gene alternative splicing and associated differences in mRNA localization is linked to functional consequences for the intermediate filament dynamics will require further studies.
Supporting Information
Sequences of FISH probes for Gfapδ and Gfapα mRNA.
(DOC)
Acknowledgments
We thank Dr. Shigeyoshi Itohara for the generous gift of the Gfap(−/−) and Gfap(+/+) mouse tissue slides.
Funding Statement
This project is funded by grants from the Lundbeck Foundation, Fonden til Lægevidenskabens Fremme, and NANONET COST [BM1002]. RT is a recipient of a PhD fellowship from the Faculty of Health Sciences, Aarhus University, Denmark. The funders had no role in study design, data collection and analysis, decision to publish, or preparation of the manuscript.
References
- 1. Eng LF, Ghirnikar RS, Lee YL (2000) Glial fibrillary acidic protein: GFAP-thirty-one years (1969–2000). Neurochem Res 25: 1439–1451. [DOI] [PubMed] [Google Scholar]
- 2. Herrmann H, Aebi U (2004) Intermediate filaments: molecular structure, assembly mechanism, and integration into functionally distinct intracellular Scaffolds. Annu Rev Biochem 73: 749–789. [DOI] [PubMed] [Google Scholar]
- 3. Eriksson JE, Dechat T, Grin B, Helfand B, Mendez M, et al. (2009) Introducing intermediate filaments: from discovery to disease. J Clin Invest 119: 1763–1771. [DOI] [PMC free article] [PubMed] [Google Scholar]
- 4. Szeverenyi I, Cassidy AJ, Chung CW, Lee BT, Common JE, et al. (2008) The Human Intermediate Filament Database: comprehensive information on a gene family involved in many human diseases. Hum Mutat 29: 351–360. [DOI] [PubMed] [Google Scholar]
- 5. deAzevedo LC, Fallet C, Moura-Neto V, Daumas-Duport C, Hedin-Pereira C, et al. (2003) Cortical radial glial cells in human fetuses: depth-correlated transformation into astrocytes. J Neurobiol 55: 288–298. [DOI] [PubMed] [Google Scholar]
- 6. Antanitus DS, Choi BH, Lapham LW (1976) The demonstration of glial fibrillary acidic protein in the cerebrum of the human fetus by indirect immunofluorescence. Brain Res 103: 613–616. [DOI] [PubMed] [Google Scholar]
- 7. Honig LS, Herrmann K, Shatz CJ (1996) Developmental changes revealed by immunohistochemical markers in human cerebral cortex. Cereb Cortex 6: 794–806. [DOI] [PubMed] [Google Scholar]
- 8. Gotz M, Hartfuss E, Malatesta P (2002) Radial glial cells as neuronal precursors: a new perspective on the correlation of morphology and lineage restriction in the developing cerebral cortex of mice. Brain Res Bull 57: 777–788. [DOI] [PubMed] [Google Scholar]
- 9. Noctor SC, Flint AC, Weissman TA, Wong WS, Clinton BK, et al. (2002) Dividing precursor cells of the embryonic cortical ventricular zone have morphological and molecular characteristics of radial glia. J Neurosci 22: 3161–3173. [DOI] [PMC free article] [PubMed] [Google Scholar]
- 10. Aquino DA, Padin C, Perez JM, Peng D, Lyman WD, et al. (1996) Analysis of glial fibrillary acidic protein, neurofilament protein, actin and heat shock proteins in human fetal brain during the second trimester. Brain Res Dev Brain Res 91: 1–10. [DOI] [PubMed] [Google Scholar]
- 11. Middeldorp J, Boer K, Sluijs JA, De Filippis L, Encha-Razavi F, et al. (2010) GFAPdelta in radial glia and subventricular zone progenitors in the developing human cortex. Development 137: 313–321. [DOI] [PubMed] [Google Scholar]
- 12. Tramontin AD, Garcia-Verdugo JM, Lim DA, Alvarez-Buylla A (2003) Postnatal development of radial glia and the ventricular zone (VZ): a continuum of the neural stem cell compartment. Cereb Cortex 13: 580–587. [DOI] [PubMed] [Google Scholar]
- 13. Sanai N, Tramontin AD, Quinones-Hinojosa A, Barbaro NM, Gupta N, et al. (2004) Unique astrocyte ribbon in adult human brain contains neural stem cells but lacks chain migration. Nature 427: 740–744. [DOI] [PubMed] [Google Scholar]
- 14. Bovolenta P, Liem RK, Mason CA (1984) Development of cerebellar astroglia: transitions in form and cytoskeletal content. Dev Biol 102: 248–259. [DOI] [PubMed] [Google Scholar]
- 15. Lazarides E (1982) Intermediate filaments: a chemically heterogeneous, developmentally regulated class of proteins. Annu Rev Biochem 51: 219–250. [DOI] [PubMed] [Google Scholar]
- 16. Hol EM, Roelofs RF, Moraal E, Sonnemans MA, Sluijs JA, et al. (2003) Neuronal expression of GFAP in patients with Alzheimer pathology and identification of novel GFAP splice forms. Mol Psychiatry 8: 786–796. [DOI] [PubMed] [Google Scholar]
- 17. Middeldorp J, Hol EM (2011) GFAP in health and disease. Prog Neurobiol 93: 421–443. [DOI] [PubMed] [Google Scholar]
- 18. Pekny M, Pekna M (2004) Astrocyte intermediate filaments in CNS pathologies and regeneration. J Pathol 204: 428–437. [DOI] [PubMed] [Google Scholar]
- 19. Brenner M, Johnson AB, Boespflug-Tanguy O, Rodriguez D, Goldman JE, et al. (2001) Mutations in GFAP, encoding glial fibrillary acidic protein, are associated with Alexander disease. Nat Genet 27: 117–120. [DOI] [PubMed] [Google Scholar]
- 20. Blechingberg J, Lykke-Andersen S, Jensen TH, Jorgensen AL, Nielsen AL (2007) Regulatory mechanisms for 3′-end alternative splicing and polyadenylation of the Glial Fibrillary Acidic Protein, GFAP, transcript. Nucleic Acids Res 35: 7636–7650. [DOI] [PMC free article] [PubMed] [Google Scholar]
- 21. Nielsen AL, Holm IE, Johansen M, Bonven B, Jorgensen P, et al. (2002) A new splice variant of glial fibrillary acidic protein, GFAP epsilon, interacts with the presenilin proteins. J Biol Chem 277: 29983–29991. [DOI] [PubMed] [Google Scholar]
- 22. Roelofs RF, Fischer DF, Houtman SH, Sluijs JA, Van Haren W, et al. (2005) Adult human subventricular, subgranular, and subpial zones contain astrocytes with a specialized intermediate filament cytoskeleton. Glia 52: 289–300. [DOI] [PubMed] [Google Scholar]
- 23. Kamphuis W, Mamber C, Moeton M, Kooijman L, Sluijs JA, et al. (2012) GFAP isoforms in adult mouse brain with a focus on neurogenic astrocytes and reactive astrogliosis in mouse models of Alzheimer disease. PLoS One 7: e42823. [DOI] [PMC free article] [PubMed] [Google Scholar]
- 24. Boyd SE, Nair B, Ng SW, Keith JM, Orian JM (2012) Computational characterization of 3′ splice variants in the GFAP isoform family. PLoS One 7: e33565. [DOI] [PMC free article] [PubMed] [Google Scholar]
- 25. Condorelli DF, Nicoletti VG, Barresi V, Conticello SG, Caruso A, et al. (1999) Structural features of the rat GFAP gene and identification of a novel alternative transcript. J Neurosci Res 56: 219–228. [DOI] [PubMed] [Google Scholar]
- 26. Nielsen AL, Jorgensen AL (2004) Self-assembly of the cytoskeletal glial fibrillary acidic protein is inhibited by an isoform-specific C terminus. J Biol Chem 279: 41537–41545. [DOI] [PubMed] [Google Scholar]
- 27. Perng MD, Wen SF, Gibbon T, Middeldorp J, Sluijs J, et al. (2008) Glial fibrillary acidic protein filaments can tolerate the incorporation of assembly-compromised GFAP-delta, but with consequences for filament organization and alphaB-crystallin association. Mol Biol Cell 19: 4521–4533. [DOI] [PMC free article] [PubMed] [Google Scholar]
- 28. Singh R, Nielsen AL, Johansen MG, Jorgensen AL (2003) Genetic polymorphism and sequence evolution of an alternatively spliced exon of the glial fibrillary acidic protein gene, GFAP. Genomics 82: 185–193. [DOI] [PubMed] [Google Scholar]
- 29. Leonard BW, Mastroeni D, Grover A, Liu Q, Yang K, et al. (2009) Subventricular zone neural progenitors from rapid brain autopsies of elderly subjects with and without neurodegenerative disease. J Comp Neurol 515: 269–294. [DOI] [PMC free article] [PubMed] [Google Scholar]
- 30. van den Berge SA, Middeldorp J, Zhang CE, Curtis MA, Leonard BW, et al. (2010) Longterm quiescent cells in the aged human subventricular neurogenic system specifically express GFAP-delta. Aging Cell 9: 313–326. [DOI] [PubMed] [Google Scholar]
- 31. Andreiuolo F, Junier MP, Hol EM, Miquel C, Chimelli L, et al. (2009) GFAPdelta immunostaining improves visualization of normal and pathologic astrocytic heterogeneity. Neuropathology 29: 31–39. [DOI] [PubMed] [Google Scholar]
- 32. Mamber C, Kamphuis W, Haring NL, Peprah N, Middeldorp J, et al. (2012) GFAPdelta Expression in Glia of the Developmental and Adolescent Mouse Brain. PLoS One 7: e52659. [DOI] [PMC free article] [PubMed] [Google Scholar]
- 33. Gomi H, Yokoyama T, Fujimoto K, Ikeda T, Katoh A, et al. (1995) Mice devoid of the glial fibrillary acidic protein develop normally and are susceptible to scrapie prions. Neuron 14: 29–41. [DOI] [PubMed] [Google Scholar]
- 34. Gomi H, Yokoyama T, Itohara S (2010) Role of GFAP in morphological retention and distribution of reactive astrocytes induced by scrapie encephalopathy in mice. Brain Res 1312: 156–167. [DOI] [PubMed] [Google Scholar]
- 35. Thomsen R, Solvsten CA, Linnet TE, Blechingberg J, Nielsen AL (2010) Analysis of qPCR data by converting exponentially related Ct values into linearly related X0 values. J Bioinform Comput Biol 8: 885–900. [DOI] [PubMed] [Google Scholar]
- 36. Vandesompele J, De Preter K, Pattyn F, Poppe B, Van Roy N, et al. (2002) Accurate normalization of real-time quantitative RT-PCR data by geometric averaging of multiple internal control genes. Genome biology 3: RESEARCH0034. [DOI] [PMC free article] [PubMed] [Google Scholar]
- 37. Thomsen R, Lade Nielsen A (2011) A Boyden chamber-based method for characterization of astrocyte protrusion localized RNA and protein. Glia 59: 1782–1792. [DOI] [PubMed] [Google Scholar]
- 38. Ozsolak F, Platt AR, Jones DR, Reifenberger JG, Sass LE, et al. (2009) Direct RNA sequencing. Nature 461: 814–818. [DOI] [PubMed] [Google Scholar]
- 39. Femino AM, Fay FS, Fogarty K, Singer RH (1998) Visualization of single RNA transcripts in situ. Science 280: 585–590. [DOI] [PubMed] [Google Scholar]
- 40. Blechingberg J, Holm IE, Nielsen KB, Jensen TH, Jorgensen AL, et al. (2007) Identification and characterization of GFAPkappa, a novel glial fibrillary acidic protein isoform. Glia 55: 497–507. [DOI] [PubMed] [Google Scholar]
- 41. Mili S, Macara IG (2009) RNA localization and polarity: from A(PC) to Z(BP). Trends Cell Biol 19: 156–164. [DOI] [PMC free article] [PubMed] [Google Scholar]
- 42. Shav-Tal Y, Singer RH (2005) RNA localization. J Cell Sci 118: 4077–4081. [DOI] [PMC free article] [PubMed] [Google Scholar]
- 43. Medrano S, Steward O (2001) Differential mRNA localization in astroglial cells in culture. J Comp Neurol 430: 56–71. [DOI] [PubMed] [Google Scholar]
- 44. Allo M, Buggiano V, Fededa JP, Petrillo E, Schor I, et al. (2009) Control of alternative splicing through siRNA-mediated transcriptional gene silencing. Nature structural & molecular biology 16: 717–724. [DOI] [PubMed] [Google Scholar]
- 45. Liu X, Bolteus AJ, Balkin DM, Henschel O, Bordey A (2006) GFAP-expressing cells in the postnatal subventricular zone display a unique glial phenotype intermediate between radial glia and astrocytes. Glia 54: 394–410. [DOI] [PubMed] [Google Scholar]
- 46. Sundholm-Peters NL, Yang HK, Goings GE, Walker AS, Szele FG (2004) Radial glia-like cells at the base of the lateral ventricles in adult mice. J Neurocytol 33: 153–164. [DOI] [PubMed] [Google Scholar]
- 47. Mili S, Moissoglu K, Macara IG (2008) Genome-wide screen reveals APC-associated RNAs enriched in cell protrusions. Nature 453: 115–119. [DOI] [PMC free article] [PubMed] [Google Scholar]
- 48. Wang W, van Niekerk E, Willis DE, Twiss JL (2007) RNA transport and localized protein synthesis in neurological disorders and neural repair. Dev Neurobiol 67: 1166–1182. [DOI] [PubMed] [Google Scholar]
- 49. Dahlstrand J, Lardelli M, Lendahl U (1995) Nestin mRNA expression correlates with the central nervous system progenitor cell state in many, but not all, regions of developing central nervous system. Brain Res Dev Brain Res 84: 109–129. [DOI] [PubMed] [Google Scholar]
- 50. Sarthy PV, Fu M, Huang J (1989) Subcellular localization of an intermediate filament protein and its mRNA in glial cells. Mol Cell Biol 9: 4556–4559. [DOI] [PMC free article] [PubMed] [Google Scholar]
Associated Data
This section collects any data citations, data availability statements, or supplementary materials included in this article.
Supplementary Materials
Sequences of FISH probes for Gfapδ and Gfapα mRNA.
(DOC)