

Abstract
Objective
The Keele Assessment of Participation (KAP) questionnaire measures person-perceived participation in 11 aspects of life. Participation allows fulfilment of valued life activities and social roles, which are important to older adults. Since we aimed to use the KAP in a larger Dutch cohort, we examined the measurement properties of KAP in a Dutch sample of older adults with joint pain and comorbidity.
Design
Cohort study.
Setting
A community-based sample in Amsterdam, the Netherlands and North Staffordshire, UK.
Participants
Participants were aged 65 years and over, had at least two chronic diseases (identified through general practice consultation) and reported joint pain on most days (questionnaire). The Dutch cohort provided baseline data (n=407), follow-up data at 6 months (n=364) and test–retest data 2 weeks after 6 months (n=122). The UK cohort provided comparable data (n=404).
Outcome measures
The primary outcome was person-perceived participation, as measured with the KAP. The measurement properties examined were the following: structural validity (factor analysis), internal consistency (Cronbach's α), reliability (intraclass correlation coefficients; ICC), construct validity (hypothesis testing), responsiveness (hypothesis testing and area under the curve) and cross-cultural validity (differential item functioning; DIF).
Results
Factor analysis revealed two domains: KAPd1: ‘participation in basic activities’ and KAPd2: ‘participation in complex activities’, with Cronbach's α of 0.74 and 0.57 and moderate test–retest reliability: ICC of 0.63 and 0.57, respectively. Further analyses of KAPd1 showed poor construct validity and responsiveness. Despite the uniform DIF in item ‘interpersonal relations’, the total KAPd1 score seemed comparable between the Dutch and UK sample.
Conclusions
Only KAP domain ‘participation in basic activities’ showed good internal consistency and sufficient reliability. KAPd2 lacks sufficient measurement properties for application in studies, although items may be used as single items. Further development of the concept ‘participation’ may help the development and validation of instruments to measure participation.
Keywords: Elderly, Pain, Comorbidity, Participation, Quality of Life, Psychometric
Article summary.
Article focus
Social participation is a key component of healthy ageing, predicts morbidity and mortality and is increasingly targeted in intervention studies.
Using a structured approach, this study examined the ability of the Dutch Keele Assessment of Participation (KAP) to measure social participation in community-dwelling older adults with joint pain and comorbidity.
Key messages
Measurement of person-perceived social participation has been considered as a single construct; however, this study has identified at least two underlying domains.
Only the first domain ‘participation in basic activities’ showed sufficient internal consistency and reliability. The construct validity and responsiveness of this domain require further testing, but without a clear definition of the concept participation this remains a challenge.
The results suggest that the KAP should embody a formative model (ie, the items together make up the construct) rather than a reflective model (ie, each item being an indicator of the underlying construct).
Strengths and limitations of this study
A structured approach was taken to examine all relevant measurement properties of the KAP.
The findings of this study highlight key issues for measuring social participation in older adults and contribute to this field of research.
Despite this extensive approach to examining the measurement properties of the KAP in this article, the construct validity and responsiveness still require further testing.
Introduction
Identifying and preventing the disabling effects of highly prevalent diseases in older adults, such as joint pain, is a major health priority for clinicians.1 The WHO proposes the International Classification of Functioning, Disability and Health (ICF) to classify disability into biological (ie, impairments), individual (ie, activity limitation) and societal (ie, participation restriction) levels.2 Of the different levels of disability, participation has been considered least in research studies. Measuring participation (or restriction in participation) offers the potential to capture the impact of health conditions in the context in which people live. This goes beyond measuring the individual's capacity to fulfil basic tasks (ie, activity limitations), such as walking or gripping objects, and includes interaction between an individual's capabilities and his environment and needs. Participation allows fulfilment of valued life activities, aspects of identity and social roles (eg, being a worker, carer or community member),2–5 which are indicated as important by older adults.4 Furthermore, maintaining participation is linked with lower levels of morbidity and mortality,6 7 a key component of healthy ageing and well-being and therefore increasingly included as a target for intervention.1 8 Significantly, participation can be maintained in older adults despite the presence of impairments and physical limitations,9 which provides other opportunities for optimising healthcare.
In a large cohort study in the Netherlands, we wanted to investigate the impact of joint pain and comorbidity on social participation, as joint pain and other chronic diseases often co-occur in older populations and the combination of diseases can increase levels of disability.10 There are instruments available that measure participation in accordance with the definition proposed by the ICF model.11 12 Four Dutch questionnaires have been designed to capture participation: the Impact on Participation and Autonomy (IPA),13 the Utrecht Scale for Evaluation of Rehabilitation-Participation,14 15 the Participation Scale16 and the Maastricht Social Participation Profile.17 However, these questionnaires were not suitable for our study because they were developed for specific populations, a different (rehabilitation) setting, were not to be self-administrated and/or too burdensome because of an extensive number of items. The same held for several commonly used instruments developed in English that is, the Participation Objective, Participation Subjective,18 the Rating of Perceived Participation19 and the Social Role Participation Questionnaire.20 In contrast, the Keele Assessment of Participation (KAP) was suitable for our study; it is brief (contains 11 items), designed to be self-administered and there is some evidence of sufficient measurement properties to support its potential application in epidemiological studies in older populations.21 However, it has not been tested in a Dutch older population and evidence is lacking for its dimensionality and responsiveness. Therefore, the aim of this study was to translate the KAP into Dutch and examine the measurement properties of the Dutch version of the KAP in older adults with joint pain and comorbidity.
Methods
Development of the Dutch version of the KAP
The KAP is a short self-report questionnaire designed to measure person-perceived participation restriction in 11 aspects of life.21 The conceptual model incorporates the influence of environmental factors (eg, use of devices or help from other people) and personal factors on participation. The items are phrased to capture performance (“I have”), individual judgement (“I wanted”) and the nature and timeliness of participation (“as and when I have wanted”). Responses are on a five-point ordinal scale (all, most, some, little, none of the time). To date, studies calculated a total score by dichotomising the categories into restricted (some, little, none) and not restricted (all, most) and simply counting the numbers of restrictions on the 11 items.22
Procedure of translation and adaptation
First, two persons (bilingual speakers with Dutch as first language; one with a medical background and the other without) independently translated the KAP into Dutch followed by a consensus meeting. Second, two other persons (bilingual speakers with English as first language, both unfamiliar with the KAP; one with some medical background and the other without), independently back-translated the first draft into English. Third, another consensus meeting, which consisted of the translators and researchers, resulted in revisions and a prefinal draft. We also contacted the developers of the original questionnaire for feedback on the translation.
Some amendments were made. First, we calculated a total score as the sum of individual ordinal item scores (0=all to 4=none of the time), to assess its use as continuous score in longitudinal studies. Second, in the original KAP, filter questions are included in four items, that is, looking after dependents, work, education and social activities. The filter questions first ask whether responders choose to participate in these activities (yes/no).21 If yes, they are asked to complete the relevant participation item (all, most, some, little, none of the time). If no, they are scored as not restricted. To improve the classification of participation restriction, we decided to add an extra question to the work, education and social activity items, asking why participants chose not to participate (not applicable, not able to, not willing to, other reason). Participants answering ‘not able to’ were considered to be restricted (score 4). If participants answered ‘other’, the reason was judged by the researcher and classified as (not) restricted depending on the answer. The categories ‘not applicable’ and ‘not willing to’ were scored as not restricted (score 0).
Face validity
The prefinal version of the Dutch KAP was tested for face validity in patients with foot complaints (n=10). Most patients skipped the introduction, which provides important instructions in line with the conceptual model. Therefore, we added additional instructions to the items self-care, looking after the home, belongings, dependants and also managing money. For example: “During the past four weeks, I managed my self-care or someone else on my behalf managed my self-care, as and when I have wanted.”
Measurement properties
The measurement properties of the KAP were tested using data from a prospective cohort study of Dutch older adults with joint pain and comorbidity.10 For the cross-cultural validity, additional data from the North Staffordshire Osteoarthritis Project (NorStOP) were used.23 Figure 1 provides an overview of the samples and tested measurement properties.
Figure 1.

Overview of the measurement properties and used samples.
Study participants
The baseline sample (T0) of the Dutch cohort consisted of 407 participants aged 65 years and over with self-reported joint pain on most days in the past month; pain in the neck, back, shoulder, elbow, hand, hip, knee and/or foot and comorbidity (≥2 chronic diseases apart from joint pain, ascertained from the electronic medical files of general practices).10 Follow-up data collected at 6 months (T1; n=364) were used to examine responsiveness and additional data (T1t; n=122) were collected 2 weeks after T1 to examine reliability.24 To test the cross-cultural validity, we used NorStOP data. NorStOP is a well-established population-based cohort study of the long-term prognosis of musculoskeletal pain in older people.23 The individuals in the sampling frame were registered with six general practices in North Staffordshire, UK which allowed survey data to be linked to medical record data. Joint pain was identified through self-reported joint pain in at least one of the eight joint pain sites, matching the method in the Dutch study. Comorbidity was identified using medical record data; primary care practitioners used the Read system to code all morbidity encounters in actual consultations. Morbidity data (ie, symptoms and diseases) in this system are grouped under 19 main Read chapters,25 which is comparable to the Dutch list of the 20 most relevant chronic diseases.10 We used the 3-year follow-up data of the NorStOP, as this data matched better to the Dutch sample, compared with the NorStOP baseline data. Using this information, we identified n=1785 older adults aged 65 and over, with joint pain and comorbidity (at least two chronic diseases). A local Medical Ethics Committee approved both studies and participants have given written informed consent.
Analyses
Descriptive statistics were used to describe the baseline characteristics.
Structural validity
Exploratory factor analysis (EFA) was performed in M-plus 6.12, to examine the factor structure of the 11-item KAP, using oblique GEOMIN rotation. To evaluate model fits, one absolute close-fit indexes, that is, root mean squared error of approximation (RMSEA) and two incremental close-fit indexes, that is, comparative fit index (CFI) and Tucker-Lewis index (TLI) were used, according to Hu and Bentler.26 The following cut-off points were considered as indicative of an adequate model fit: RMSEA <0.06, CFI and TLI >0.95.26 Items with factor loadings <0.5 were considered as not important to the domain.27 As EFA revealed two relevant KAP domains, further testing of the measurement properties of the KAP was performed separately for both KAP domains (KAPd1 and KAPd2).
Internal consistency
Cronbach's α were calculated per domain and considered to be adequate when between 0.70 and 0.95.24
Reliability
To examine test–retest reliability, we calculated the intraclass correlation coefficients (ICCs) for the KAP domains, based on a two-way random effects model. The ICCs were valuated as good when above 0.70.27 Furthermore, we quantified the measurement error using the Bland and Altman method. A paired t-test provided the mean change (meanchange) in score between the two time points and the SD of this change (SDchange). Then, the 95% limits of agreement were calculated: meanchange ±1.96×SDchange. Also, the SE of measurement, type agreement (SEMagreement) was calculated, to check how far apart the scores of the two measurements were.28 Finally, we calculated the smallest detectable change (SDC) as 1.96×√2×SEM,28 which is the smallest change that can be considered a ‘real’ change, beyond measurement error.
Construct validity
Spearman correlations were calculated between the KAP domain scores and other similar and dissimilar questionnaire scores. Similar questionnaires were the IPA (five domains)29 and the domains Role-Physical and Role-Emotional of the RAND-36 Item Health Survey (RAND-36) that all intend to measure participation.11 Dissimilar questionnaires were the domain Physical Functioning of the RAND-36,30 the KATZ index of Independence in Activities of Daily Living index (ADL)31 and the Lawton Instrumental Activities of Daily Living index (IADL)31 that intend to measure related constructs (activity limitations), but not participation. Hypotheses were formulated based on three general assumptions. First, correlations between KAP domains and similar questionnaires should be >0.50. Second, correlations between KAP domains and dissimilar questionnaires should be lower (ie, 0.30–0.50). Third, as KAPd1 and KAPd2 are supposed to measure different aspects of participation, correlations including the KAPd1 and KAPd2 should differ by a minimum of 0.10. Based on these assumptions, we formulated the following hypotheses: (i–xiv) correlations between each KAP domain and the five IPA domains and the Role-Physical and Role-Emotional domains of the RAND-36 should be >0.50; (xv–xx) correlations between each KAP domain and ADL, IADL and the domain Physical Functioning of the RAND-36 should be between 0.30 and 0.50; (xxi-xxvi) KAPd1 should show higher correlations with ADL, IADL, the IPA domains ‘autonomy indoors’, ‘family role’ and ‘social life and relationships’ and the domain Physical Functioning of the RAND-36, compared with KAPd2 (≥0.10 difference); and (xxvii–xxx) KAPd2 should show higher correlations with the IPA domains ‘autonomy outdoors’ and ‘work and education’ and the domains Role-Physical and Role-Emotional of the RAND-36, compared with KAPd1 (≥0.10 difference). Construct validity was considered high when 75% of the formulated hypotheses are in agreement, moderate when 50–75% are in agreement and low when less then 50% are in agreement with the results.32
Floor and ceiling effect
Floor and ceiling effects were assessed and considered present when more than 15% of the sample reported the worst or best possible score for each KAP domain.32
Responsiveness
On the basis of the results of the measurement properties of KAPd2 (presented below), we decided to exclude this domain from further analysis. So only for KAPd1, we tested the same hypotheses as used for the construct validity, but now focused on the change scores between baseline and follow-up after 6 months. Since we had no baseline data on IPA domain scores, these hypotheses were omitted from responsiveness testing. Again, at least 75% of the hypotheses should be in agreement with the results.32 To have an external criterion to evaluate changes over time, we included a Global Rating Scale (GRS), which asked participants to score their change in participation in the past 6 months on a five-point scale (much better, better, stable, worse or much worse). The mean change score for KAPd1 was calculated for those who remained stable or deteriorated (primary focus of the cohort is on deterioration in participation). The receiver operating characteristic curve was plotted and the area under the curve (AUC) was calculated to test the ability of the KAPd1 to discriminate between stable and deteriorated participants according to the external criterion (GRS). The AUC was considered acceptable if >0.70.27 Except for the factor analysis, all above statistical analyses were performed in IBM SPSS, V.20.
Cross-cultural validity
For optimal comparison, gender and age matched complete data (n=404) were randomly selected from the larger UK cohort (n=1785), to test the cross-cultural validity. The R-software package lordif was used to assess Differential Item Functioning (DIF) with Ordinal Logistic Regression (OLR).33 This approach incorporates Item Response Theory (IRT) derived trait scores (level of participation restriction), rather than the observed KAP domain score (as in usual OLR), as the estimator of the ability to score an item. It uses iterative cycles of DIF detection and trait score estimation, in which trait scores are purified during the analysis, that is, items with DIF are excluded one by one from the trait score and analyses are reiterated, to correct for pseudo DIF (item does not really contain DIF) or concealed DIF (hidden DIF in an item). In our study, the dependent variable was the item response (0–4) and the independent variable was the IRT derived trait score, that is, level of participation (restriction) on KAPd1. Then, DIF was detected by comparing three OLR models. In a base model (model 1), only the trait score was used to predict the item response. In a second model (model 2), both trait score and country (the Netherland (NL) vs UK) predicted the item response (DIF). In a third model (model 3), an interaction term was included between the trait score and country. This model tested whether DIF had either consistent impact across levels of participation (uniform DIF) or DIF that varied by levels of participation (non-uniform DIF). If the difference between models 1 and 3 showed an R2 difference >0.02, then the item was considered to show DIF.33 If the difference between models 2 and 3 showed an R2 difference >0.02, then the item was considered to show non-uniform DIF. We produced the item characteristic curve of the DIF items for both countries to examine the direction of the difference. Finally, we plotted the test characteristic curve (TCC) to provide insight into the actual impact of DIF items on the total score.
Results
The baseline characteristics of the Dutch and UK samples are presented in table 1. In the Dutch sample, there was no non-response at baseline, because we visited all participants at home and were able to check the questionnaires. During the 6 months follow-up period, 37 participants dropped out (9.1%), because of physical/mental deterioration (40.5%), death (2.7%), motivational problems (43.2%) or other reasons (13.5%). The baseline characteristics were not significantly different between the baseline sample (n=407) and the follow-up sample (n=364). The same was the case for the test–retest sample (n=122; table 1).
Table 1.
Characteristics of the Dutch samples and UK sample
| T0 Dutch baseline sample | T1 Dutch 6 month follow-up sample | T1t Dutch test-retest sample | UK sample† | |
|---|---|---|---|---|
| N=407 | N=364 | N=122 | N=404 | |
| Age, mean (SD) | 76.8 (6.7) | 76.5 (6.2) | 77.3 (6.4) | 76.8 (6.1) |
| Gender, female, n (%) | 254 (62.4) | 227 (62.4) | 77 (63.1) | 251 (62.1) |
| Marital status, married/together, n (%) | 236 (58.7) | 214 (59.4) | 69 (56.6) | 195 (49.2)* |
| Number of chronic diseases, mean (SD) | 2.7 (1.0) | 2.7 (1.0) | 2.8 (0.9) | 6.6 (2.4)* |
| Number of joint pain sites, mean (SD) | 3.5 (2.0) | 3.4 (1.9) | 3.4 (2.1) | 4.4 (2.1)* |
| Physical functioning, mean (SD) | 48.7 (25.8) | 49.3 (26.1) | 50.3 (26.6) | 34.8 (26.4)* |
| Anxiety, mean (SD) | 5.1 (3.6) | 20 (5.5) | 8 (6.6) | 6.7 (4.3)* |
| Depression, mean (SD) | 5.4 (3.5) | 19 (5.2) | 5 (4.1) | 6.0 (3.8)* |
*p<0.05; differences of baseline characteristics between T0 and T1, T0 and T1t and Dutch sample T0 and UK sample.
†Only participants with complete KAP data were included; sample is matched based on age and gender.
KAP, Keele Assessment of Participation.
Structural validity
EFA identified two underlying domains in the 11 KAP items. A two-factor model showed substantially better model fits (CFI 0.977, TLI 0.963, RMSEA 0.054), compared with a one-factor model (CFI 0.902, TLI 0.878, RMSEA 0.098). Items 1, 2, 3, 4, 5 and 7 had high factor loadings on KAPd1, which we labelled ‘participation in basic activities’. Items 9, 10 and 11 had high factor loadings on KAPd2, which we labelled ‘participation in complex activities’ (table 2). Items 6 and 8 had low factor loadings on both domains and were excluded from further analyses.
Table 2.
Results of exploratory factor analysis in the 11-item Keele Assessment of Participation, performed in the Dutch baseline sample (n=407)
| Domain 1 (KAPd1) | Domain 2 (KAPd2) | |
|---|---|---|
| Participation in basic activities | Participation in complex activities | |
| Item 1 mobility indoors | 0.739 | 0.408 |
| Item 2 mobility outdoors | 0.734 | 0.458 |
| Item 3 self-care | 0.765 | 0.266 |
| Item 4 looking after the home | 0.798 | 0.164 |
| Item 5 looking after belongings | 0.830 | 0.190 |
| Item 6 looking after dependents | 0.238 | 0.106 |
| Item 7 interpersonal relations | 0.601 | 0.492 |
| Item 8 economic life | 0.376 | 0.031 |
| Item 9 work | 0.221 | 0.744 |
| Item 10 education | 0.162 | 0.757 |
| Item 11 social life | 0.255 | 0.534 |
Bold indicates factor loading >0.50.
Internal consistency
Cronbach's α for KAPd1 ‘participation in basic activities’ and KAPd2 ‘participation in complex activities’ were 0.74 and 0.57, respectively.
Reliability
Within a time period of 2 weeks, the mean scores on KAPd1 indicated some deterioration, whereas the scores on KAPd2 suggested a small improvement in participation. The KAP domains showed a ICCagreement of 0.63 (95% CI 0.49 to 0.73), limits of agreement from –4.09 to 5.59, a SEM of 1.75 and SDC of 4.8 for KAPd1 (scale score of 0–24) and a ICCagreement of 0.57 (95% CI 0.44 to 0.68), limits of agreement from –5.75 to 5.40, a SEM of 2.02 and SDC of 5.6 for KAPd2 (scale score of 0–12).
Construct validity
The correlations between the two KAP domains and the three RAND-36 domains, five IPA domains and (I)ADL index are presented in table 3. In total, 43% of the hypotheses were confirmed. The highest correlation was found between KAPd1 and IPA domain ‘autonomy outdoors’ (0.63).
Table 3.
Construct validity and responsiveness of the Dutch Keele Assessment of Participation, based on prior hypotheses about expected correlations; Spearman correlation coefficients between (change) scores of the KAP domains and IPA domains, RAND-36 domains (RP, RE and PF) and (instrumental) activities of daily living index
| KAPd1 | KAPd2 | KAPd1 change | |||
|---|---|---|---|---|---|
| S | IPA autonomy indoors | 0.47 | 0.37 | – | |
| S | IPA autonomy outdoors | 0.63 | 0.50 | – | |
| S | IPA family role | 0.53 | 0.45 | – | |
| S | IPA social life and relationships | 0.41 | 0.32 | – | |
| S | IPA work and education | 0.21 | 0.35 | – | |
| S | RAND-36 role-physical | 0.50 | 0.36 | RAND-36 role-physical change | 0.12 |
| S | RAND-36 role-emotional | 0.39 | 0.32 | RAND-36 role-emotional change | 0.12 |
| D | RAND-36 physical functioning | 0.50 | 0.39 | RAND-36 physical functioning change | 0.13 |
| D | Activities of daily living (0–6) | 0.36 | 0.25 | Activities of daily living (0–6) change | 0.12 |
| D | Instrumental activities of daily living (0–7) | 0.51 | 0.35 | Instrumental activities of daily living (0–7) change | 0.14 |
Hypotheses: (1) similar constructs correlate >0.50; confirmation=bold, (2) dissimilar constructs correlate with 0.30–0.50; confirmation=bold (3) difference between KAP domains 0.10.
Bold indicates confirmation of hypotheses 1 and 2. Underlined indicates confirmation of hypotheses 3.
D, dissimilar constructs of participation; IPA, Impact on Participation and Autonomy; KAP, Keele Assessment of Participation; S, similar constructs of participation.
Floor and ceiling effect
Both KAP domains showed ceiling effects: the best possible score was obtained by 28% and 33% of the participants on KAPd1 and KAPd2, respectively. There were no floor effects (indicating worse possible score) present.
Responsiveness
The results were not in agreement with the hypotheses (table 3, right column). Based on the scores on the GRS of perceived change in participation after 6 months (n=363), 274 participants remained stable (75%) and 58 participants reported deterioration in participation (worse/much worse) (16%). The results indicate that the deteriorated group also had higher mean change scores on KAPd1: mean change score 1.41 (SD 4.25). The AUC for discrimination between stable and deteriorated participants was 0.62 (95% CI 0.53 to 0.72).
Cross-cultural validity
In the Dutch sample, there were only three participants with incomplete KAP data at baseline. However, the UK sample had incomplete data in 124 participants (6.9%). Compared with the group with complete UK data (n=1661), the group with incomplete data (n=124) was significantly younger and more likely to live alone, but were no different for gender, number of chronic diseases, number of joint pain sites and level of physical functioning (data not shown). For optimal comparison, we matched the Dutch and UK sample based on age (four categories) and gender, which provided a final sample of 404 Dutch and 404 UK participants. The proportion of women was 62%. The proportion of participants in the four age categories was as follow: 15.6% between 65 and 70 years, 25.5% between 70 and 75 years, 26.5% between 75 and 80 years and 32.4% ≥80 years. The distribution of the trait scores of both countries showed that, in general, the Dutch participants scored better on KAPd1 (less restrictions), compared with the UK participants. The lordif method detected one item with DIF, that is, item 7 ‘interpersonal relations’. The R2 difference between models 1 and 3 was 0.0381, which indicated overall DIF. As the R2 difference between models 2 and 3 was 0.0001, item 7 showed no non-uniform DIF, which indicated only the presence of uniform DIF (figure 2). The item characteristic curve showed that the Dutch participants scored easier on this item, thus higher values, especially between the categories 0–1 and 1–2 (figure 2). This indicates that the Dutch participants had a higher chance to score restrictions on this item, given a similar trait level. Although item 7 showed uniform DIF, this DIF only had limited impact on the total domain score. Figure 3 displays the TCC and indicates no substantial impact of DIF in item 7 on the total domain score, because of the similar slopes and overlap in scorings between the two samples.
Figure 2.
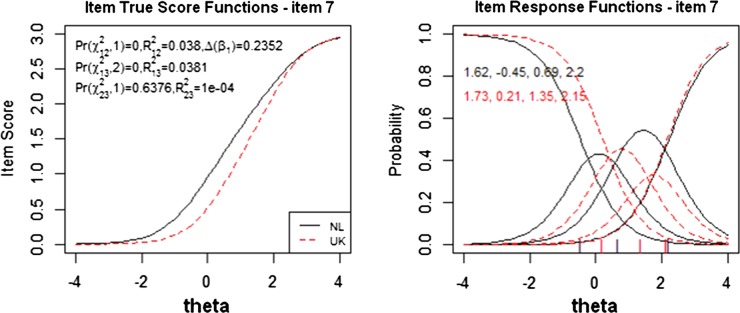
The left plot is a true score (Item Response Theory score) of the Dutch and UK sample on differential item functioning (DIF) item 7 interpersonal interaction. The right plot shows the item characteristic curves for item 7. The curves show the probability of endorsing a particular item response (0=all, 1=most, 2=some, 3–4=little or none of the time) as a function of the DIF-free scale score and country.
Figure 3.
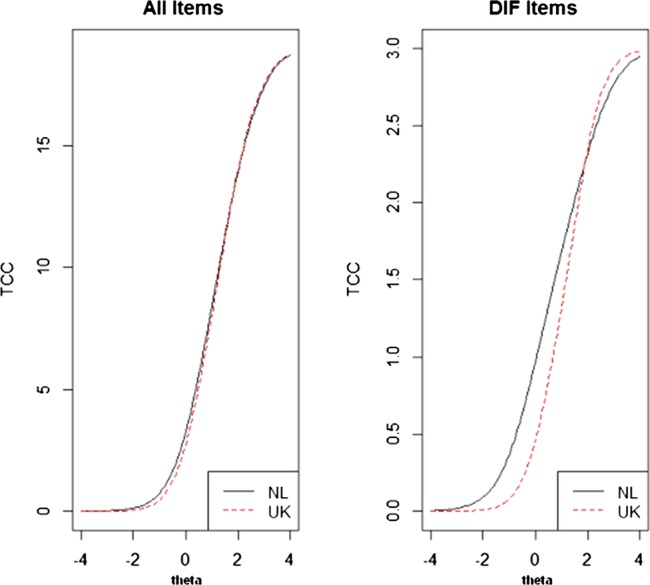
The left plot displays the test characteristic curve (TCC) of all items and the right plot displays the TCC of only differential item functioning (DIF) item (in this case only item 7 interpersonal interaction). These plots illustrate the impact of DIF items on the total domain score.
Discussion
In this study, we explored the measurement properties of the Dutch version of the KAP in a sample of older adults with joint pain and comorbidity. We found evidence for two underlying constructs in the 11-item KAP questionnaire, that is, KAPd1 ‘participation in basic activities’ (based on six items) and KAPd2 ‘participation in complex activities’ (based on three items). KAPd1 showed good internal consistency and sufficient reliability. However, the construct validity of this domain was less than expected and suggests that further research is required to better understand what the domain actually measures. To make accurate recommendations about its use in longitudinal studies, KAPd1 also needs more testing on responsiveness, because of some limitations in our study sample (see below). Overall, KAPd1 seemed comparable between the Dutch and UK sample. KAPd2 lacks sufficient measurement properties for further use. Each item not included in KAPd1 should be considered as a distinct form of participation.
Although previous studies have treated the KAP as a unidimensional construct, the current study revealed two underlying constructs in the 11-item KAP. The first domain is considered as measuring ‘participation in basic activities’, as it includes mobility inside/outside the home, self-care, looking after the home/belongings and interpersonal relations. These are activities that take place on a more personal level, within someone's own environment. In contrast, the second domain is interpreted as corresponding to ‘participation in complex activities’, as these activities have a more complex nature, can involve greater interaction with contextual (environmental and personal) factors and so link more with one's ability to participate in the community.
For our prospective cohort study, we wanted to measure participation in line with the construct proposed in the ICF. This construct is slightly ambiguous and lacks the clarity required to facilitate the development of instruments that can be considered to measure the construct participation. As a result, there are several instruments which intend to measure participation but have used different operationalisations, resulting in dissimilar items and different qualifiers, such as capacity, participation accomplishment, participation problems and satisfaction with participation.11 While all KAP items measure person-perceived performance (satisfaction with participation), only 33% of the IPA items measure satisfaction with participation.11 The Role-Physical and Role-Emotional domains of the RAND-36 also measured various aspects of participation.11 This presents a challenge when examining construct validity, as no two instruments are completely identical. This diversity may explain to some extent why the construct validity in this study was poorer than expected. It also hampers an assessment of content validity of participation instruments. Without a clear definition of participation it is hard to evaluate whether the KAP items comprehensively measure the construct of participation. Further conceptual development of the construct ‘participation’ may help the development and validation of instruments to measure participation.
Our results provided evidence for two domains within the 11-item KAP questionnaire, with adequate internal consistency for KAPd1, but not for KAPd2. This suggests that there may be more constructs of participation captured within the three items of KAPd2 and that a number of participation areas may contribute to a more general paradigm. Based on this, high correlations between items may not be possible and explains why the consistency for KAPd2 was low. It is questionable whether participation in work, social activities and education address similar areas of participation; participation will involve different individual capabilities and environmental factors. Previous psychometric work suggests that these items can be used to measure individual domains of participation at single time points.21 One may even question whether ‘participation’ can be considered a real construct in the strict psychometric sense. Maybe the items better reflect a formative model, that is, the items together make up the construct, rather than a reflective model, that is, each item being an indicator of the underlying construct.34
The level of responsiveness of both KAP domains was low, which raises questions about its application in longitudinal studies. Earlier studies cited ceiling effects in other participation instruments35 and clarified that the poor responsiveness was due to the small proportion of participants who actually changed in level of participation over time. Even in the presence of poor health and activity limitations, participation can still be unaffected because of other ways of compensating.9 Therefore, greater knowledge about the natural history and course of participation would aid the assessment of responsiveness. In our sample, almost 75% showed no change in participation on the anchor question for change in participation. The interval period was short (6 months) and a longer period may be necessary to find significant changes.
DIF analysis revealed DIF in only item 7 ‘interpersonal relations’. This means that, assuming similar levels of participation, the Dutch sample scored worse on interpersonal relations, compared with the UK sample. We can speculate about possible explanations for this DIF. Despite the similar selection criteria applied within the two studies (based on age, joint pain and chronic diseases) the UK participants were more often men, younger and scored worse on various physical outcomes, such as number of chronic conditions, physical functioning, anxiety and depression. We tried to minimise the most important differences, by matching the samples on age and gender. The higher level of multimorbidity in the UK sample was most probably due to different registration systems in the general practices between the two countries. Whereas the Dutch study selected participants from the electronic medical files of general practices based on International Classification of Primary Care codes that present only chronic diseases, the NorStOP study selected participants based on Read codes, which contain not only chronic conditions, but also more symptomatic complaints. While the UK participants had more diseases, these diseases were most likely not all chronic. We indicate that this normalised some of the differences in multimorbidity between the two samples. Unfortunately, we were not able to correct for other physical differences. Probably, more interesting is the diversity in research areas between the two studies. Many studies showed the devastating effects of poor health, low socioeconomic status, losing a partner and living in urbanised areas on social isolation (loneliness), the scope of social networks and subsequently the level of interpersonal interaction.36 37 As the Dutch participants lived in more urbanised areas, this may provide a better explanation for the found DIF. Unfortunately, we were not able to disentangle other factors that could influence social interaction, such as size of social network, housing condition, financial status and population composition in the community.37 There is scope for further research around the cross-cultural differences in interpersonal relations (social integration) in specific, and levels of participation in general between the Netherland and UK.
In conclusion, the KAP domain ‘participation in basic activities’ showed good internal consistency and sufficient reliability and was comparable between the Dutch and UK sample of older adults with joint pain and comorbidity. Further testing is needed on the construct validity and responsiveness, but without a clearer definition of the construct participation, this remains challenging. The KAPd2 domain lacks sufficient measurement properties for application in studies, although items may be used as single items.
Supplementary Material
Footnotes
Contributors: LAHH participated in study design, translation, data collection, data analysis, interpretation and manuscript preparation. CBT, SSL and RW participated in the study design, interpretation, manuscript preparations and discussed all versions of the manuscript. BvdZ participated in the translation, pilot study and was involved in the data analysis. HEvdH, JD, BvdZ and MS revised and approved two manuscript versions. All authors revised and approved the final version of the manuscript.
Funding: Netherlands Organisation for Health Research and Development ZonMw; grant number: 313080301; The NorStOP study was funded by the Medical Research Council and by the North Staffordshire Primary Care R&D Consortium.
Competing interests: None.
Patient consent: Obtained.
Ethics approval: A local Medical Ethics Committee approved both studies and participants have given written informed consent.
Provenance and peer review: Not commissioned; externally peer reviewed.
Data sharing statement: No additional data are available.
References
- 1.World Health Organization The burden of musculoskeletal conditions at the start of the new millennium; report of a WHO scientific group. Geneva: WHO, 2003 [PubMed] [Google Scholar]
- 2.World Health Organization International classification of functioning, disability and health. Geneva: WHO, 2001 [Google Scholar]
- 3.Dijkers MP. Issues in the conceptualization and measurement of participation: an overview. Arch Phys Med Rehab 2010;91:S5–16 [DOI] [PubMed] [Google Scholar]
- 4.Grime J, Richardson JC, Ong BN. Perceptions of joint pain and feeling well in older people who reported being healthy: a qualitative study. Br J Gen Pract 2010;60:597–603 [DOI] [PMC free article] [PubMed] [Google Scholar]
- 5.Resnik L, Plow MA. Measuring participation as defined by the international classification of functioning, disability and health: an evaluation of existing measures. Arch Phys Med Rehabil 2009;90:856–66 [DOI] [PubMed] [Google Scholar]
- 6.Holmes WR, Joseph J. Social participation and healthy ageing: a neglected, significant protective factor for chronic non communicable conditions. Global Health 2011;7:43. [DOI] [PMC free article] [PubMed] [Google Scholar]
- 7.Dale C, Prieto-Merino D, Kuper H, et al. Modelling the association of disability according to the WHO International Classification of Functioning, Disability and Health ICF with mortality in the British Women's Heart and Health Study. J Epidemiol Community Health 2012;66:170–5 [DOI] [PubMed] [Google Scholar]
- 8.Davis AM, Palaganas MP, Badley EM, et al. Measuring participation in people with spondyloarthritis using the social role participation questionnaire. Ann Rheum Dis 2011;7010:1765–9 [DOI] [PubMed] [Google Scholar]
- 9.Wilkie R, Thomas E, Mottram S, et al. Onset and persistence of person-perceived participation restriction in older adults: a 3-year follow-up study in the general population. Health Qual Life Outcomes 2008;6:92. [DOI] [PMC free article] [PubMed] [Google Scholar]
- 10.Hermsen LA, Leone SS, van der Windt DA, et al. Functional outcome in older adults with joint pain and comorbidity: design of a prospective cohort study. BMC Musculoskelet Disord 2011;12 [DOI] [PMC free article] [PubMed] [Google Scholar]
- 11.Eyssen IC, Steultjens MP, Dekker J, et al. A systematic review of instruments assessing participation: challenges in defining participation. Arch Phys Med Rehabil 2011;92:983–97 [DOI] [PubMed] [Google Scholar]
- 12.Noonan VK, Kopec JA, Noreau L, et al. A review of participation instruments based on the international classification of functioning, disability and health. Disabil Rehabil 2009;31:1883–901 [DOI] [PubMed] [Google Scholar]
- 13.Cardol M, de Haan RJ, van den Bos GAM, et al. The development of a handicap assessment questionnaire: the Impact on Participation and Autonomy IPA. Clin Rehabil 1999;13:411–19 [DOI] [PubMed] [Google Scholar]
- 14.van der Zee CH, Post WMW, Kap A, et al. Measurement of participation as an outcome of outpatient rehabilitation: a prospective multi-centre study. Revalidata 2008;146:10–14 in Dutch [Google Scholar]
- 15.van der Zee CH, Priesterbach AR, van der Dussen L, et al. Reproducibility of three self-report participation measures: the ICF measure of participation and activities screener, the participation scale, and the Utrecht scale for evaluation of rehabilitation-participation. J Rehabil Med 2010;42:752–7 [DOI] [PubMed] [Google Scholar]
- 16.van Brakel WH, Anderson AM, Mutatkar RK, et al. The participation scale: measuring a key concept in public health. Disabil Rehabil 2006;28:193–203 [DOI] [PubMed] [Google Scholar]
- 17.Mars GM, Kempen GI, Post MW, et al. The Maastricht social participation profile: development and clinimetric properties in older adults with a chronic physical illness. Qual Life Res 2009;18:1207–18 [DOI] [PubMed] [Google Scholar]
- 18.Brown M, Dijkers MPJM, Gordor WA, et al. Participation objective, participation subjective—a measure of participation combining outsider and insider perspectives. J Head Trauma Rehabil 2004;19:459–81 [DOI] [PubMed] [Google Scholar]
- 19.Sandstrom M, Lundin-Olsson L. Development and evaluation of a new questionnaire for rating perceived participation. Clin Rehabil 2007;21:833–45 [DOI] [PubMed] [Google Scholar]
- 20.Gignac MAM, Backman CL, Davis AM, et al. Understanding social role participation: what matters to people with arthritis? J Rheumatol 2008;35:1655–63 [PubMed] [Google Scholar]
- 21.Wilkie R, Peat G, Thomas E, et al. The Keele Assessment of Participation: a new instrument to measure participation restriction in population studies. Combined qualitative and quantitative examination of its psychometric properties. Qual Life Res 2005;14:1889–99 [DOI] [PubMed] [Google Scholar]
- 22.Wilkie R, Peat G, Thomas E, et al. The prevalence of person-perceived participation restriction in community-dwelling older adults. Qual Life Res 2006;15:1471–9 [DOI] [PubMed] [Google Scholar]
- 23.Thomas E, Wilkie R, Peat G, et al. The North Staffordshire Osteoarthritis Project-NorStOP: prospective, 3-year study of the epidemiology and management of clinical osteoarthritis in a general population of older adults. BMC Musculoskelet Disord 2004;5 [DOI] [PMC free article] [PubMed] [Google Scholar]
- 24.Streiner DL, Norman GR. Health measurement scales; a practical guide to their development and use. 3rd edn Oxford, NY: Oxford University Press, 2004 [Google Scholar]
- 25.Kadam UT, Croft PR. Clinical multimorbidity and physical function in older adults: a record and health status linkage study in general practice. Fam Pract 2007;24:412–19 [DOI] [PubMed] [Google Scholar]
- 26.Hu LT, Bentler PM. Cutoff criteria for fit indexes in covariance structure analysis: conventional criteria versus new alternatives. Struct Equ Model 1999;6:1–55 [Google Scholar]
- 27.de Vet HCW, Terwee CB, Mokkink LB, et al. Measurement in medicine; a practical guide. Cambridge: Cambridge University Press, 2011 [Google Scholar]
- 28.de Vet HC, Terwee CB, Knol DL, et al. When to use agreement versus reliability measures. J Clin Epidemiol 2006;59:1033–9 [DOI] [PubMed] [Google Scholar]
- 29.Cardol M, de Haan RJ, van den Bos GAM, et al. The development of a handicap assessment questionnaire: the impact on participation and autonomy IPA. Clin Rehabil 1999;13:411–19 [DOI] [PubMed] [Google Scholar]
- 30.van der Zee KI, Sanderman R, Heyink J, et al. Psychometric qualities of the RAND 36-item Health Survey 1.0: a multidimensional measure of general health status. Int J Behav Med 1996;3:104–22 [DOI] [PubMed] [Google Scholar]
- 31.Katz S. Assessing self-maintenance—activities of daily living, mobility, and instrumental activities of daily living. J Am Geriatr Soc 1983;31:721–7 [DOI] [PubMed] [Google Scholar]
- 32.Terwee CB, Bot SD, de Boer MR, et al. Quality criteria were proposed for measurement properties of health status questionnaires. J Clin Epidemiol 2007;60:34–42 [DOI] [PubMed] [Google Scholar]
- 33.Choi SW, Gibbons LE, Crane PK. Lordif: an R package for detecting differential item functioning using iterative hybrid ordinal logistic regression/item response theory and Monte Carlo simulations. J Stat Softw 2011;39:1–30 [DOI] [PMC free article] [PubMed] [Google Scholar]
- 34.Fayers PM, Hand DJ. Factor analysis, causal indicators and quality of life. Qual Life Res 1997;6:139–50 [DOI] [PubMed] [Google Scholar]
- 35.Noonan VK, Kopec JA, Noreau L, et al. Comparing the content of participation instruments using the International Classification of Functioning, Disability and Health. Health Qual Life Outcomes 2009;7:93. [DOI] [PMC free article] [PubMed] [Google Scholar]
- 36.de Jong Gierveld J, Tesch-Romer C. Loneliness in old age in Eastern and Western European societies: theoretical perspectives. Eur J Ageing 2012;9:285–95 [DOI] [PMC free article] [PubMed] [Google Scholar]
- 37.Scharf T, de Jong Gierveld J. Loneliness in urban neighbourhoods: an Anglo-Dutch comparison. Eur J Ageing 2008;5:103–15 [DOI] [PMC free article] [PubMed] [Google Scholar]
Associated Data
This section collects any data citations, data availability statements, or supplementary materials included in this article.