

Abstract
Objectives
To quantify and describe the mechanism of road traffic injury (RTI) deaths in India.
Design
We conducted a nationally representative mortality survey where at least two physicians coded each non-medical field staff's verbal autopsy reports. RTI mechanism data were extracted from the narrative section of these reports.
Setting
1.1 million homes in India.
Participants
Over 122 000 deaths at all ages from 2001 to 2003.
Primary and secondary outcome measures
Age-specific and sex-specific mortality rates, place and timing of death, modes of transportation and injuries sustained.
Results
The 2299 RTI deaths in the survey correspond to an estimated 183 600 RTI deaths or about 2% of all deaths in 2005 nationally, of which 65% occurred in men between the ages 15 and 59 years. The age-adjusted mortality rate was greater in men than in women, in urban than in rural areas, and was notably higher than that estimated from the national police records. Pedestrians (68 000), motorcyclists (36 000) and other vulnerable road users (20 000) constituted 68% of RTI deaths (124 000) nationally. Among the study sample, the majority of all RTI deaths occurred at the scene of collision (1005/1733, 58%), within minutes of collision (883/1596, 55%), and/or involved a head injury (691/1124, 62%). Compared to non-pedestrian RTI deaths, about 55 000 (81%) of pedestrian deaths were associated with less education and living in poorer neighbourhoods.
Conclusions
In India, RTIs cause a substantial number of deaths, particularly among pedestrians and other vulnerable road users. Interventions to prevent collisions and reduce injuries might address over half of the RTI deaths. Improved prehospital transport and hospital trauma care might address just over a third of the RTI deaths.
Keywords: road traffic injury, verbal autopsy, India, low- and middle-income countries
Article summary.
Article focus
To directly estimate the age-specific and sex-specific mortality rates and describe the place and timing of death, modes of transportation and injuries sustained for road traffic injury (RTI) deaths in India using a nationally representative mortality survey of 1.1 million homes.
Key messages
Road traffic injuries cause a substantial number of avertable deaths, particularly in men of productive working age and among pedestrians and other vulnerable road users.
Preventive interventions should be emphasised as the majority of all RTI deaths occurred at the scene of collision, within minutes of collision, and/or involved a head injury.
Properly designed mortality survey with verbal autopsy narratives can provide much-needed data to assist RTI prevention efforts.
Strengths and limitations of this study
This study is the first nationally representative survey of the causes of death in India and overcomes limitations of existing data sources including regional injury surveys, hospital series and national police reports.
The study include potential misclassification of deaths by physician coders, the use of layperson narratives with a potential for recall bias and inaccuracies, and limited ability to forward project study results given the rapid changes in motorisation in India.
Introduction
Road traffic injuries (RTI) are a large and growing public health burden, especially in low-income and middle-income countries (LMICs) where 90% of the world's deaths due to RTI are estimated to occur.1 There are few high-quality epidemiological data on RTI to guide the development, implementation and surveillance of evidence-based policy and programmes in LMICs.2–4
The number of deaths due to RTI in India is projected to rise with increasing motorisation.1 5 Aside from a few regional injury surveys,6–11 the current data on the numbers and mechanisms of RTI deaths in India rely on police or hospital records, both of which can substantially underestimate death rates in the poor, rural and uneducated people who still constitute large proportions of the Indian population.2–4 12 13
The WHO, using indirect modelling methods, estimated about 202 000 RTI deaths in India in 2004.14 15 No study has validated this estimate with direct measurement or documented detailed RTI mechanism for India nationally. Here, we estimate the regional, age-specific and sex-specific mortality rates and risk of RTI death in India using data from the Million Death Study (MDS). We also report the modes of transportation, place and timing of death, and injuries sustained in RTI deaths.
Methods
Study design
MDS is an ongoing nationally representative survey designed to determine the causes and risk factors of death in India, organised by the Registrar General of India (RGI). The design, methodology and preliminary findings of MDS have been described elsewhere.16–19 In brief, MDS used an enhanced version of verbal autopsy (known as the routine, reliable, representative, resampled household investigation of mortality with medical evaluation or RHIME) to monitor a nationally representative sample of 1.1 million households in the sample registration system (SRS). Within six months of every death occurring in these households from 2001 to 2003, a trained, non-medical RGI surveyor interviewed a relative or close acquaintance of the deceased to obtain the symptoms and events around the death using structured questions and a local language narrative guided by a specific symptom list. These records were converted into electronic records and emailed to 2 of the 140 trained physicians who independently and anonymously assigned an underlying cause of death (with allocation determined randomly based only on the physician's ability to read the local language), using guidelines for the major causes of death.20 Records were assigned cause of death in three-digit International Statistical Classification of Diseases and Related Health Problems, 10th revision (ICD-10).21 Records where coders disagreed on the cause of death underwent anonymous reconciliation. Continuing disagreements were adjudicated by a third senior physician. Five per cent of households were randomly resurveyed and the results were consistent within families of ICD-10 codes.16 Participation in SRS is on a voluntary basis and oral consent was obtained under the confidentiality and consent procedures of the Registration of Births and Deaths Act, 1969.
Road traffic injury deaths
The RTI deaths in this study were of people who died between 2001 and 2003 with a final assigned ICD-10 code within V01–V89. We translated the open-ended narratives into English from 14 local languages, and systematically extracted the modes of transportation, place and timing of death and injuries sustained from 2157 of the 2299 RTI deaths using a standardised data extraction tool and procedure (the remaining 142 deaths, 6%, had missing or illegible narratives). For these four data elements, there was substantial inter-rater agreement between two investigators and two research assistants who were trained and who independently extracted data from the narratives of a random 10% of RTI deaths (the lowest κ statistic was greater than 0.69 for all pairwise comparisons between the four data extractors; data not shown). The two research assistants then independently extracted data from all narratives. Adjudication was performed by an investigator (MH) for discrepancies in extracted data.
Analysis
The age-specific and sex-specific proportion of RTI deaths within the 2001–2003 survey was applied to the 2005 United Nations (UN) estimates of the number of deaths from all causes in India, after weighting for sampling probability for each rural or urban stratum per state (although such weighting made little difference because the study was nationally representative).18 22 The 2005 UN death estimates were used so as to correct for the slight undercounts reported in the total death rates in SRS23 24 and to account for the 12% of enumerated deaths without completed field visits (mostly due to out-migration of the family or from incomplete field records). The proportion of these missed deaths was similarly dispersed across sex, age and states. Use of 2003 or 2004 UN death totals yielded nearly identical results (data not shown). The 99% CIs for mortality rate were calculated based on the weighted number of study deaths. State-specific and rural/urban-specific estimates of the number, mortality rate and lifetime risk of RTI death were calculated by partitioning the UN national death totals according to the relative SRS death rates as previously described.18 25 26 Urban and rural status was defined according to the Census of India. Logistic regression was used to compare the sociodemographic traits of pedestrian and non-pedestrian RTI deaths. Household fuel type was used as a measure of community wealth, based on earlier principal component analyses:18 high asset neighbourhoods had >50% of households that used gas, electricity or kerosene; low asset or poor neighbourhoods primarily used coal, firewood or other forms of energy. Attributable proportion was calculated for traits of pedestrian deaths compared to non-pedestrian RTI deaths.
Results
The 2299 RTI deaths in the 2001–2003 survey correspond to an estimated 183 600 (99% CI 173 800–193 400) RTI deaths in India in 2005. The majority of these RTI deaths occurred in men (152 100 deaths, 82.8%; table 1). The age-standardised RTI mortality rate for men (26.2/100 000, 24.6–27.7) was higher than for women (5.7/100 000, 5.0–6.4). While the RTI mortality rate increased with age in both genders, the largest number of RTI deaths occurred in men between 15 and 59 years of age (118 900, 64.8%).
Table 1.
Road traffic injury (RTI) deaths in the present study and estimated national totals for 2005, by age and gender
| Study deaths, 2001–2003 |
All India, 2005 |
|||||||
|---|---|---|---|---|---|---|---|---|
| Number of RTI deaths/all coded deaths | Proportion RTI (%)* | Rural (%†) | Two coders immediately agree | All deaths/population (millions, 2005 UN estimates) | Estimated RTI deaths‡, thousands | RTI death rate§ per 100 000 (99% CI) | Period risk for RTI death (%)¶ | |
| Male—age in years | ||||||||
| 0–4 | 44 11719 | 0.4 | 37 (76.7) | 44 | 1.2/67 | 4.9 | 7.4 (6.5–8.4)** | 0.04 |
| 5–14 | 97 1926 | 5.2 | 86 (84.1) | 87 | 0.2/129 | 8.5 | 6.6 (4.9–8.3) | 0.1 |
| 15–29 | 605 4727 | 13 | 462 (68.9) | 558 | 0.4/163 | 47.1 | 28.9 (25.9–31.9) | 0.4 |
| 30–44 | 529 6817 | 7.7 | 385 (67.0) | 477 | 0.6/115 | 43.8 | 37.9 (33.7–42.1) | 0.6 |
| 45–59 | 356 11731 | 3 | 249 (60.9) | 312 | 0.9/73 | 28.0 | 38.4 (33.2–43.6) | 0.6 |
| 60–69 | 149 12120 | 1.2 | 117 (71.8) | 133 | 0.9/24 | 10.6 | 44.0 (34.6–53.4) | 0.5 |
| >70 | 123 18732 | 0.6 | 106 (81.2) | 98 | 1.3/14 | 9.1 | 64.5 (49.1–80.0) | – |
| All ages (% or 99% CI) | 1903 67772 | 2.8 | 1442 (68.9) | 1709 (89.8%) | 5.3/585 | 152.1 (143.2–161.0) | 26.2 (24.6–27.7) | 2.1¶ (2.0–2.3) |
| Female—age in years | ||||||||
| 0–4 | 50 11492 | 0.4 | 46 (93.4) | 45 | 1.2/61 | 5.0 | 8.1 (7.1–9.1)** | 0.04 |
| 5–14 | 44 1955 | 2.3 | 38 (80.1) | 43 | 0.2/118 | 3.8 | 3.2 (2.0–4.4) | 0.03 |
| 15–29 | 72 4394 | 1.5 | 53 (60.5) | 63 | 0.3/150 | 5.3 | 3.5 (2.4–4.6) | 0.1 |
| 30–44 | 59 4055 | 1.4 | 39 (59.0) | 50 | 0.3/106 | 4.4 | 4.1 (2.7–5.5) | 0.1 |
| 45–59 | 70 6402 | 1.1 | 55 (70.9) | 61 | 0.5/69 | 6.0 | 8.6 (5.9–11.3) | 0.1 |
| 60–69 | 54 9016 | 0.6 | 42 (68.6) | 52 | 0.6/25 | 3.7 | 14.8 (9.8–19.9) | 0.2 |
| >70 | 47 17343 | 0.3 | 33 (61.8) | 35 | 1.3/16 | 3.5 | 21.6 (13.4–29.9) | – |
| All ages (% or 99% CI) | 396 54657 | 0.7 | 306 (69.8) | 349 (88.1%) | 4.5/546 | 31.5 (27.5–35.6) | 5.7 (5.0–6.4) | 0.5¶ (0.4–0.5) |
| Total male and female, <70 years (% or 99% CI) | 2129 86354 | 2.4 | 1609 (68.5) | 1925 (90.4%) | 7.2/1100 | 171.0 (161.5–180.4) | 15.5 (14.7–16.4) | 1.3¶ (1.3–1.4) |
| Total male and female, all ages (% or 99% CI) | 2299/122429 | 1.8 | 1748 (69.0) | 2058 (89.5%) | 9.8/1131 | 183.6 (173.8–193.4) | 16.2 (15.4–17.1) | 1.3¶ (1.3–1.4) |
*Proportion of RTI deaths compared to all deaths, weighted by state and residence (rural/urban).
†Percentage rural is weighted by state and residence (rural/urban).
‡Obtained by multiplying the United Nations estimated total deaths in 2005 by the weighted proportions.
§Age standardised to the 2005 United Nations estimated Indian population; 99% CIs shown are calculated based on the weighted number of study deaths, which result in a wider CI than those based on physician agreement.
¶Annual RTI death rate multiplied by the duration of age range, except for the lifetime risk which is calculated between 0–69 years by summation of the age-specific period risks.
**Crude death rate.
At these death rates and in the theoretical absence of other causes of death, men in India had a 2.1% (2.0–2.3) risk of dying from RTI before age 70, with the highest risks at ages 30–59 years; women had a 0.5% (0.4–0.5) risk of dying from RTI before age 70. Men in Haryana, Punjab, Tamil Nadu and Uttar Pradesh had a significantly higher risk (3.0–4.1%) than the national risk (figure 1). In contrast, men in Bihar, Jharkhand, Andhra Pradesh, Orissa, Gujarat and West Bengal had a significantly lower risk (1.3–1.6%) than the national risk of RTI deaths. Men living in urban areas had slightly higher age-standardised mortality rates and risks of RTI deaths (27.6/100 000; 2.4%, 2.1–2.6) compared to men living in rural areas (24.9/100 000; 2.0%, 1.8–2.1). By contrast, female RTI mortality rates and risks before age 70 varied much less across states and were similar in rural and urban areas (data not shown).
Figure 1.

Road traffic injury deaths, age-standardised death rate and cumulative risk (age 0–69 years) across states and regions of India, by gender. Death rates are standardised to the 2005 United Nations estimated Indian population. Symbol size is proportional to sample size. Northeast states include Sikkim, Arunachal Pradesh, Nagaland, Manipur, Mizoram, Tripura and Meghalaya. Total estimates include the 80 male and 19 female deaths from Pondicherry, Chandigarh, Uttarakhand, Dadra & Nagar Haveli, A&N Islands, Daman & Diu, Lakshadweep and Goa. CHT=Chhatisgarh.
The deceased mode of transportation was described in the narratives of 2105 (92%) of the RTI deaths. National estimates for the deceased mode of transportation were calculated, as those with unknown and known modes of transportation did not appear to differ with respect to the major sociodemographic traits (see online supplementary table S1). Vulnerable road users are those without a rigid barrier protecting against traumatic forces and include pedestrians, motorcyclists, bicyclists and three-wheelers. They constituted a majority (68%; n=124 000, 99% CI 115 000–131 000) of RTI deaths, led by pedestrians (37%; n=68 000, 62 000–73 000) and motorcyclists (20%; n=36 000, 31 000–40 000; figure 2). Drivers and passengers of motorised four-wheelers comprised 16% (n=31 000, 27 000–35 000) of RTI deaths. By contrast, the 2005 police reports, which use a different but compatible classification system to ICD-10, recorded only 33 000 vulnerable road user deaths and only 9000 pedestrian deaths.27 The most common types of vehicle to collide into the decedents were heavy transport vehicles and buses (37%; n=68 000, 61 000–74 000), followed by cars and vans (15%; n=28 000, 24 000–32 000). Single-vehicle incidents comprised 9% of deaths (n=17 000, 14 000–20 000). The most frequent combinations, resulting in 23% (n=42 000, 37 000–47 000) of RTI deaths, were collisions of heavy transport vehicles or buses with pedestrians and motorcyclists (data not shown).
Figure 2.

Deceased mode of transportation, place of death and timing of death. (A) Deceased mode of transportation in the present study compared to the National Crime Records Bureau 2005 Report. Shaded line represents vulnerable road users (defined as road users without a rigid barrier protecting against traumatic forces, that is, pedestrians, bicyclists, motorcyclists and three-wheeler riders). Percentages from the present study are weighted by state and rural/urban residence. The estimated/reported number of deaths in 2005 (in thousands). (B) Place of death and (C) timing of death based on verbal autopsy narratives. Shaded lines represent deaths that are reported as occurring at the scene of collision or occurring instantly (defined as within 5 min).
The place and timing of death were described in the narratives of 1733 (75%) and 1596 (69%) of the RTI deaths, respectively, (figure 2; see online supplementary table S1 for a summary of missing data from the narratives with respect to characteristics of the deceased). For these narratives, only the study proportion and not national estimates were made. Most RTI deaths occurred at the scene of collision (58%, 1005/1733) or instantly, defined as within 5 min (55%, 883/1596). Only 3% (45/1733) were labelled as potentially avertable with better prehospital transport as they occurred on the scene but not instantly. Another 35% of deaths occurred en route (7%, 124/1733) or in hospital (28%, 481/1733).
Injuries sustained by the deceased were reported from 1124 narratives (49%). Head injuries were the most commonly reported (62%, 691/1124), of which 76% (524/691) were reported as isolated head injuries (figure 3). A greater percentage of motorcyclists (78%, 188/241) had head injuries reported compared to non-motorcyclists (57%, 457/807). After adjusting for age, sex, rural/urban, neighbourhood asset and education, bicyclists and motorcyclists were more likely to have head injuries reported compared to non-vulnerable road users (adjusted OR 1.7, 1.2–2.5; see online supplementary table S2).
Figure 3.

Reported injuries from 1124 verbal autopsy narratives (49% of all 2299 road traffic injury deaths). Percentages refer to those in each row with given injury (columns). *Values in bold denote two by two χ2 tests with p<0.05 (excluding unknowns). Abdominal and spinal injuries were also reported but not shown due to small numbers (61 and 25 cases, respectively).
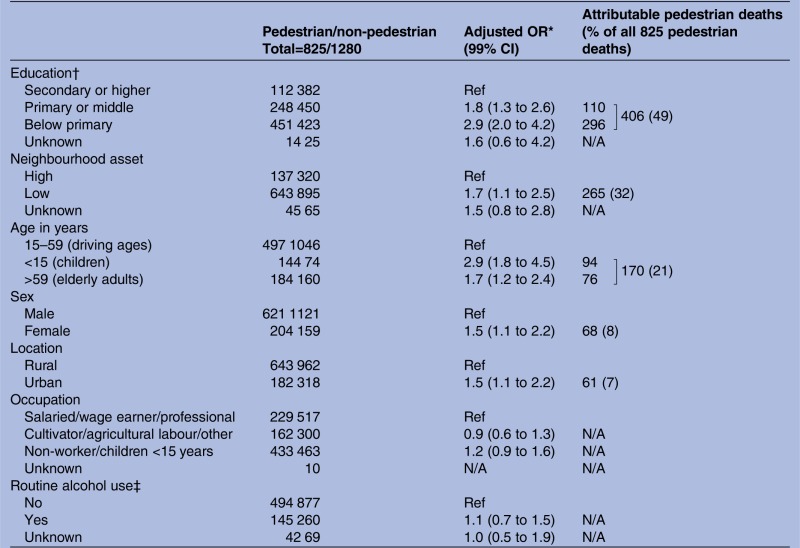
Compared to non-pedestrian RTI deaths, pedestrian deaths occurred to those who had less education (or in the case of children aged <15 years, to those who had less educated parents) (adjusted OR 2.9, 99% CI 2.0 to 4.2), lived in poorer neighbourhoods (1.7, 1.1 to 2.5), were children or elderly adults (<15 years: 2.9, 1.8 to 4.5; >59 years: 1.7, 1.2 to 2.4), were female (1.5, 1.2 to 2.2) and lived in urban areas (1.5, 1.1 to 2.2; table 2). If pedestrian deaths had the same proportion of secondary or higher education as non-pedestrian RTI deaths, there would be 406/825 (49%) fewer pedestrian deaths, corresponding to approximately 33 000 deaths nationally in 2005. The corresponding attributable proportion for living in richer versus poorer neighbourhoods would be 265/825 (32%) or approximately 22 000 deaths nationally. Within the narratives we could code, there were no differences between pedestrian and non-pedestrian RTI deaths in the timing of death, place of death, reported injuries or reported routine use of alcohol or smoking (data not shown).
Table 2.
Characteristics of pedestrian RTI deaths and attributable proportions
 |
*ORs are adjusted for all other variables in this table except for alcohol use; the odds ratios for alcohol use are adjusted for all other variables in this table.
†Education of deceased adults or, in cases of deceased children <15 years, education of respondent.
‡Excludes 218 children.
Discussion
RTI is an important cause of death in India, causing 183 600 deaths in 2005, or about 2% of all deaths.22 Much of the deceased were men between ages 15 and 59 years. Men had a fourfold higher cumulative risk of RTI death compared to women before the age of 70. Among the major states, there was an approximately threefold variation in the age-standardised RTI death rate and cumulative risk for men.
Our estimated number of RTI deaths is more than 50% greater than the 118 265 deaths reported in the official police statistics of the National Crime Records Bureau (NCRB) in 2005.27 Compared to our estimates, the extent of under-reporting of the crude death rate in major states by NCRB ranged from <1% to about 80% (see online supplementary table S3). Existing regional population-based injury surveys in India support our findings and also report higher crude RTI death rates than NCRB statistics.8 11 Under-reporting of RTI deaths in police statistics has been reported in India and other LMICs.28–30 A study in urban India comparing both hospital-based RTI data and community-based RTI data to police records identified factors contributing to under-reporting that included the deceased believed to be at fault, collision resulting from hit-and-runs, limited police resources and the lack of a standard police reporting protocol by hospitals.28 The factors contributing to police under-reporting, especially in rural India, require further examination. Our estimated number of RTI deaths in 2005 was consistent with the WHO estimate for 2004.14 However, we observed a slightly higher male proportion (83% MDS vs 77% WHO, all ages) and a higher proportion of male deaths between 15 and 59 years (65% MDS vs 61% WHO).
Almost three-quarters of all RTI deaths in India were of pedestrians and other vulnerable road users. In contrast, a much lower proportion (27%) was reported by the NCRB (figure 2). This difference equated to 59 000 pedestrian and 32 000 other vulnerable road user deaths that were not included in the 2005 NCRB records. Existing RTI studies based on regional surveys and hospital series also reported a high proportion (>60%) of vulnerable road user deaths similar to our findings.11 12 30–32 Since the majority of vulnerable road users were pedestrians, our findings suggest that the RTI deaths in individuals who were less educated, poor, female or lived in urban areas may have been disproportionally excluded from the NCRB records. While poverty and education are not likely to be in the direct causal pathway of pedestrian deaths, they nonetheless point to other associated risk factors. Indeed, 55 000 pedestrian deaths in 2005 (81%) were associated with lower education or living in poorer neighbourhoods compared to non-pedestrian RTI deaths. While the less educated and the poor most likely travelled more often by foot, they might also have been exposed to undetermined environmental (neighbourhoods with unsafe roads), biological (poor vision or decreased mobility due to poor health) and behavioural (alcohol or other substance use) risk factors for pedestrian death.12 33 34 Further studies are needed to better understand pedestrian deaths in LMICs.
Over half of the RTI deaths occurred instantly at the scene of collision and/or had head injury reported. These findings, together with the existing RTI hospital series and regional surveys in India, make a strong argument that investments in primary and secondary prevention could potentially avert the greatest proportion of RTI deaths. To address the high proportion of instant deaths and head injuries among RTI deaths in India, specific interventions that are effective and based on studies in LMICs should be emphasised; these may include speed bumps, motorcycle helmets and increasing fines and license suspensions for rule infractions.33 In contrast, improving prehospital transport and hospital trauma care could only potentially affect the 38% who died on the scene with delayed hospital transport (3%), en route to hospital (7%) or in hospital (28%).
Our study is the first nationally representative survey of the causes of death in India. The simple descriptive statistics provide clear evidence on the large and avertable burden from RTI, particularly among productive age adults and pedestrians. To the best of our knowledge, only one recent study in Vietnam has used similar methods to analyze RTI deaths and policy implications on a national scale.35
Our study faced certain limitations. First, we might have misclassified certain causes of death including suicide as RTI deaths. However, the extent of misclassification should be minimal since the RHIME verbal autopsy method was shown to be robust in discerning between types of injury deaths36 and since the immediate two-physician agreement was high for RTI deaths (89.5%, table 1). Furthermore, suicides cause about 200 000 deaths in India annually, but few are due to RTI.19 Second, since the modes of transportation, place and timing of death and injuries sustained were extracted from layperson open-ended narratives, the data accuracy may be in question. For example, with the deceased mode of transportation, the extent of misclassification (by our study) or misreporting (by NCRB) that contributed to the differences between the two sources is uncertain. With the injuries reported, our findings from these narratives may have most likely undercounted less visible injuries (chest, abdomen and spine) compared to highly visible injuries such as bleeding and deformity for head and extremity injuries. Nevertheless, our findings are consistent with the available Indian regional surveys and hospital series on the mode of transportation11 12 30–32 37 place and timing of death1 37–41 and injuries sustained.12 37 42 43 Third, since the narrative was not designed specifically to capture RTI death characteristics, over 25% of deaths had missing data for mode of transportation, place of death, timing of death or reported injuries (see online supplementary table S1). Thus, our findings for these elements extracted from the narratives may be less representative of the decedents who lived in rural or poor areas. Finally, reliable forward projection of the number of RTI deaths beyond 2005 was not possible since the increase in the NCRB reported number of RTI deaths of 140% from 2005 to 2011 appeared to outpace the rate of population growth.44 As the proportion of vulnerable road user deaths remained stable during this period in the NCRB reports, we postulated that this increase represented an actual increase in RTI death totals rather than more accurate reporting. Furthermore, given the rapid economic expansion and concurrent changes in motorisation including the types of vehicle sharing the road and road infrastructure,45 46 our results on deceased mode of transportation, place and timing of death, as well as injuries sustained may not reflect the current Indian scenario. An analysis of the trend from 2001 to 2014 is planned pending ongoing data collection in MDS.
In India, RTI is a significant cause of preventable death, particularly in men of productive working age and among pedestrians, bicyclists and motorcyclists. We have shown that properly designed simple verbal autopsy narratives can document the much needed surveillance data on the numbers, rates, risks and basic RTI mechanisms such as modes of transportation, timing of death, place of death and injuries sustained. Our findings suggested that investment in primary and secondary prevention could address a large proportion of avoidable RTI deaths.
Supplementary Material
Acknowledgments
The authors thank the Office of the RGI for the ongoing productive collaboration on MDS, CR for technical assistance, and MP and SL for data extraction. The opinions expressed in this article are those of the authors and do not necessarily represent those of the Government of India or the RGI.
Footnotes
Contributors: PJ and the MDS Collaborators (appendix) designed, planned, and executed the MDS in close collaboration with the Office of the Registrar General of India (RGI). MH and PJ performed the data analysis. All authors contributed to data interpretation, revisions of the manuscript and provided final approval. PJ is the guarantor.
Funding: This study is supported by grants from the John E Fogarty International Center of the National Institutes of Health (R01-TW05991–01 and TW07939–01), the Bill & Melinda Gates Foundation through the Disease Control Priorities Network Project, and the University of Toronto (to PJ); the Canada Research Chair Programme (to PJ and ABN); and the Canadian Institutes of Health Research Doctoral Award (to MH). The funding sources had no role in the study design; data collection, analysis, interpretation; writing of the manuscript; or decision to submit for publication. The senior author had full access to all the data in the study and had final responsibility for the decision to submit this study for publication.
Competing interests: None.
Ethics approval: Post-Graduate Institute of Medical Education and Research in Chandigarh, India; St Michael's Hospital in Toronto, Canada; and the Indian Council of Medical Research's Health Ministry's Screening Committee.
Provenance and peer review: Not commissioned; externally peer reviewed.
Data sharing statement: The data used in this study are the property of the Registrar General of India and the overall mortality results have been published in 2009.47 Application for data access can be made to the Office of the Registrar General of India.
References
- 1.Peden M, Scurfield R, Sleet D, et al. World report on road traffic injury prevention: World Health Organization. 2004:1–244
- 2.Chisholm D, Naci H, Hyder AA, et al. Cost effectiveness of strategies to combat road traffic injuries in sub-Saharan Africa and South East Asia: mathematical modelling study. BMJ 2012;344:e612. [DOI] [PMC free article] [PubMed] [Google Scholar]
- 3.The PLoS Medicine Editors Preventing road deaths—time for data. PLoS Med 2010;7:e1000257. [DOI] [PMC free article] [PubMed] [Google Scholar]
- 4.Barffour M, Gupta S, Gururaj G, et al. Evidence-based road safety practice in India: assessment of the adequacy of publicly available data in meeting requirements for comprehensive road safety data systems. Traffic Inj Prev 2012;13(Suppl 1):17–23 [DOI] [PubMed] [Google Scholar]
- 5.Kopits E, Cropper ML. Traffic fatalities and economic growth. World Bank Development Research Group Environment and Infrastructure, 2003 [Google Scholar]
- 6.Sathiyasekaran BW. Population-based cohort study of injuries. Injury 1996;27:695–8 [DOI] [PubMed] [Google Scholar]
- 7.Varghese M, Mohan D. Transportation injuries in rural Haryana, North India. Proceedings of the International Conference on Traffic Safety 2003:326–9 [Google Scholar]
- 8.WHO Injury prevention and control: an epidemiological study of injuries in the area of Municipal Corporation of Delhi. Regional Office for South-East Asia, 2003:1–18 [Google Scholar]
- 9.Gururaj G, Suryanarayana SP. Burden and impact of injuries: results of population-based survey. Proceedings of the 7th World Conference on Injury Prevention 2004:275–6 [Google Scholar]
- 10.Dandona R. Patterns of road traffic injuries in a vulnerable population in Hyderabad, India. Inj Prev 2006;12:183–8 [DOI] [PMC free article] [PubMed] [Google Scholar]
- 11.Dandona R, Kumar GA, Ameer MA, et al. Incidence and burden of road traffic injuries in urban India. Inj Prev 2008;14:354–9 [DOI] [PMC free article] [PubMed] [Google Scholar]
- 12.Gururaj G. Road traffic deaths, injuries and disabilities in India: current scenario. Natl Med J India 2008;21:14–20 [PubMed] [Google Scholar]
- 13.Garg N, Hyder A. Road traffic injuries in India: a review of the literature. Scand J of Public Health 2006;34:100–9 [DOI] [PubMed] [Google Scholar]
- 14.World Health Organization The global burden of disease: 2004 Update. World Health Organization, 2008 [Google Scholar]
- 15.Mathers CD, Bernard C, Moesgaard Iburg K, et al. Global burden of disease in 2002: data sources, methods, and results. Global Programme on Evidence for Health Policy Discussion Paper No. 54 World Health Organization, 2003 [Google Scholar]
- 16.Jha P, Gajalakshmi V, Gupta PC, et al. Prospective study of one million deaths in India: rationale, design, and validation results. PLoS Med 2006;3:e18. [DOI] [PMC free article] [PubMed] [Google Scholar]
- 17.Million Death Study Collaborators Causes of neonatal and child mortality in India: a nationally representative mortality survey. Lancet 2010;376:1853–60 [DOI] [PMC free article] [PubMed] [Google Scholar]
- 18.Dikshit R, Gupta PC, Ramasundarahettige C, et al. Cancer mortality in India: a nationally representative survey. Lancet 2012;379:1807–16 [DOI] [PubMed] [Google Scholar]
- 19.Patel V, Ramasundarahettige C, Vijayakumar L, et al. Suicide mortality in India: a nationally representative survey. Lancet 2012;379:2343–51 [DOI] [PMC free article] [PubMed] [Google Scholar]
- 20.Sinha DN, Dikshit R, Kumar R, et al. Prospective Study of Million Deaths in India: Technical document no VIII: Health care professional's manual for assigning causes of death based on RHIME household reports. RGI-CGHR, University of Toronto, 2011. http://www.cghr.org/mds (accessed 1 Aug 2012) [Google Scholar]
- 21.WHO International statistical classification of diseases and related health problems, ICD-10: three volume set. World Health Organization, 2010 [Google Scholar]
- 22.United Nations Populations Division. 2009. World population prospects (2008 revision) http://www.un.org/esa/population/publications/wpp2008/ (accessed 2 Jul 2011)
- 23.Mari Bhat PN. Completeness of India's sample registration system: an assessment using the general growth balance method. Popul Stud 2002;56:119–34 [DOI] [PubMed] [Google Scholar]
- 24.Sivanandan V. An assessment of the completeness of death registration in India over the periods 1975–1978 and 1996–1999 under the generalized population model: an analysis based on SRS data. Mumbai: International Institute for Population Sciences, 2004 [Google Scholar]
- 25.Jha P, Kumar R, Khera A, et al. HIV mortality and infection in India: estimates from nationally representative mortality survey of 1.1 million homes. BMJ 2010;340:c621. [DOI] [PMC free article] [PubMed] [Google Scholar]
- 26.Dhingra N, Jha P, Sharma VP, et al. Adult and child malaria mortality in India: a nationally representative mortality survey. Lancet 2010;376:1768–74 [DOI] [PMC free article] [PubMed] [Google Scholar]
- 27.National Crime Records Bureau Accidental deaths and suicides in India, 2005. Ministry of Home Affairs, Government of India, 2005 [Google Scholar]
- 28.Dandona R, Kumar GA, Ameer MA, et al. Under-reporting of road traffic injuries to the police: results from two data sources in urban India. Inj Prev 2008;14:360–5 [DOI] [PMC free article] [PubMed] [Google Scholar]
- 29.Alcorn T. Uncertainty clouds China's road-traffic fatality data. Lancet 2011;378:305–6 [DOI] [PubMed] [Google Scholar]
- 30.Naci H, Chisholm D, Baker TD. Distribution of road traffic deaths by road user group: a global comparison. Inj Prev 2009;15:55–9 [DOI] [PubMed] [Google Scholar]
- 31.Mohan D. The road ahead: traffic injuries and fatalities in India. Transportation research and injury prevention programme. Delhi: Indian Institute of Technology, 2004 [Google Scholar]
- 32.Mohan D. Traffic safety and health in Indian cities. J Transport Infrastructure 2002;9:79–94 [Google Scholar]
- 33.Norton R, Hyder A, Bishai D, et al Unintentional injuries. In: Disease control priorities in developing countries. Oxford University Press, 2006 [Google Scholar]
- 34.Grimm M, Treibich C. Determinants of road traffic crash fatalities across Indian states. Health Econ 2013;22:915–30 [DOI] [PubMed] [Google Scholar]
- 35.Ngo AD, Rao C, Phuong Hoa N, et al. Road traffic related mortality in Vietnam: evidence for policy from a national sample mortality surveillance system. BMC Public Health 2012;12:561. [DOI] [PMC free article] [PubMed] [Google Scholar]
- 36.Hsiao M, Morris SK, Bassani DG, et al. Factors associated with physician agreement on verbal autopsy of over 11500 injury deaths in India. PLoS ONE 2012;7:e30336. [DOI] [PMC free article] [PubMed] [Google Scholar]
- 37.Singh H, Dhattarwal SK. Pattern and distribution of injuries in fatal road traffic accidents in Rohtak (Haryana). ***J Indian Acad Forensic Med 2004;26:20–3 [Google Scholar]
- 38.Dandona R, Mishra A. Deaths due to road traffic crashed in Hyderabad city in India: need for strengthening surveillance. Natl Med J India 2004;17:74–9 [PubMed] [Google Scholar]
- 39.Sahdev P, Lacqua MJ, Singh B, et al. Road traffic fatalities in Delhi: causes, injury patterns, and incidence of preventable deaths. Accident Anal Prev 1994;26:377–84 [DOI] [PubMed] [Google Scholar]
- 40.Bhattacharjee J, Bora D, Sharma RS, et al. Unnatural deaths in Delhi during 1991. Med Sci Law 1996;36:194–8 [DOI] [PubMed] [Google Scholar]
- 41.Jain A, Menezes RG, Kanchan T, et al. Two wheeler accidents on Indian roads—a study from Mangalore, India. J Forensic Leg Med 2009;16:130–3 [DOI] [PubMed] [Google Scholar]
- 42.Gururaj G, Shastry KVR, Chandramouli AB, et al. Traumatic brain injury. Bangalore: National Institute of Mental Health and Neuro Sciences, 2005 [Google Scholar]
- 43.Colohan AR, Alves WM, Gross CR, et al. Head injury mortality in two centers with different emergency medical services and intensive care. J Neurosurg Pediatrics 1989;71:202–7 [DOI] [PubMed] [Google Scholar]
- 44.National Crime Records Bureau Accidental deaths and suicides in India, 2011. Ministry of Home Affairs, Government of India, 2011 [Google Scholar]
- 45.Transport Research Wing, Ministry of Road Transport & Highways Basic road statistics of India. Government of India, 2012 [Google Scholar]
- 46.Transport Research Wing, Ministry of Road Transport & Highways Road transport year book (2009–10 & 2010–11). Government of India, 2012 [Google Scholar]
- 47.Registrar General of India and Centre for Global Health Research Causes of death in India, 2001–2003: sample registration system. Government of India, 2009 [Google Scholar]
Associated Data
This section collects any data citations, data availability statements, or supplementary materials included in this article.