

Abstract
Objectives
This study sought to evaluate the interrelation of atherosclerotic burden, as assessed by coronary artery calcium (CAC) score and coronary vascular function, as assessed by quantitative estimates of coronary flow reserve (CFR), with respect to prediction of clinical outcomes.
Background
The contribution of coronary vascular dysfunction, atherosclerotic burden, and the 2 combined to cardiac events is unknown.
Method
A total of 901 consecutive patients underwent 82Rubidium myocardial perfusion imaging (MPI) positron emission tomography (PET) and CAC scan. All patients had normal MPI. The primary endpoint was a composite of major adverse cardiac events (MACE) including cardiac death, nonfatal myocardial infarction, late revascularization, and admission for heart failure.
Results
At baseline, CFR decreased (2.15 ± 0.72, 2.02 ± 0.65, and 1.88 ± 0.64, p < 0.0001) with increasing levels of CAC (0, 1 to 399, and ≥400). Over a median of 1.53 years (interquartile range: 0.77 to 2.44), there were 57 MACE. Annual risk-adjusted MACE rates were higher for patients with CFR <2.0 compared with ≥2.0 (1.9 vs. 5.5%/year, p = 0.0007) but were only borderline associated with CAC (3.1%, 3.4%, and 6.2%/year for CAC of 0, 1 to 399, and ≥400, respectively; p = 0.09). Annualized adjusted MACE was increased in the presence of impaired CFR even among patients with CAC = 0 (1.4% vs. 5.2%, p = 0.03). Cox proportional hazards analysis revealed that CFR improved model fit, risk discrimination, and risk reclassification over clinical risk, whereas CAC only modestly improved model fit without improving risk discrimination or reclassification.
Conclusions
In symptomatic patients with normal MPI, global CFR but not CAC provides significant incremental risk stratification over clinical risk score for prediction of major adverse cardiac events.
Keywords: atherosclerotic burden, coronary artery calcium, coronary flow reserve, hybrid PET/CET, prognosis
Coronary artery calcium (CAC) is absent in normal coronary arteries, whereas its presence and magnitude reflects the overall burden of coronary atherosclerosis (1,2). Although CAC is a well-established marker of CAD and clearly risk stratifies asymptomatic subjects (3), the observation that coronary calcium content is lower in culprit lesions of patients with acute coronary syndromes compared to those with stable coronary artery disease (CAD), suggests that calcification may represent a healing response to injury (4). However, data from several large prospective studies demonstrating a stepwise increase in coronary risk with increasing calcium scores have challenged the notion that calcified coronary disease represents a scenario of clinical stability (3,5–10).
Post-mortem studies have shown that there are many noncalcified plaques for every calcified plaque (1). Thus, it is unclear whether CAC itself increases risk of adverse coronary outcomes or whether CAC deposition serves as a proxy for the extent and magnitude of noncalcified atherosclerosis and its functional consequence of coronary vascular dysfunction. Our objective was to test the hypothesis that coronary vascular dysfunction, reflecting the adverse effect of widespread atherosclerosis on coronary epicardial and microvascular function, is a key determinant of adverse prognosis irrespective of the magnitude of coronary artery calcifications.
Methods
Study population and design
A total of 1,240 consecutive patients underwent both stress myocardial perfusion positron emission tomography (PET) and CAC computed tomography (CT) at the Brigham & Women’s Hospital (Boston, Massachusetts) between January 9, 2006, and June 30, 2010, for investigation of symptoms suspicious of CAD. In order to avoid the confounding effect of obstructive CAD, patients with abnormal PET myocardial perfusion imaging (MPI) studies (n = 292, 23.5%) were excluded, as were those with a history of prior myocardial infarction and/or revascularization (n = 78, 6.3%), a left ventricular ejection fraction <40% (n = 9, 0.7%), known valvular heart disease (n = 18, 1.5%), or atrial fibrillation (n = 0, 0%). The remaining 901 patients comprised the study cohort for the analysis. The study was approved by the Partners Healthcare Institutional Review Board and all study procedures were in accordance with institutional guidelines.
Clinical and historical data
Clinical histories elicited at the time of exam ascertained the patients’ symptoms, coronary risk factors, and medication use at the time of the index study. Height and weight were measured and recorded, and body mass index was calculated. The Duke clinical risk score was calculated for each patient as previously described (11).
Hybrid PET/CT study
MYOCARDIAL PERFUSION PET SCAN
Patients were studied using a whole-body PET-CT scanner (Discovery RX or STE LightSpeed 64, GE Healthcare, Milwaukee, Wisconsin) after an overnight fast. Patients were instructed to avoid caffeine for at least 12 h and methylxanthine containing substances for 24 h.
Myocardial blood flow (MBF) was measured at rest and during peak hyperemia using 82Rubidium as a perfusion tracer. Following a scout CT scan (120 kVp, 10 mA) used for proper patient positioning, a CT transmission scan was acquired (140 kVp, 10 mA) for subsequent correction of photon attenuation. Beginning with the intravenous bolus administration of 82Rubidium (1,480 to 2,220 MBq), list mode images were acquired for 7 min as previously described (12). Then, intravenous dipyridamole (0.142 mg/kg/min for 4 min, n = 465 [52%]), adenosine (0.142 mg/kg/min for 4 min, n = 50 [5%]), regadenoson (0.4 mg bolus, n = 344 [38%]), or dobutamine (10 to 50 μg/kg/min, n = 42 [5%]) was infused. At peak hyperemia, a second dose of 82Rubidium (1,480 to 2,220 MBq) was injected and images were recorded in the same manner. A second CT transmission scan was acquired (140 kVp, 10 mA) after vasodilator stress for attenuation correction of the stress emission data. The heart rate, systemic blood pressure, and 12-lead electrocardiogram were recorded at baseline and every minute during and after the infusion of the stress agent. The rate pressure product was calculated by multiplying heart rate and systolic blood pressure measured at rest and during peak hyperemia, respectively.
CORONARY ARTERY CALCIUM CT SCAN
After myocardial perfusion imaging, all patients under-went CT scan for CAC scoring during breath-hold on the integrated 64-slice multidetector CT scanner (collimation 64 × 0.625 mm, gantry rotation time 350 ms, effective temporal resolution 175 ms, 120 kV, 300 mA). CAC scans were performed using axial acquisition with prospective electrocardiographic triggering at 70% of the R-R interval. Subsequently, 3-mm images were reconstructed using filtered back projection and a standard convolution kernel with a 512 × 512 matrix and a fixed 25-cm field of view. No beta-blockers were administered and the average heart rate during the study was 70 beats/min (range: 62 to 80 beats/min). Estimated radiation exposure for the integrated PET/CT study was 5.46 mSv (range: 5.00 to 5.98 mSv).
Results
PET imaging data
LEFT VENTRICULAR SYSTOLIC FUNCTION
Rest and stress left ventricular ejection fraction were calculated from gated myocardial perfusion images using commercially available software (Corridor4DM; Invia, Ann Arbor, Michigan). Left ventricular ejection fraction reserve was considered present when LVEF increased from rest to stress.
QUANTITATIVE MYOCARDIAL BLOOD FLOW AND FLOW RESERVE
Absolute MBF (in ml/g/min) was computed from the dynamic rest and stress images using commercially available software (Corridor4DM, Invia) and previously validated methods (13). Automated factor analysis was used to generate blood pool (arterial input function) and tissue time-activity curves. Regional and global rest and peak stress MBF were calculated by fitting the 82Rubidium time-activity curves to a 2-compartment tracer kinetic model as described previously (13). Per-patient global coronary flow reserve (CFR) was calculated as the ratio of absolute MBF at stress over rest for the entire left ventricle. Quantitation of MBF was performed by 4 operators. Corrected MBF at rest was calculated by dividing the MBF by the resting rate pressure product and multiplying by 10,000. The intraclass correlation coefficient for CFR among these 4 readers was 0.94 (95% confidence interval [CI]: 0.88 to 0.98) (14), indicating excellent reproducibility.
Gated CT data
Scoring was performed by experienced independent observers who were blinded to the patients’ clinical history, outcomes, and CFR results. Agatston scores were computed with commercially available software (Corridor4DM, INVIA) (10). Artery-specific scores were summed across lesions identified in the left main, left anterior descending, left circumflex, and right coronary arteries to provide a total CAC score for each patient.
Assessment of outcomes
The primary endpoint of the study was a composite of major adverse cardiac events (MACE) such as cardiac death, myocardial infarction, revascularization, and rehospitalization for heart failure. Ascertainment of cause of death, nonfatal myocardial infarction, revascularization (>90 days after PET/CT scan), and rehospitalization for heart failure were performed by blinded adjudication of 2 cardiologists. Vital status for all patients was ascertained by careful integration of data from the Social Security Death Index, the National Death Index, and the Partners Healthcare Research Patient Data Registry. Documentation of all other events was based on review of the Partners Healthcare Research Patient Data Registry, mailed questionnaires, and telephone interviews with patients or their next of kin. Myocardial infarction was defined according to American College of Cardiology/European Society of Cardiology criteria (15). Cardiac death was defined as death of any cause including a fatal myocardial infarction, sudden cardiac death, or heart failure, which was adjudicated by review of hospital records, autopsy records, and death certificates from the National Death Index.
Statistical analysis
Patient demographics and baseline characteristics were summarized as medians and interquartile ranges or means and standard deviation for continuous variables, as appropriate based on normality, and frequencies for dichotomous and ordinal variables. Statistical significance was assessed using Student t tests or Wilcoxon tests for normal and nonnormal continuous data and with Fischer exact or chi-square tests for dichotomous and ordinal variables. Correlation between continuous CFR and continuous CAC score was assessed using linear regression analysis. Two-sided p values <0.05 were considered significant. All statistical analyses were performed using SAS 9.2 (SAS Institute Inc., Cary, North Carolina).
MULTIVARIABLE MODELING
Cox proportional hazards models were used to assess the impact of CAC, CFR, and the 2 combined on MACE after adjustment for the effects of Duke clinical risk score, which integrates age, sex, symptoms, electrocardiographic findings, and coronary risk factors (11). Log transformations of the Duke clinical risk score, CFR, and CAC + 1 were used to accommodate the rightward skew of the data and to reduce heteroscedasticity. A series of models were developed starting with 1 containing only Duke clinical risk score. Then ln(CAC + 1) and CFR (as continuous variables) and the 2 combined were sequentially incorporated. Ln(CAC + 1) as a continuous variable was selected over a categorical representation due to improved model fit with fewer parameters. At each stage the models were carefully examined for the validity of the proportional hazards assumption and additive value. A sensitivity analysis was conducted to evaluate the impact of incomplete follow-up (Online Appendix). Survival was plotted using direct adjusted MACE probabilities from the Cox survival model (16). Poisson regression was used to compute adjusted annualized event rates.
ASSESSMENT OF INCREMENTAL VALUE
Incremental prognostic value of CAC, CFR, and the 2 combined was assessed with the likelihood ratio test to assess the improved fit of a Cox model containing CAC, CFR, and the 2 combined to 1 with clinical risk score. The c-index was calculated for each model (17) and comparisons were made with the method of Antolini et al. (18). The potential impact of CAC, CFR, and the 2 combined for the assessment of cardiac risk on clinical management was assessed by net reclassification improvement at 3 years using estimated annual rates of MACE of <2%, 2 to 6%, and >6% to define categories of low, intermediate, and high risk, respectively (19,20). Because cardiac death accounted for only half of the MACE in our cohort of patients with suspected coronary artery disease, we used thresholds that are twice as high as the cutpoints proposed for stratification of patients at low and high risk of cardiac death (1% and 3%, respectively) in ACC/AHA stable angina guidelines (21,22).
Results
Patient characteristics
A total of 901 consecutive patients met inclusion criteria during the study period and were followed for a median of 1.53 years (interquartile range: 0.77 to 2.44 years). Complete follow-up, defined as >90 days or through the end of the study period, was obtained for 92.1% of patients. Baseline characteristics of the study cohort are summarized in Table 1. Two-thirds of the patients were women. Coronary risk factors were prevalent in this cohort. Patients who experienced MACE were older, more likely to have dyspnea at presentation, had a higher Duke clinical risk score, had a lower left ventricular ejection fraction, had a lower peak myocardial blood flow and flow reserve, and a higher CAC score.
Table 1.
Patient Characteristics
| Variable | All Patients (n = 901) |
Cardiac Events (n = 57) |
No Cardiac Events (n = 844) |
p Value |
|---|---|---|---|---|
| Demographics | ||||
| Age, yrs | 61.4 (53.6–69.7) | 63.2 (55.6–73.4) | 61.4 (53.4–69.3) | 0.005 |
| Male | 288 (32.0%) | 24 (42.1%) | 264 (31.3%) | 0.090 |
| Hispanic | 151 (16.8%) | 9 (15.8%) | 142 (16.8%) | 0.84 |
| Race | 0.11 | |||
| White | 470 (52.2%) | 27 (47.4%) | 443 (52.5%) | |
| Black | 198 (22.0%) | 18 (31.6%) | 1,808 (21.3%) | |
| Other/unknown | 233 (25.9%) | 12 (21.1%) | 221 (26.2%) | |
| Risk factors | ||||
| BMI, kg/m2 | 30.2 (25.8–37.1) | 33.2 (25.7–42.0) | 30.2 (25.8–36.6) | 0.035 |
| BMI ≥30 kg/m2 | 463 (51.4%) | 34 (59.6%) | 429 (50.8%) | 0.19 |
| Hypertension | 662 (73.5%) | 48 (84.2%) | 614 (72.8%) | 0.058 |
| Dyslipidemia | 495 (54.9%) | 40 (70.2%) | 455 (53.9%) | 0.017 |
| Diabetes | 275 (30.5%) | 29 (50.9%) | 246 (29.2%) | 0.0006 |
| Family history of CAD | 247 (27.4%) | 12 (21.1%) | 235 (27.8%) | 0.27 |
| Tobacco use | 97 (10.8%) | 8 (14.0%) | 89 (10.6%) | 0.41 |
| Dialysis | 38 (4.2%) | 4 (7.0%) | 34 (4.0%) | 0.28 |
| Clinical risk score, % | 22.4 (10.3–46.3) | 41.9 (21.9–67.6) | 21.1 (9.6–45.4) | <0.0001 |
| Medications | ||||
| Aspirin | 429 (47.6%) | 31 (54.4%) | 398 (47.2%) | 0.29 |
| β-adrenergic blockers | 403 (44.7%) | 38 (66.7%) | 365 (43.3%) | 0.0006 |
| Cholesterol agents | 417 (46.3%) | 31 (54.4%) | 386 (45.7%) | 0.20 |
| Insulin | 106 (11.8%) | 13 (22.8%) | 93 (11.0%) | 0.0075 |
| Oral hypoglycemic agents | 102 (11.3%) | 10 (17.5%) | 92 (10.9%) | 0.13 |
| Calcium-channel blockers | 180 (20.0%) | 19 (33.3%) | 161 (19.1%) | 0.0092 |
| ACE inhibitors | 301 (33.4%) | 27 (47.4%) | 274 (32.5%) | 0.021 |
| Nitrates | 48 (5.3%) | 8 (14.0%) | 40 (4.7%) | 0.0025 |
| Diuretics | 269 (29.9%) | 22 (38.6%) | 247 (29.3%) | 0.14 |
| Indications | ||||
| Chest pain | 514 (57.1%) | 29 (50.9%) | 485 (57.5%) | 0.33 |
| Dyspnea | 258 (28.6%) | 26 (45.6%) | 232 (27.5%) | 0.0034 |
| Pre-operative | 125 (13.9%) | 6 (10.5%) | 119 (14.1%) | 0.45 |
| Cardiovascular history | ||||
| Cerebrovascular disease | 30 (3.3%) | 2 (3.5%) | 28 (3.3%) | 0.94 |
| Peripheral vascular disease | 33 (3.7%) | 5 (8.8%) | 28 (3.3%) | 0.034 |
| Stress protocol | 0.0004 | |||
| Adenosine | 50 (5.6%) | 2 (3.2%) | 48 (5.7%) | |
| Dipyridamole | 465 (51.2%) | 45 (79.0%) | 420 (49.8%) | |
| Dobutamine | 42 (4.7%) | 1 (1.8%) | 41 (4.9%) | |
| Regadenoson | 344 (38.2%) | 9 (15.8%) | 335 (39.7%) | |
| Imaging parameters | ||||
| Rest LVEF, % | 63 (56–69) | 60 (51–66) | 63 (57–69) | 0.025 |
| Stress-induced LVEF drop | 98 (10.9%) | 9 (14.5%) | 89 (10.6%) | 0.39 |
| Global CFR | 1.96 (1.53–2.45) | 1.63 (1.23–2.00) | 1.99 (1.56–2.47) | <0.0001 |
| Stress global MBF, ml/g/min | 2.18 (1.64–2.88) | 1.84 (1.25–2.42) | 2.20 (1.66–2.92) | 0.001 |
| Rest global MBF, ml/g/min | 1.08 (0.86–1.43) | 1.13 (0.85–1.52) | 1.08 (0.86–1.43) | 0.92 |
| CAC score (0/1–399/≥400) | 44.6/40.0/15.4% | 26.3/38.6/35.1% | 45.9/40.1/14.1% | <0.0001 |
Values are median (interquartile range) or n (%). Patients whose left ventricular ejection fraction (LVEF) at stress was less than that at rest were considered to have positive stress-induced drop in LVEF. Coronary artery calcium (CAC) score was expressed as the proportions.
ACE = angiotensin-converting enzyme; BMI = body mass index; CAD = coronary artery disease; CFR = coronary flow reserve, MBF = myocardial blood flow.
Myocardial blood flow and CAC score
In univariate analysis, rest MBF was comparable across categories of CAC score. In contrast, peak MBF and CFR showed a modest but statistically significant stepwise decline with increasing levels of CAC score (Table 2). The relative frequency of decreased CFR increased with increasing CAC scores (Fig. 1A). However, there was wide variability in abnormal coronary vasodilator function in each level of CAC score (Figs. 1B and 1C).
Table 2.
Quantitative Myocardial Perfusion and CAC
| Quantitative Myocardial Perfusion |
CAC |
|||
|---|---|---|---|---|
| 0 (n = 402) |
1–399 (n = 360) |
≥400 (n = 139) |
p Value | |
| Rest MBF, ml/g/min |
1.20 ± 0.51 | 1.19 ± 0.45 | 1.15 ± 0.50 | 0.62 |
| Corrected rest MBF, ml/ g/min |
1.32 ± 0.84 | 1.30 ± 0.68 | 1.29 ± 0.82 | 0.87 |
| Peak MBF, ml/g/min |
2.47 ± 1.06 | 2.30 ± 0.89 | 2.08 ± 0.99 | 0.0002 |
| Coronary flow reserve |
2.15 ± 0.72 | 2.02 ± 0.65 | 1.88 ± 0.64 | <0.0001 |
Values are mean ± SD. Statistical significance was assessed for the linear trend across categories of coronary calcium.
CAC = coronary artery calcium; MBF = myocardial blood flow.
Figure 1. Relationship Between CFR and Extent of Coronary Calcification.

Relative frequency of decreased coronary vascular function (i.e., coronary flow reserve [CFR] < 2.0) by extent and severity of coronary artery calcification (CAC) (A). Coronary flow reserve across coronary artery calcium (CAC) score categories (0, 1 to 399, and ≥400) (B). Dotted line reflects the median value of the entire population (CFR = 2.0). Correlation between CFR and coronary artery calcium (C). The dotted line reflects the 95% confidence intervals.
Patient outcomes
Table 3 summarizes the patients’ clinical outcomes by CAC score and CFR. Overall, 57 patients (6.3%) experienced MACE. The frequency of adverse cardiac events was higher with increasing CAC score and in the presence of reduced CFR.
Table 3.
Cause of Death and Cardiac Events by Groups of CAC and CFR
| CAC |
CFR |
|||||||
|---|---|---|---|---|---|---|---|---|
| All (n = 901) |
0 (n = 402) |
1–399 (n = 360) |
≥400 (n = 139) |
p Value | ≥2.0 (n = 430) |
<2.0 (n = 471) |
p Value | |
| Major adverse cardiac events | 57 (6.3%) | 15 (3.7%) | 22 (6.1%) | 20 (14.4%) | <0.0001 | 14 (3.3%) | 43 (9.1%) | 0.0003 |
| Death | ||||||||
| Cardiac | 12 (1.3%) | 2 (0.5%) | 7 (1.9%) | 3 (2.2%) | 0.07 | 1 (0.2%) | 11 (2.3%) | 0.0066 |
| Noncardiac | 18 (2.0%) | 6 (1.5%) | 8 (2.2%) | 4 (2.9%) | 0.28 | 6 (1.4%) | 12 (2.6%) | 0.21 |
| Any cause | 30 (3.3%) | 8 (2.0%) | 15 (4.2%) | 7 (5.0%) | 0.04 | 7 (1.6%) | 23 (4.9%) | 0.0083 |
| Myocardial infarction | 21 (2.3%) | 6 (1.5%) | 6 (1.7%) | 9 (6.5%) | 0.005 | 5 (1.2%) | 16 (3.4%) | 0.028 |
| Late revascularization | 7 (0.8%) | 0 (0%) | 2 (0.6%) | 5 (3.6%) | 0.0002 | 1 (0.2%) | 6 (1.3%) | 0.13 |
| Heart failure admission | 24 (2.7%) | 9 (2.2%) | 9 (2.5%) | 6 (4.3%) | 0.25 | 8 (1.9%) | 16 (3.4%) | 0.21 |
Values are n (%). Major adverse cardiac events consist of cardiac death, nonfatal myocardial infarction, late revascularization, and heart failure admission. Statistical significance was assessed using Cochran-Armitage trend test (coronary artery calcium [CAC]) and Fisher exact test (coronary flow reserve [CFR]).
Unadjusted Kaplan-Meier curves show that patients with CFR <2.0, the median value for this cohort, had a significantly higher event rate than those with CFR ≥2.0 (p < 0.0001). Similarly, patients with CAC ≥400 had a higher event rate than those with lower CAC scores (p = 0.002). After adjusting for clinical risk score, the similar trends were observed (Figs. 2A and 2B). Unadjusted annual MACE rate increased with increasing levels of coronary calcium (2.8, 4.5, and 8.9%/year, p = 0.005) and with reduced CFR (2.3 vs. 6.6%/year, p = 0.002). The observation of increased MACE rates with CFR <2.0 compared with ≥2.0 remained after adjustment for clinical risk (1.9 vs. 5.5%/year, p = 0.0007). In contrast, after adjustment for clinical risk, the association between CAC and MACE rates was only of borderline significance (3.1%, 3.4%, and 6.2%/year for CAC of 0, 1 to 399, and ≥400, respectively; p = 0.09). Comparison of MACE across CAC in 2 categories of <400 and ≥400 revealed a risk-adjusted hazard ratio of 1.8 (95% CI: 1.0 to 3.2) with borderline significant (p = 0.04).
Figure 2. Event-Free Survival by CFR and Extent of Coronary Calcification.

Adjusted survival probabilities by coronary flow reserve (CFR) (A) and categories of coronary artery calcium (CAC) score (B). After adjusting for clinical risk, patients with CFR <2.0 had a significantly higher event rate than those with CFR ≥2.0 (A). Likewise, patients with CAC ≥400 had a higher event rate than those with lower CAC score (B). CI = confidence interval; HR = hazard ratio; MACE = major adverse cardiac event(s).
When considering both CAC and CFR, annual MACE rates were increased in the presence of impaired CFR at any level of CAC score (p = 0.002), including among patients with a CAC score of 0 (risk ratio: 3.6; 95% CI: 1.2 to 11.4; p = 0.03). After adjustment for clinical risk score, similar relationships between CFR and MACE were demonstrated (Fig. 3), although the relationship between CAC and MACE rates was no longer significant.
Figure 3. Annualized MACE by Extent of Coronary Calcification and Flow Reserve.
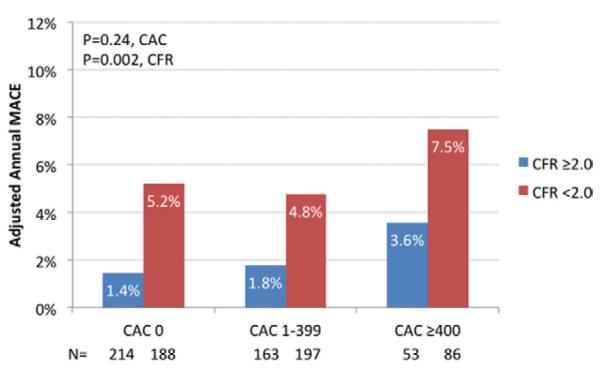
Risk-adjusted annual MACE rates by CFR (below and above 2.0) and CAC score (0, 1 to 399, and ≥400) categories. MACE were greatest among patients with high CAC and decreased CFR. Interestingly, the rate of MACE increased in the presence of impaired CFR even among patients with CAC = 0 although CAC was not significantly associated with increased MACE rates. Abbreviations as in Figure 2.
Multivariable modeling
A series of multivariable models were constructed to assess the incremental value of CFR after adjustment for clinical risk (Table 4). These models demonstrated that CFR added incremental prognostic information over the pre-imaging model with improvements in global chi-square test, Akaike information criterion, and c-index. Addition of CAC to clinical risk resulted in modest improvement in the model fit, which was significant by global chi-square test but not Akaike information criterion, and did not improve the c-index, a measure of risk discrimination. The 2 measures combined added incremental prognostic information over clinical risk and CAC alone but not over clinical risk and CFR alone (Table 4). Addition of a CAC*CFR interaction term to the final model (clinical risk, CAC, and CFR) did not improve global chi-square test (p = 0.28). In addition to the primary analysis using CAC and CFR as log-transformed continuous predictors, we also performed additional analyses of the data using 2 binary thresholds of CAC score: CAC 0 versus any CAC (CAC ≥1), and CAC <400 versus ≥400, and 3 categories of CAC score (0, 1 to 399, and ≥400). We found that neither a binary threshold of CAC ≥1 (vs. CAC= 0) nor the 3 categories of CAC (0, 1 to 399, ≥400) significantly improved model fit beyond clinical risk alone. However, a binary threshold of CAC ≥400 (vs. CAC <400) added incremental prognostic value to clinical risk alone but not to clinical risk + CFR (Online Tables 1 and 2). In order to evaluate the robustness of the results given 7.9% of patients had incomplete follow-up, a sensitivity analysis was also performed and yielded nearly identical results (Online Table 3).
Table 4.
Multivariable Survival Analysis
| Model |
||||||||||||
|---|---|---|---|---|---|---|---|---|---|---|---|---|
| Model 1: Clinical Risk Score* | Model 2: Clinical Risk Score + CAC | Model 3: Clinical Risk Score + CFR | Model 5: Clinical Risk Score + CAC + CFR | |||||||||
| Fit Statistic |
HR | p Value | Fit Statistic |
HR | p Value | Fit Statistic |
HR | p Value | Fit Statistic |
HR | p Value | |
| Global chi-square test |
19.0 | ref | 24.4 | 0.02 | 44.5 | <0.0001 | 46.7 | <0.0001 (vs. model 1) <0.0001 (vs. model 2) 0.14 (vs. model 3) |
||||
| AIC | 588.6 | ref | 585.1 | 0.06 | 565.1 | <0.0001 | 564.9 | <0.0001 (vs. model 1) <0.0001 (vs. model 2) 0.63 (vs. model 3) |
||||
| c-index | 0.632 (0.550–0.714) | ref | 0.644(0.561–0.728) | 0.58 | 0.719 (0.647–0.791) | 0.004 | 0.719(0.651–0.788) | 0.002 (vs. model 1) 0.01 (vs. model 2) 0.97 (vs. model 3) |
||||
| Duke clinical risk score (per 10%) |
1.06(1.03–1.10) | <0.0001 | 1.05 (1.02–1.08) | 0.003 | 1.06(1.03–1.10) | 0.0002 | 1.05 (1.02–1.09) | 0.004 | ||||
| CAC (per 2-fold increase) |
1.09 (1.01–1.17) | 0.02 | 1.06(0.98–1.13) | 0.14 | ||||||||
| CFR (per 10% increase) |
0.82 (0.76–0.89) | <0.0001 | 0.83(0.76–0.89) | <0.0001 | ||||||||
A log transformation of the Duke clinical risk score, CFR and CAC + 1 were used for the analyses to adjust for the rightward skew of the data and to reduce heteroscedasticity. Global chi-square test indicated likelihood ratio chi-square statistic for the entire model. p Values for model fit statistics (i.e., global chi-square test, AIC and c-index) are for comparisons with model 1, unless specified. C-indices are calculated for 3-year event date.
The components to calculate Duke clinical risk score consist of age, sex, typical angina, atypical angina, history of myocardial infarction, ECG Q-wave, ECG ST-T wave changes, smoking, dyslipidemia, diabetes, age by sex, history of myocardial infarction by electrocardiogram Q-wave, age by sex, age by dyslipidemia, and sex by smoking (interaction) (11).
AIC = Akaike information criterion; other abbreviations as in Table 3.
Reclassification and discrimination
In the entire cohort, 24%, 43.6%, and 45.7% of patients were reclassified by CAC, CFR, and the combination of CAC and CFR, respectively (Online Table 4). Accounting for incorrect reclassifications, addition of CAC did not result in significant favorable net reclassification (net reclassification index [NRI] [2.6%]: 0.141; 95% CI: −0.003 to 0.286) (Online Table 5). In contrast, CFR significantly improved net risk reclassification (NRI [2.6%]: 0.280; 95% CI: 0.048 to 0.502).
Among the 51% of patients at intermediate pre-test risk based on the Duke clinical risk score, addition of CFR resulted in highly effective risk reclassification (NRI [2.6%]: 0.569; 95% CI: 0.326 to 0.807). In contrast, addition of CAC did not result in significant reclassification improvement (NRI [2.6%]: 0.168; 95% CI: −0.028 to 0.394).
Discussion
We found that among symptomatic patients without obstructive CAD, although both the extent of coronary calcium deposits and the presence of coronary vascular dysfunction are associated with increased risk of adverse cardiac events, after adjustment for clinical risk, only coronary vascular dysfunction improved risk assessment. In keeping with prior studies, the total burden of coronary calcium deposits was only modestly associated with impaired vascular function (23). More importantly, we observed that for any level of CAC score, the presence of abnormal CFR (reflecting the effect of diffuse atherosclerosis, as well as epicardial and microvascular dysfunction) was consistently associated with a higher rate of adverse cardiac events, even after adjusting for clinical risk. Indeed, even among patients with no CAC, impaired CFR was associated with higher rates of MACE (1.3% vs. 4.7%, p = 0.03). CFR helped reclassify risk in 44% of the entire cohort, with large net improvement in risk classification among those at intermediate clinical risk. In contrast, CAC did not result in improved risk assessment after accounting for clinical risk in these symptomatic patients with a high burden of risk factors. These results suggest that coronary vascular dysfunction, the earliest marker of atherosclerosis may be a more powerful and universal marker of risk of adverse cardiac outcomes.
We observed a wide dispersion of CFR values in each CAC score category. Although there was a stepwise increase in the frequency of decreased CFR with increasing CAC scores, this relationship was modest (Fig. 1). In our cohort of patients without obstructive CAD (all patients had normal PET scans), measures of coronary vasodilator function reflect the integrated effects of diffuse atherosclerosis and endothelial dysfunction. Consequently, CFR is a useful surrogate marker of disease activity in the coronary circulation that may reflect active pathophysiologic changes, which are more readily reversible with medical and lifestyle interventions than coronary calcifications. The scatter of coronary vasodilator reserve values in each CAC score category suggests that calcium deposits are not a complete reflection of overall disease activity within the coronary circulation. This is consistent with prior studies in asymptomatic cohorts (24,25). In a recent meta-analysis, circulating inflammatory biomarkers (including C-reactive protein, interleukin-6, fibrinogen, matrix metalloproteinase-9, monocyte chemoattractant protein-1, tumor necrosis factor-alpha, and others) were found to have only a weak association with the burden of coronary artery calcifications (24). Together, these findings may help explain the relatively low numbers of coronary events even among patients with high CAC scores (8,26). Our data support the hypothesis that direct measures of coronary vasodilator function (more closely reflecting disease activity) may be more powerful measures of CAD risk than simply the total burden of calcified atherosclerosis.
Study limitations
First, this study was performed in a single referral center and may reflect referral bias. However, this cohort may more closely reflect patients with suspected coronary disease seen in practice than those selected for prospective studies. Second, physicians were aware of the CAC, but not of CFR, which may attenuate the predictive value of CAC for cardiac events due to resultant changes in medical therapy. Third, the number of events was limited and the follow-up period relatively short. Fourth, the PET/CT studies were all performed for clinical indications, largely for evaluation of symptoms. As such the relative prognostic value of CAC and CFR in asymptomatic patients was not assessed in the present study. Fifth, abnormal CFR, while most likely representing microvascular dysfunction or diffuse atherosclerosis in our study because all patients had normal MPI images, could also be a marker for epicardial obstructive disease in rare cases of balanced reduction in blood flow.
Conclusions
Coronary vasomotor dysfunction, the earliest manifestation of atherosclerosis, may be a more powerful marker of cardiac risk than the total burden of calcified atherosclerosis, a late marker of plaque rupture and healing, among symptomatic patients without obstructive CAD. For any level of severity of coronary artery calcification, impaired CFR consistently identified patients at higher short-term risk of adverse cardiac events. These results suggest that direct measures of coronary vascular function, reflecting disease activity in the coronary circulation, may improve phenotypic characterization of atherosclerosis and result in enhanced risk stratification and prediction of cardiovascular events among symptomatic patients.
Supplementary Material
Acknowledgments
The study was funded in part by grants from the U.S. National Institutes of Health (RC1 HL101060-01, T32 HL094301-01A1, and 5K23HL092299-03), and by the Society of Nuclear Medicine Wagner-Torizuka Fellowship Award (to Dr. Naya). Dr. Murthy owns equity in General Electric. Dr. Dorbala receives research grant support from Astellas Global Pharma Development and Bracco Diagnostics. Dr. Di Carli receives research grant support from Toshiba.
Abbreviations and Acronyms
- CAC
coronary artery calcium
- CAD
coronary artery disease
- CI
confidence interval
- CFR
coronary flow reserve
- CT
computed tomography
- MACE
major adverse cardiac event(s)
- MBF
myocardial blood flow
- MPI
myocardial perfusion imaging
- NRI
net reclassification index
- PET
positron emission tomography
Footnotes
All other authors have reported that they have no relationships relevant to the contents of this paper to disclose.
APPENDIX For expanded Methods and Results sections as well as additional tables, please see the online version of this article.
REFERENCES
- 1.Rumberger JA, Simons DB, Fitzpatrick LA, Sheedy PF, Schwartz RS. Coronary artery calcium area by electron-beam computed tomography and coronary atherosclerotic plaque area. A histopathologic correlative study. Circulation. 1995;92:2157–62. doi: 10.1161/01.cir.92.8.2157. [DOI] [PubMed] [Google Scholar]
- 2.Rumberger JA, Schwartz RS, Simons DB, Sheedy PF, 3rd, Edwards WD, Fitzpatrick LA. Relation of coronary calcium determined by electron beam computed tomography and lumen narrowing determined by autopsy. Am J Cardiol. 1994;73:1169–73. doi: 10.1016/0002-9149(94)90176-7. [DOI] [PubMed] [Google Scholar]
- 3.Greenland P, LaBree L, Azen SP, Doherty TM, Detrano RC. Coronary artery calcium score combined with framingham score for risk prediction in asymptomatic individuals. JAMA. 2004;291:210–5. doi: 10.1001/jama.291.2.210. [DOI] [PubMed] [Google Scholar]
- 4.Burke AP, Kolodgie FD, Farb A, et al. Healed plaque ruptures and sudden coronary death: evidence that subclinical rupture has a role in plaque progression. Circulation. 2001;103:934–40. doi: 10.1161/01.cir.103.7.934. [DOI] [PubMed] [Google Scholar]
- 5.Arad Y, Spadaro LA, Roth M, Newstein D, Guerci AD. Treatment of asymptomatic adults with elevated coronary calcium scores with atorvastatin, vitamin C, and vitamin E: the St. Francis Heart Study Randomized Clinical Trial. J Am Coll Cardiol. 2005;46:166–72. doi: 10.1016/j.jacc.2005.02.089. [DOI] [PubMed] [Google Scholar]
- 6.Taylor AJ, Bindeman J, Feuerstein I, Cao F, Brazaitis M, O’Malley PG. Coronary calcium independently predicts incident premature coronary heart disease over measured cardiovascular risk factors: mean three-year outcomes in the Prospective Army Coronary Calcium (PACC) project. J Am Coll Cardiol. 2005;46:807–14. doi: 10.1016/j.jacc.2005.05.049. [DOI] [PubMed] [Google Scholar]
- 7.Vliegenthart R, Oudkerk M, Hofman A, et al. Coronary calcification improves cardiovascular risk prediction in the elderly. Circulation. 2005;112:572–7. doi: 10.1161/CIRCULATIONAHA.104.488916. [DOI] [PubMed] [Google Scholar]
- 8.Detrano R, Guerci AD, Carr JJ, et al. Coronary calcium as a predictor of coronary events in four racial or ethnic groups. N Engl J Med. 2008;358:1336–45. doi: 10.1056/NEJMoa072100. [DOI] [PubMed] [Google Scholar]
- 9.Burke AP, Weber DK, Kolodgie FD, Farb A, Taylor AJ, Virmani R. Pathophysiology of calcium deposition in coronary arteries. Herz. 2001;26:239–44. doi: 10.1007/pl00002026. [DOI] [PubMed] [Google Scholar]
- 10.Agatston AS, Janowitz WR, Hildner FJ, Zusmer NR, Viamonte M, Jr., Detrano R. Quantification of coronary artery calcium using ultrafast computed tomography. J Am Coll Cardiol. 1990;15:827–32. doi: 10.1016/0735-1097(90)90282-t. [DOI] [PubMed] [Google Scholar]
- 11.Pryor DB, Shaw L, McCants CB, et al. Value of the history and physical in identifying patients at increased risk for coronary artery disease. Ann Intern Med. 1993;118:81–90. doi: 10.7326/0003-4819-118-2-199301150-00001. [DOI] [PubMed] [Google Scholar]
- 12.Naya M, Murthy VL, Blankstein R, et al. Quantitative relationship between the extent and morphology of coronary atherosclerotic plaque and down-stream myocardial perfusion. J Am Coll Cardiol. 2011;58:1807–16. doi: 10.1016/j.jacc.2011.06.051. [DOI] [PMC free article] [PubMed] [Google Scholar]
- 13.El Fakhri G, Sitek A, Guerin B, Kijewski MF, Di Carli MF, Moore SC. Quantitative dynamic cardiac 82rb pet using generalized factor and compartment analyses. J Nucl Med. 2005;46:1264–71. [PubMed] [Google Scholar]
- 14.Murthy VL, Naya M, Foster CR, et al. Improved cardiac risk assessment with noninvasive measures of coronary flow reserve. Circulation. 2011;124:2215–24. doi: 10.1161/CIRCULATIONAHA.111.050427. [DOI] [PMC free article] [PubMed] [Google Scholar]
- 15.Thygesen K, Alpert JS, White HD, et al. Universal definition of myocardial infarction. Circulation. 2007;116:2634–53. doi: 10.1161/CIRCULATIONAHA.107.187397. [DOI] [PubMed] [Google Scholar]
- 16.Nieto FJ, Coresh J. Adjusting survival curves for confounders: a review and a new method. Am J Epidemiol. 1996;143:1059–68. doi: 10.1093/oxfordjournals.aje.a008670. [DOI] [PubMed] [Google Scholar]
- 17.Pencina MJ, D’Agostino RB. Overall c as a measure of discrimination in survival analysis: Model specific population value and confidence interval estimation. Stat Med. 2004;23:2109–23. doi: 10.1002/sim.1802. [DOI] [PubMed] [Google Scholar]
- 18.Antolini L, Nam B-H, D’Agostino RB. Inference on correlated discrimination measures in survival analysis: a nonparametric approach. Commun Stat. 2004;33:2117–35. [Google Scholar]
- 19.Pencina MJ, D’Agostino RB, Sr., D’gostino RB, Jr., Vasan RS. Evaluating the added predictive ability of a new marker: from area under the roc curve to reclassification and beyond. Stat Med. 2008;27:157–72. doi: 10.1002/sim.2929. discussion 207–12. [DOI] [PubMed] [Google Scholar]
- 20.Steyerberg EW, Pencina MJ. Reclassification calculations for persons with incomplete follow-up. Ann Intern Med. 2010;152:195–6. doi: 10.7326/0003-4819-152-3-201002020-00019. author reply 196–7. [DOI] [PubMed] [Google Scholar]
- 21.Gibbons RJ, Chatterjee K, Daley J, et al. ACC/AHA/ACP-ASIM guidelines for the management of patients with chronic stable angina: a report of the american college of cardiology/american heart association task force on practice guidelines (committee on management of patients with chronic stable angina) J Am Coll Cardiol. 1999;33:2092–197. doi: 10.1016/s0735-1097(99)00150-3. [DOI] [PubMed] [Google Scholar]
- 22.Schenker MP, Dorbala S, Hong EC, et al. Interrelation of coronary calcification, myocardial ischemia, and outcomes in patients with intermediate likelihood of coronary artery disease: a combined positron emission tomography/computed tomography study. Circulation. 2008;117:1693–700. doi: 10.1161/CIRCULATIONAHA.107.717512. [DOI] [PMC free article] [PubMed] [Google Scholar]
- 23.Curillova Z, Yaman BF, Dorbala S, et al. Quantitative relationship between coronary calcium content and coronary flow reserve as assessed by integrated PET/CT imaging. Eur J Nucl Med Mol Imaging. 2009;36:1603–10. doi: 10.1007/s00259-009-1121-1. [DOI] [PMC free article] [PubMed] [Google Scholar]
- 24.Hamirani YS, Pandey S, Rivera JJ, et al. Markers of inflammation and coronary artery calcification: a systematic review. Atherosclerosis. 2008;201:1–7. doi: 10.1016/j.atherosclerosis.2008.04.045. [DOI] [PubMed] [Google Scholar]
- 25.Jenny NS, Brown ER, Detrano R, et al. Associations of inflammatory markers with coronary artery calcification: results from the Multi-Ethnic Study of Atherosclerosis. Atherosclerosis. 2010;209:226–9. doi: 10.1016/j.atherosclerosis.2009.08.037. [DOI] [PMC free article] [PubMed] [Google Scholar]
- 26.Schepis T, Gaemperli O, Koepfli P, et al. Added value of coronary artery calcium score as an adjunct to gated spect for the evaluation of coronary artery disease in an intermediate-risk population. J Nucl Med. 2007;48:1424–30. doi: 10.2967/jnumed.107.040758. [DOI] [PubMed] [Google Scholar]
Associated Data
This section collects any data citations, data availability statements, or supplementary materials included in this article.