Abstract
To date, the dependent nature of the recognition and transduction mechanisms in optical glucose sensors based upon Concanavalin A (ConA) has tended to prevent the sensors’ full potential from being realized. In this paper, these mechanisms are independently optimized for a given assay configuration in order to decrease the predictive error of a ConA-based glucose sensor and to give a more accurate demonstration of its potential. To this end, we used fluorescence anisotropy as the transduction mechanism to determine the binding of ConA to 4 kDa FITC-dextran by measuring the change in the rotational correlation lifetime between the bound and unbound populations. By tracking the fluorescence anisotropy of this ligand, the ranges of ConA and 4 kDa FITC-dextran concentrations capable of being explored were not limited by the transduction mechanism. Using predetermined association constants, the binding responses to physiological glucose concentrations were predicted for different assay configurations, and experimentally collected fluorescence anisotropy data displayed the predicted trends for these assay configurations. From the experimental results, a calibration fit was generated for the optimized assay configuration to predict the glucose concentrations using the fluorescence anisotropy. This optimized assay displayed a mean standard error of prediction of 7.5 mg/dL (0–300 mg/dL), and 100% of the data points fell within clinically acceptable zones (A and B) upon the Clarke Error Grid Analysis. This indicates that, by independently optimizing the recognition and transduction mechanisms for the final assay configuration, the sensitivity of a competitive binding chemistry using ConA can be appropriately configured for continuous glucose monitoring applications.
Keywords: biosensors, fluorescence anisotropy, competitive binding, glucose sensing
1. INTRODUCTION
Competitive binding assays with ConA as the receptor have been developed over the years as potential solutions for continuous glucose monitoring applications [1]. Fluorescence assays have been proposed to be encapsulated inside microspheres or fibers, embedded within the dermis, and optically interrogated from the surface of the skin [2, 3]. Unlike proteins such as hexokinase and glucose binding protein, ConA does not undergo a measurable conformational change upon its binding to glucose [4, 5]. Instead, ConA-based sensors typically track the glucose concentration by following the inhibition the sugar has on the binding between the lectin and a competing ligand (CL). As the assay is exposed to increasing glucose concentrations, the concentration of the ConA-CL complex decreases, which can be transduced via fluorescence. Fluorescence approaches are either intensity-based or lifetime-based, in which the intensity-based approaches described in the literature typically use a ratiometric technique based upon Förster Resonance Energy Transfer (FRET) [6–8].
For a ConA-based assay with given association constants for the CL and the inhibiting glucose, there exists an ideal set of concentrations of ConA and CL at which the greatest change in binding will occur across the physiologically-relevant glucose range. However, the typical transduction mechanism of FRET requires the concentrations of the fluorescently labeled ConA and the fluorescently labeled CL to be on the same order to avoid significant amounts of non-specific absorption/quenching and spectral bleed-through by the FRET acceptor. This coupling of the transduction and recognition mechanism makes FRET a non-ideal technique to study the binding profile at the full range of assay concentrations. Therefore, unless the association constant between the ConA and the CL is already tuned, the experimentally observed FRET response will not display the full-potential of the assay at the configuration that maximizes binding.
ConA-based assays have typically been generated by developing a unique CL and recording the FRET response of various ConA and CL concentrations against physiological concentrations of glucose. The concentration pair that elicits the greatest change in the measurable signal is identified as the optimized sensing assay. Because this measured signal is effectively the convolution of the recognition and transduction mechanisms, the sensor’s response can misrepresent the full potential ConA has towards continuous glucose monitoring applications if both mechanisms are not optimized for the final assay configuration.
Unlike FRET, fluorescence anisotropy (FA) is a polarization-based approach. While it would likely be unsuitable to be used in an implantable ConA glucose-sensor because of the highly depolarizing scatter from the tissue, it can be used as a transduction mechanism to characterize the capability of a ConA-based glucose sensor as long as the environment is low in scattering and the size of the CL is relatively small (Figure 1). Specifically, because FA requires only one labeled population, it can allow for both mechanisms to be fully optimized for a given assay configuration. Thus, the technique offers the user the capability of exploring a wider range of concentrations for a given set of association constants without the aforementioned transduction/recognition coupling concerns. By decoupling and independently optimizing these two mechanisms, it is possible for the sensitivity of the assay towards glucose to be enhanced and the true capability of ConA to be realized.
Figure 1.
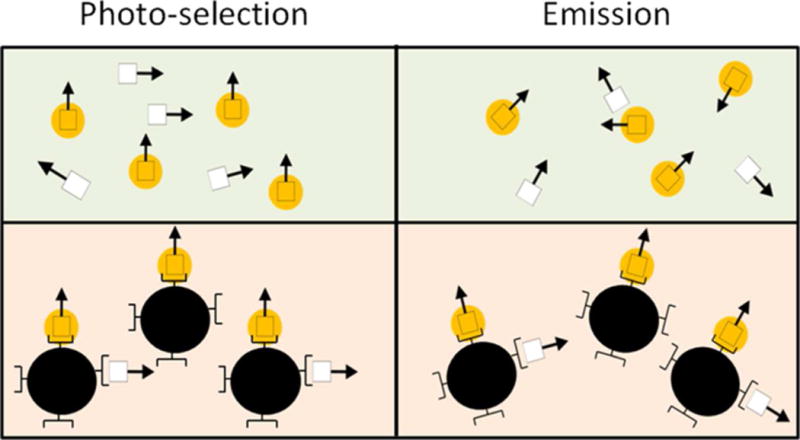
Representation of FA. Vertically polarized excitation light selectively excites the fluorophores in the appropriate orientation. Prior to the emission of a photon, the molecule rotates according to its size. Because larger molecules tumble more slowly, fluorescently labeled ligands that are bound display a higher FA. The bottom population displays a higher FA than the top. (White square: fluorescently labeled ligand, arrow: direction of the fluorophore’s dipole, yellow circle: excited fluorophore, dark circle: receptor)
In this paper, a systematically optimized ConA-based glucose sensing assay is demonstrated, and FA is presented as an ideal mechanism to characterize the assay prior to implantation. Theoretical descriptions for FA and competitive binding are introduced and each mechanism for this given sensing assay is optimized, displaying the potential of an optimized ConA-based assay towards continuous glucose monitoring.
1.1. Fluorescence Anisotropy
FA has been extensively used within the field of biochemistry to explore molecular interactions [9]. More specifically to this work, FA has been used as a transduction technique in the field of glycobiology to determine association and inhibition constants for various sugars [10–12]. These assays have recently been complemented with high throughput glycan arrays to allow for the quick determination of interactions between a receptor and a diverse set of glycans [13–15]. FA remains a powerful spectroscopic technique to transduce events occurring on the molecular level.
Briefly, FA is a homogeneous and reproducible method that can be used to explore the average rotational diffusion rate of a system comprised of randomly configured fluorescent molecules. By interrogating the system with plane polarized excitation light, information can be retrieved from the polarization of the fluorescence. In practice, the polarized fluorescence intensity is measured in the parallel (F‖) and perpendicular (F‖) directions (defined by the excitation polarization), and FA is calculated as shown in Equation 1. Theoretically, FA (r) can exist from −0.5 to 1, but these limits are only reached when all dipoles are aligned upon photo-selection. In the cases where dipoles are randomly oriented when photo-selection occurs, the limits of FA are −0.2 to 0.4.
| (Eq. 1) |
Because excited fluorophores have an intrinsic lifetime, the steady state FA can be correlated to the average degree of molecular rotation. The relationship between the fluorescence lifetime and the rotational correlation lifetime of a sample of labeled molecules in FA systems has been described using Perrin’s equation (Equation 2). The value ro is the intrinsic anisotropy value for a given fluorophore, τ is the fluorescence lifetime of the fluorophore, and φ is the rotational correlation lifetime of the fluorophore. For a spherical particle, the rotational correlation lifetime is defined in Equation 3 (M: molecular weight, T: temperature in Kelvin, R: universal gas constant, n: viscosity, v: partial specific volume, h: degree of hydration).
| (Eq. 2) |
| (Eq. 3) |
Therefore, in order to create a FA assay based on competitive binding, the FA will effectively track the changes in the average molecular weight (M) of the fluorescently labeled complexes. As seen in Equation 4, the experimentally observed FA (<r>) corresponds to the linear summation of fluorescent populations with unique FA values (ri) with regard to their fractional contributions of the total intensity measured (fi). Therefore, by using a labeled CL with a low molecular weight and a receptor with a high molecular weight, the degree of binding can be tracked via FA. This work combines this FA technique with a competitive binding chemistry based on the protein receptor, ConA, to predict glucose concentrations.
| (Eq. 4) |
1.2 Competitive Binding Assay
ConA is a c-type lectin that has been used in glucose sensitive competitive binding assays, specifically with dextran [6–8]. Existing as a tetramer at physiological pH, native ConA has a molecular weight of 104 kDa and binds to carbohydrate moieties found in glycoproteins, glycolipids and various sugars in the presence of certain divalent cations. Each monomeric subunit is approximately 4 × 4 × 4 nm and contains a single site capable of binding glucose and mannose monosaccharides with unmodified hydroxyls at positions C3, C4, and C6. The centers of the binding sites have been shown to be approximately 6.5 nm apart [16]. The association constant of tetrameric ConA to glucose and methyl alpha-mannose has been shown to be 400 M−1 and 8,200 M−1, respectively [1, 17].
Studies have also shown that ConA can bind to oligosaccharides and glycoconjugates bearing glucosyl and mannosyl residues with unmodified C3, C4, and C6 hydroxyls [18–20]. Dextrans are polysaccharides of glucose and are primarily comprised of α-1,6 glycosidic linkages with branches formed by α-1,3 linkages [21]. Due to this branching, dextrans can have many glucosyl residues with the appropriate unmodified hydroxyls at the dextran’s non-reducing termini. As a result, dextrans can display a higher affinity to ConA than their monomeric subunit D-glucose and this affinity increases for larger molecular weight dextrans [22].
The work in this paper presents a competitive binding FA glucose sensor based on fluorescently labeled dextran and unlabeled ConA. This was done by choosing optimal chemistry components that maximize the change in the FA value of bound and unbound populations according to FA modeling. We chose the labeled ligand for this work to be 4 kDa FITC-dextran because of its ideal combination of intrinsic anisotropy, fluorescence lifetime, molecular weight, and association constant to ConA. The optimal concentrations of competitive binding components were chosen to maximize the change in percent of labeled dextran bound to ConA according to competitive binding modeling. The FA glucose responses were predicted by combining the FA and competitive binding models and then tested in TRIS buffer against relevant glucose concentrations. Data was collected to generate a calibration curve, and the predictive ability was displayed through the assay’s standard error of prediction and the Clarke Error Grid Analysis. Ultimately this work results in an optimized competitive binding sensor based on ConA and displays the potential for an implantable fluorescence sensor to be based on a competitive binding assay using ConA.
2. MATERIALS & METHODS
2.1 Materials
ConA (Type IV) and 4 kDa FITC-dextran were purchased from Sigma Aldrich. TRIS buffered saline (TBS) was synthesized using 0.15 M sodium chloride, 0.01 M TRIS-HCl, 1 mM calcium chloride, and 1 mM manganese chloride at pH 7.4 to mimic physiological interstitial fluids and to allow for proper binding of the lectin.
2.2 FA Modeling
To identify a fluorescently labeled CL to transduce the equilibrium binding, Perrin’s equation (Eq. 2) was modeled for a range of possible molecular weights and fluorescence lifetimes. The goal of this model is to identify ligands that can be paired with native ConA to display an observable change in FA between the bound and unbound states. Possible fluorophores and their associated lifetimes included Alexa Fluor 647 (~1 ns), fluorescein (~4 ns), dansyl chloride (~20 ns) and ruthenium (~300 ns). For each of these fluorophores, the FA was modeled for a range of molecular weights (4–200 kDa), and the expected bound/unbound FA values for specific fluorescently labeled dextrans are shown. This model assumes that (1) the local mobility of the fluorophore is negligible, (2) the dextran molecule is effectively spherical, and (3) the dextran/ConA complex is effectively rigid and spherical.
2.3 Competitive Binding Modeling
After determining which fluorescently labeled CL optimizes the transduction mechanism, competitive binding modeling was performed to determine the concentrations of ConA and dextran that maximized the recognition sensitivity of the sensor for relevant glucose concentrations. This was done by predicting the equilibrium binding for a given assay to a range of physiological glucose concentrations. By assuming the fluorescence properties of the labeled CL to be independent of the binding state, the percent of the total fluorescence from the bound/free state is equivalent to the percent of labeled CL that is bound/free. Therefore, the fraction of labeled CL that was bound to ConA (% CLB) was investigated, as this corresponds to the fluorescence intensity displaying the bound FA. The remaining fraction of the labeled CL corresponds to the fraction of the fluorescence intensity displaying the unbound FA. For our studies, the sensitivity of recognition is defined as the absolute change in the % CLB across the physiologically-relevant glucose concentrations (0–300 mg/dL).
The exact solution to Equations 5–7, as described by Wang, was used to solve for the % CLB as a function of the labeled dextran, ConA, glucose concentrations, and association constants [23]. In these equations [Ct], [CG], [Cf], [CD], [Dt], [Df], [Gt], and [Gf] are defined as the concentrations of total ConA, ConA bound to glucose, free ConA, ConA bound to dextran, total dextran, free dextran, total glucose, and free glucose, respectively. The association constants relate the free and bound concentrations (e.g. KCD = [CD]/([Cf]*[Df])).
| (Eq. 5) |
| (Eq. 6) |
| (Eq. 7) |
2.4 Combined Model and Experimental Assay
For several assay configurations, the expected FA vs glucose responses were modeled for glucose concentrations (0–500 mg/dL) with Equation 4. These responses were calculated by using the FAi and fi values that were previously predicted. The FAi from Equation 4 was replaced by the FAbound and FAunbound for 4 kDa FITC-dextran populations from Table 1. The fi in Equation 4 was replaced by the appropriate % CLB value as predicted by the competitive binding modeling. Because the % CLB is a function of glucose, the observed FA is dependent on glucose concentration in the system.
Table 1.
Modeled Bound and Unbound FA values at 293 K in water
| Competitive Ligand (CL) | FAunbound | FAbound to ConA |
|---|---|---|
| 4 kDa AF 647-dextran | 0.303 | 0.395 |
| 4 kDa FITC-dextran | 0.175 | 0.382 |
| 10 kDa FITC-dextran | 0.264 | 0.383 |
| 70 kDa FITC-dextran | 0.373 | 0.389 |
| 4 kDa Dansyl Chloride-dextran | 0.054 | 0.323 |
| 4 kDa Ruthenium-dextran | 0.004 | 0.088 |
The actual FA response to glucose concentrations (0–500 mg/dL, 50 mg/dL steps) for each of these assay configurations was determined experimentally. All fluorescence measurements were obtained using black, flat-bottom, 96-well plates on a microplate reader (Tecan model F200) equipped with bandpass excitation filters (483 ±15.5 nm), emission filters (540 ± 25 nm) and polarizers (Tecan). The G-factor was calculated using a known FA value for 1 nM fluorescein (0.018), and all subsequent runs used this adjustment factor to yield corrected data.
Highly concentrated stock solutions of the individual assay components were prepared using TBS. Plates were quadruplicate loaded with the assay components, including glucose, and given time to reach equilibrium prior to analyzing in the plate reader at room temperature. The actual glucose concentration was defined to be the prepared concentration. Triplicate fluorescence scans were collected from each well of the microplate in the parallel and perpendicular directions. The actual FA value for each well was calculated by subtracting the blank TBS background from each measurement, accounting for the differences in detector sensitivity to polarized light with the G-factor, and solving for FA with Equation 1.
3. RESULTS & DISCUSSION
3.1 Fluorescence Anisotropy
The FA value was predicted for a range of fluorescent complexes according to their molecular weight and fluorescence lifetime by modeling Perrin’s equation (Eq. 2) for spherical particles (ro = 0.4, T = 293 K, n= 0.01 cP, ν= 0.73 cm3/g, h = 1.17 ml/mg, and R = 8.321*107 erg/K·mol). Table 1 shows the expected FA values for different fluorescent ligands bound and unbound to ConA. The FA vs. molecular weight relationship for each fluorophore (Alexa Fluor 647, fluorescein, dansyl chloride, and ruthenium) is shown in the supplementary information.
Ultimately, the observed FA response will correspond to the proportional summation of the bound and unbound FA values according to their glucose-dependent populations. The sensitivity of this system is dependent on the absolute change in the FA value upon binding. Therefore, to optimize the fluorescent transduction mechanism, this difference needs to be maximized. Table 1 shows that the FA of AF 647 is relatively constant at the high end of the possible FA range, suggesting that its lifetime is too short to allow the glucose-response to be observable via FA. The fluorophore is expected to fluoresce prior to significant rotation of the ligand in both the bound and unbound states. The ruthenium-based fluorophore also appears to be unsuitable to track the competitive binding; it appears to lose most of the anisotropy information before it fluoresces regardless of whether it is bound.
On the other hand, the 4 kDa FITC-dextran and the 4 kDa dansyl chloride dextran appear suitable, showing a FA difference of 0.207 and 0.269 between bound/unbound states, respectively. However, dansyl chloride is an environmentally sensitive fluorophore that could increase its fluorescence intensity when brought close to hydrophobic residues upon dextran’s binding to ConA. FITC is insensitive to the environment’s polarity, but is known to be pH sensitive due to its carboxyl and phenol groups. Fluctuations in pH can be minimized by using TBS at pH 7.4. Thus, 4 kDa FITC-dextran was chosen as the fluorescent competitor for this work as it should generate a suitable change in FA and is commercially available.
Dextrans with increasing molecular weights were also explored, but the difference in FA upon binding is shown to decrease with increasing size of the CL. Ligands smaller than 4kDa dextran would increase the predicted difference further; however, the association constant would decrease to a level that is unsuitable for competitive binding.
3.2 Competitive Binding
Competitive binding elicits unique bound and unbound populations according to the concentration of the analyte of interest. As previously noted, the % CLB is assumed to be equivalent to fi from Equation 4 in this work. To maximize the recognition sensitivity of the FA assay, the absolute change in % CLB must be maximized across the desired glucose range. Assuming typical branching seen in dextrans, 4 kDa dextran should have ~3 non-reducing termini per dextran molecule and the effective affinity of ConA to the 4 kDa dextran should be ~5000 M−1. Using association constants for ConA to glucose and 4 kDa FITC-dextran to be 400 M−1 and 5000 M−1 (respectively), glucose-dependent competitive binding responses were modeled for given ConA ([ConA]) and 4 kDa FITC-dextran concentrations ([D]) [1, 22]. Figure 2 shows examples of predicted glucose responses for various assay configurations.
Figure 2.
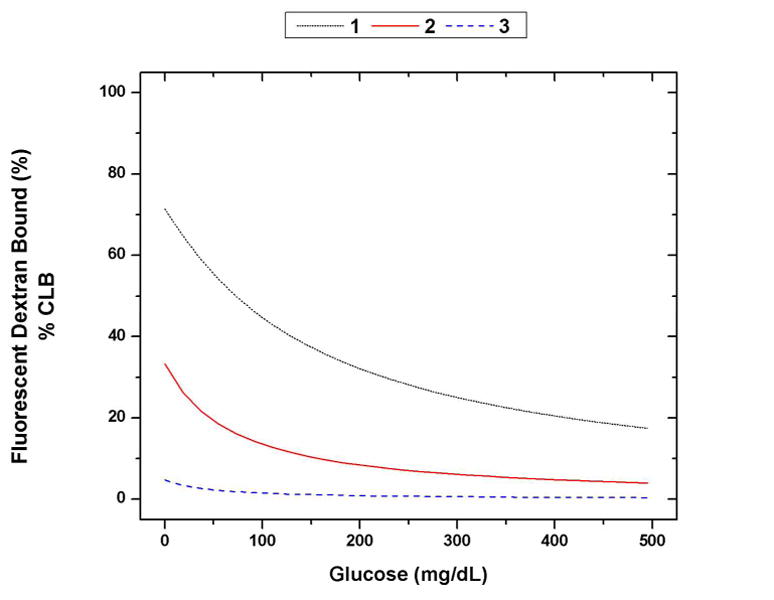
Modeled responses of fluorescent dextran bound (% CLB) versus glucose for different assay configurations: (1) 500 μM ConA, 1 μM dextran, (2) 100 μM ConA, 1 μM dextran, (3) 10 μM ConA, 1 μM dextran. The change in % CLB from 0 mg/dL to 300 mg/dL for 1, 2, and 3 is 45%, 27%, and 4%, respectively.
A figure of merit was defined for the glucose response of a given assay configuration to systematically choose the most effective combination of [ConA] and [D]. For our purposes, this figure of merit was defined as the change in the % CLB between 0 mg/dL and 300 mg/dL glucose for a given assay configuration. This is a measure of the expected recognition sensitivity of the assay. The curves in Figure 2 show changes in % CLB of 45%, 27%, and 4%. The assay that shows a greater change in % CLB should display a greater sensitivity in the final assay.
The change in % CLB was determined from the glucose response of all possible combinations of dextran (10 nM–100 mM) and ConA (10 nM–100 mM), and shown in Figure 3. The greater the change in the % CLB indicates a greater recognition sensitivity for the given assay configuration. Figure 3 shows that the change in % CLB between 0 mg/dL and 300 mg/dL glucose is maximized at 45% for a ConA concentration of approximately 500 μM and dextran concentrations up to 100 μM.
Figure 3.
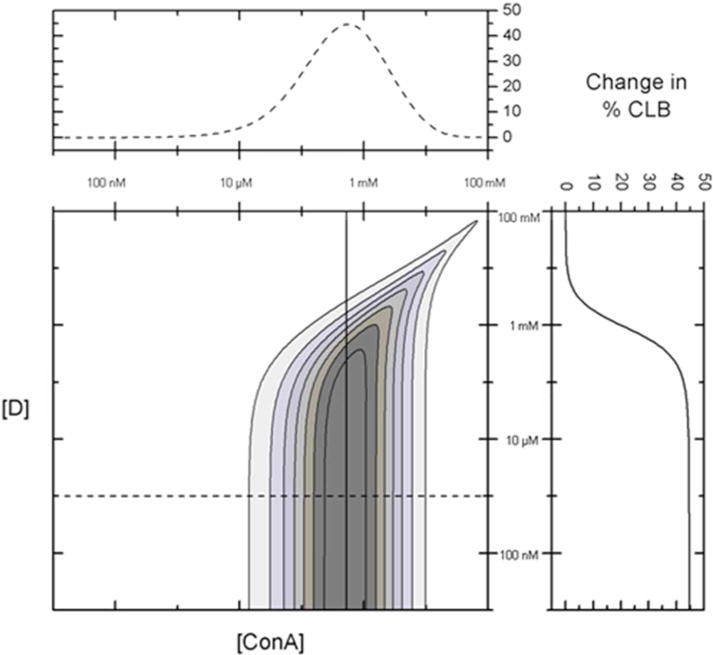
Change in % dextran bound to ConA (% CLB) from 0 mg/dL to 300 mg/dL glucose for various ConA and dextran (D) combinations. The change in % CLB to ConA is maximized at 45% for a ConA concentration of approximately 500 μM and dextran concentrations less than 100 μM. The inset to the top shows the change in % CLB vs [ConA] with [D] fixed at 1 μM (dotted line). The inset to the right shows the change in % CLB vs [D] with [ConA] fixed at 500 μM (solid line).
Dextran concentrations higher than 100 μM (for a fixed concentration of ConA at 500 μM) begin to show a decreased response to glucose because the % CLB at 0 mg/dL glucose begins to decrease. A similar response is observed using an optimized dextran concentration (1 μM) with concentrations of ConA significantly below 500 μM. For concentrations of ConA that are significantly higher than 500 μM ([dextran] at 1 μM), the addition of glucose to physiologically-relevant concentrations has little effect on the % CLB. Even after the binding of glucose, there is sufficient ConA available to bind the majority of the fluorescent dextran at these ConA concentrations.
Assay configurations that display similar changes in the % CLB across the physiologically-relevant glucose concentration range should also display similar changes in FA across that range. Therefore, we expect equivalent FA responses for the full range of optimized dextran concentrations. For experimental purposes, FITC-dextran concentrations of 100 nM and 1 μM were chosen to minimize inner filter effects and elicit sufficient signal.
To further show the effect that the concentrations of ConA and dextran have on the competitive binding response, the full responses (% CLB vs. glucose) were modeled for assays with various ConA concentrations (5 μM–100 mM) with the dextran concentration fixed at 100 nM and for assays with various dextran concentrations (100 Nm–10 mM) with the ConA concentration fixed at 500 μM. These responses are included in the supplemental information.
3.4 Predicted & Experimental Response
Using Equation 4, modeled FA responses were generated for specific assay configurations by implementing the % CLB from the modeled competitive binding curves and the bound/unbound FA values from Table 1. The assay configurations were chosen to display both optimized and non-optimized assays to demonstrate the effectiveness of the FA-competitive binding model. All assays are assumed to have the same FA values for the bound and unbound dextran populations. The differences in the modeled assay profiles are a result of differences in the binding at equilibrium. Glucose concentrations were varied from 0 mg/dL to 500 mg/dL for each assay, and the responses are shown in Figure 4A. The experimentally observed responses for the same assay configurations are shown in Figure 4B.
Figure 4.
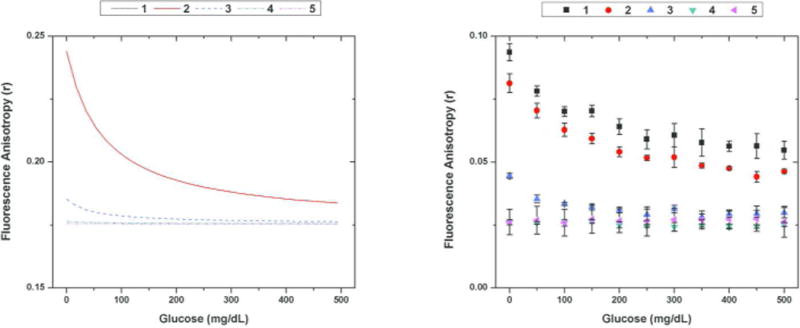
(left) Modeled FA glucose response and (right) experimentally observed FA glucose response for the following configurations (4 kDa FITC-dextran concentrations and ConA concentration) [1: (100 nM, 100 uM), 2: (1 uM, 100 uM), 3: (100 nM, 10 uM), 4: (100 nM, 1 uM), 5: (100 nM, 100 nM)] Note that the modeled curves for 1 and 2 lay on top of each other and that the basic trends predicted in the modeled FA assays were observed in the experimental data. The error bars depict the standard deviation from the triplicate runs.
The experimental response for each assay configuration displayed the trend that was predicted with the model. For the same concentration of FITC-dextran, the assays using higher concentrations of ConA elicited a higher dynamic range across physiological glucose concentrations. At 1 μM ConA and lower, there was effectively no response from the assay, which was predicted as shown in Figure 3. In addition, a large range of dextran concentrations*** (100nM–1 μM) for a given ConA concentration (100 μM) showed an effective, dynamic response. As predicted by Figure 3, the dynamic range of the assay could be increased further by using concentrations of ConA up to 500 μM. However, the solubility of the protein limited the highest concentrations of ConA to be 100 μM. This extended dynamic range could be obtained if the fluorescent CL had a higher affinity to ConA, decreasing the required ConA concentration.
Several differences between the experiment and the model are important to note. The experimentally determined FA is lower than the modeled FA values which could be explained by local fluorophore motion allowed by the linkage between the fluorophore and the ligand [24]. This shift in FA could also be seen if the dextran structure and the dextran/ConA complex were not perfectly spherical. The ellipsoidal nature of the bound and unbound dextran would result in a shorter rotational correlation lifetime, decreasing the observed FA. Either way, the change in FA is similar to those predicted, and should be large enough to display the effectiveness of competitive binding for sensing.
Another difference between the modeled and experimental results is the upwards shift of the FA values relative to the baseline at 500 mg/dL glucose for assays with higher ConA concentrations. This shift could be attributed to an increase in viscosity from the high protein concentrations. As seen in Equation 3, the rotational correlation lifetime of a fluorophore is directly proportional to the viscosity of the solution in which it resides. As slight increases in viscosity would be expected at 100 μM ConA, the FA of the fluorescent molecules within the sample could increase accordingly.
The slight difference between the predicted change and actual change to glucose could be explained via changes in the fluorescence lifetime upon ConA binding to the 4 kDa FITC-dextran. In this original model, the quantum yield and the lifetime of FITC-dextran were assumed to remain constant upon binding. To test the validity of this assumption with regards to the predicted anisotropy response, the fluorescence lifetime of the free and bound states of 4 kDa FITC-dextran was experimentally determined. The lifetime of the FITC-dextran appears to decrease from ~3.9 ns to ~1.7 ns upon binding to ConA. The anisotropy response was adjusted to account for the affect of this change with regards to an adjusted bound anisotropy and an adjusted fractional intensity from the bound population. These were combined in an adjusted model as shown in Figure 5. The lifetime and quantum yield studies are displayed in the supplementary information.
Figure 5.
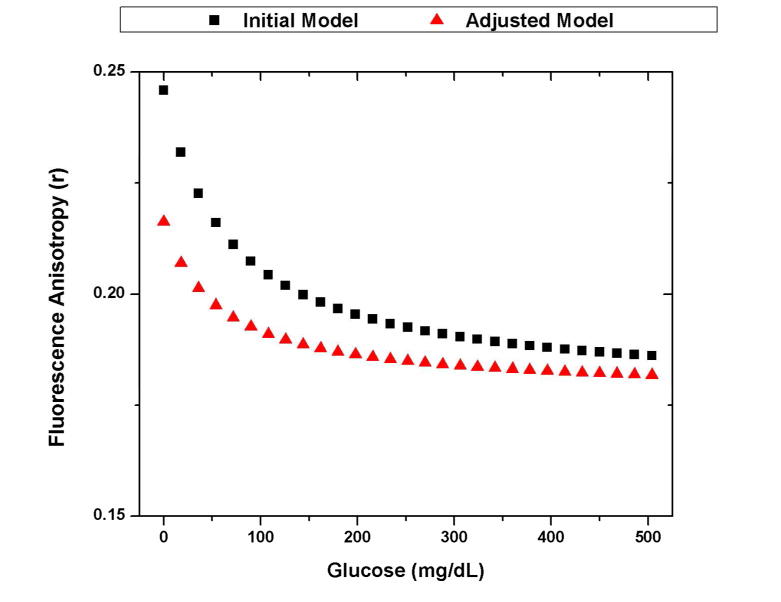
The initial and adjusted models of the glucose anisotropy response for an assay based on 1 uM FITC-dextran and 100 uM ConA. The initial model uses the assumption that there is no change in the fluorescence lifetime upon binding to ConA (4 ns free, 4 ns bound). The adjusted model takes into account the effects from the experimentally measured decrease in lifetime (3.9 ns free, 1.7 ns bound).
When compared to the experimental, glucose-dependent changes to the anisotropy (~.035), the adjusted model does more accurately predict the change (.035) than the initial model (.060). However, it is important to note that the trend is similar. This is due to the fact that the decrease in fluorescent lifetime increases the expected anisotropy of the bound population but decreases the percent of the fluorescence that comes from the bound population also (Equation 4). This combination limits the effect that lifetime changes have on the expected anisotropy response, allowing the aforementioned assumption to remain relatively valid when choosing an appropriate fluorophore for these studies.
This anisotropy response could be further improved by using a fluorophore that undergoes less of a change in lifetime upon binding to ConA. However, without a priori knowledge of the fluorescence lifetime upon binding, the initial assumption that the fluorescence lifetime is unchanged upon binding can allow the user to identify an appropriate fluorescent CL. For this work, an assay based on 4 kDa FITC-dextran and ConA can be optimized using the initial model, and experimental data from the optimized assay of 1 uM 4 kDa FITC-dextran and 100 uM ConA elicits an appreciable change in anisotropy.
| (Eq. 8) |
One data set from the 1 μM FITC-dextran and 100 μM ConA assay was used to calibrate a predictive fit to the assay’s glucose response using FA. Equation 8, which is commonly used for fitting competitive binding assays, was used to fit the data [25]. Using terminology of Findlay and Dillard, D is the FA response at infinite glucose concentration, A is the FA response in the absence of glucose, Glu is the glucose concentration, C is the inflection point on the calibration curve (IC50), and B is the slope factor. This equation was solved by parameter optimization using the curve fitting toolbox in MATLAB. The calibration data and the associated optimized fit using Equation 8 are displayed in Figure 6.
Figure 6.
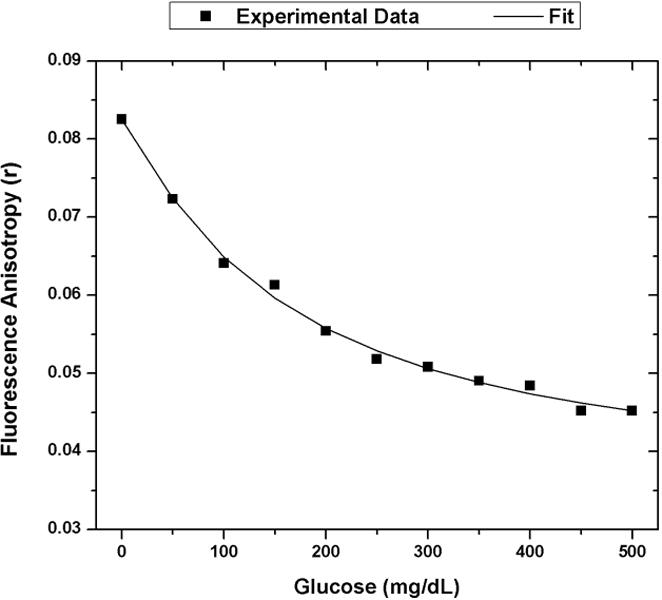
Calibration model for FA competitive binding glucose assay. The optimized assay configuration of 100 uM ConA and 1 uM 4 kDa FITC-dextran was exposed to glucose concentrations from 0 mg/dL to 500 mg/dL. The experimental FA response was plotted with black squares. The calibration fit using Equation 8 is shown as the solid black line. (A = 0.0825, B =1.126, C = 160.4, D = 0.03485). The R-square value for this fit is 0.9951.
All collected data points for the 1 μM FITC-dextran and 100 μM ConA assay from 0 mg/dL and 300 mg/dL glucose concentrations were used to determine the error associated with the prediction. This included 7 calibration data points and 20 prediction data points. The actual versus predicted glucose concentrations for the 1 μM FITC-dextran and 100 μM ConA assay were then plotted on a Clarke Error Grid (Figure 7) for further analysis. Clarke Error Grid Analysis is a way to quantify the predictive ability of a glucose sensor with regard to zones of clinically acceptable error [26]. Linear regression was also performed on the predictive data to give a standard error of prediction.
Figure 7.
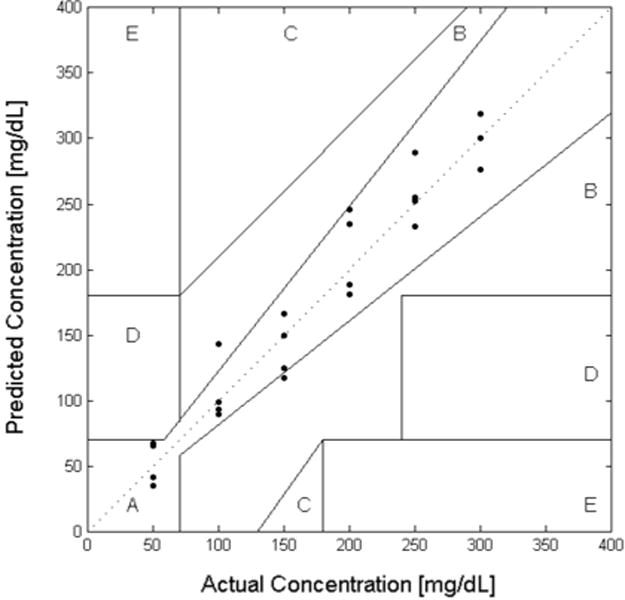
Clarke Error Grid showing the predicted glucose vs. actual glucose curves for FA competitive binding glucose assay. The mean standard error of prediction for glucose concentrations was approximately 7.5 mg/dL and the assay had 87% of all points within Zone A and 13% in Zone B.
The mean standard error of prediction for glucose concentrations from 0 mg/dL and 300 mg/dL was approximately 7.5 mg/dL. In addition, when comparing against the commonly used Clarke Error Grid, the assay had 87% of all points within Zone A and 13% in Zone B. Clinically acceptable predictions include data that is within either zone A or B [26]. As this error is the convolution of the recognition and transduction mechanisms, the ability of ConA to appropriately recognize glucose and competitive binding of this assay for the glucose is at least effective to 7.5 mg/dL.
This error is the convolution of the pipetting, recognition, transduction, and detection errors within the system. Therefore, the standard error of prediction demonstrates an upper limit to the recognition error associated with ConA in a glucose-based sensor, and could be shown to be even lower. For example, the detection error could be decreased by using a spectrofluorometer system equipped with polarizers that have a higher extinction ratio (e.g. Glan-Thompson) than the sheet polarizers used in fluorescent microplate readers. Nevertheless, this level of predictive error shows that the lectin, ConA, can be quite effective at predicting glucose concentrations in a sensor that has independently been optimized with regards to its recognition and transduction mechanisms.
4. CONCLUSIONS
Overall, this research displays that competitive binding assays based on ConA as the receptor are capable of recognizing glucose concentrations with a mean standard error of prediction of at least 7.5 mg/dL from 0 mg/dL to 300 mg/dL. Predictive models for FA were used to correctly choose labeling strategies to minimize the error of transduction. Therefore, while FA is not likely to be a viable transduction mechanism for in vivo applications for trans-dermal sensing due to the high tissue scatter, the use of FA shows that the recognition error of assays using competitive binding with ConA is not the limiting factor with regards to sensitivity. In addition, because the experimental data follows the predicted trend of the combined model, it can be concluded that this assay based on tetrameric ConA and fluorescently labeled 4 kDa dextran appears to generally follow monovalent competitive binding assumptions at these concentrations. Therefore, similar modeling strategies could be employed to determine ideal assay configurations that also follow those assumptions.
Unlike enzymatic assays that are directly dependent on the rates of diffusion, affinity-based assays are much less sensitive to changes in diffusion rates. Therefore, these affinity-based assays have the potential to be optimized in free solution before encapsulating the assay into a deliverable form (e.g. microcapsules). As a result, this work displays the capability for models to play an important role in the development of implantable sensors based on affinity binding. An optimized, solution-based competitive binding assay could be capable of being loaded into the appropriate type of capsule and implanted into the dermis for long-term glucose sensing.
Supplementary Material
Acknowledgments
This work was supported, in part, by the National Institutes of Health under the grant R01 DK09510. Use of the TAMU Materials Characterization Facility is acknowledged. The authors would like to thank Dr. McShane Associate Professor of Biomedical Engineering at Texas A&M University, for the use of his fluorescence microplate reader. The authors would also like to thank Dr. David Jameson (University of Hawaii) and Dr. Mauricio Lasagna (Texas A&M University) for thoughtful conversations on the topic of fluorescence anisotropy.
References
- 1.Schultz JS, Mansouri S, Goldstein IJ. Diabetes Care. 1982;5(3):245–253. doi: 10.2337/diacare.5.3.245. [DOI] [PubMed] [Google Scholar]
- 2.Liao KC, et al. Biosensors and Bioelectronics. 2008;23(10):1458–1465. doi: 10.1016/j.bios.2008.01.012. [DOI] [PubMed] [Google Scholar]
- 3.Shibata H, et al. Proceedings of the National Academy of Sciences of the United States of America. 2010;107(42):17894–17898. doi: 10.1073/pnas.1006911107. [DOI] [PMC free article] [PubMed] [Google Scholar]
- 4.Hussain F, Birch DJS, Pickup JC. Analytical Biochemistry. 2005;339(1):137–143. doi: 10.1016/j.ab.2005.01.016. [DOI] [PubMed] [Google Scholar]
- 5.Tolosa L, et al. Analytical Biochemistry. 1999;267(1):114–120. doi: 10.1006/abio.1998.2974. [DOI] [PMC free article] [PubMed] [Google Scholar]
- 6.Chinnayelka S, McShane MJ. Journal of Fluorescence. 2004;14(5):585–595. doi: 10.1023/b:jofl.0000039345.57924.f3. [DOI] [PMC free article] [PubMed] [Google Scholar]
- 7.Russell RJ, et al. Analytical Chemistry. 1999;71(15):3126–3132. doi: 10.1021/ac990060r. [DOI] [PubMed] [Google Scholar]
- 8.Meadows D, Schultz JS. Talanta. 1988;35(2):145–150. doi: 10.1016/0039-9140(88)80053-5. [DOI] [PubMed] [Google Scholar]
- 9.Jameson DM, Ross JA. Chemical Reviews. 2010;110(5):2685–2708. doi: 10.1021/cr900267p. [DOI] [PMC free article] [PubMed] [Google Scholar]
- 10.Jacob GS. Biochemistry. 1995;34(4):1210–1217. doi: 10.1021/bi00004a014. [DOI] [PubMed] [Google Scholar]
- 11.Oda Y, et al. Journal of Biological Chemistry. 2000;275(35):26772–26779. doi: 10.1074/jbc.M003765200. [DOI] [PubMed] [Google Scholar]
- 12.Weatherman RV, Kiessling LL. Journal of Organic Chemistry. 1996;61(2):534–538. doi: 10.1021/jo951430o. [DOI] [PubMed] [Google Scholar]
- 13.Oyelaran O, Gildersleeve JC. Current Opinion in Chemical Biology. 2009;13(4):406–413. doi: 10.1016/j.cbpa.2009.06.021. [DOI] [PMC free article] [PubMed] [Google Scholar]
- 14.Song X, et al. Glycoconjugate Journal. 2008;25(1):15–25. doi: 10.1007/s10719-007-9066-8. [DOI] [PubMed] [Google Scholar]
- 15.Liu Y, Palma AS, Feizi T. Biological Chemistry. 2009;390(7):647–656. doi: 10.1515/BC.2009.071. [DOI] [PubMed] [Google Scholar]
- 16.Bittiger H, Schnebli HP. Concanavalin A as a tool. Wiley; 1976. [Google Scholar]
- 17.Mandal DK, Kishore N, Brewer CF. Biochemistry. 1994;33(5):1149–1156. doi: 10.1021/bi00171a014. [DOI] [PubMed] [Google Scholar]
- 18.Goldstein IJ, Hollerman CE, Smith EE. Biochemistry. 1965;4(5):876–883. doi: 10.1021/bi00881a013. [DOI] [PubMed] [Google Scholar]
- 19.Mangold SL, Cloninger MJ. Organic and Biomolecular Chemistry. 2006;4(12):2458–2465. doi: 10.1039/b600066e. [DOI] [PubMed] [Google Scholar]
- 20.Dam TK, et al. Journal of Biological Chemistry. 2000;275(19):14223–14230. doi: 10.1074/jbc.275.19.14223. [DOI] [PubMed] [Google Scholar]
- 21.Cheetham NWH, Fiala-Beer E, Walker GJ. Carbohydrate Polymers. 1990;14(2):149–158. [Google Scholar]
- 22.Benzeval I, Bowyer A, Hubble J. European Journal of Pharmaceutics and Biopharmaceutics. 2012;80(1):143–148. doi: 10.1016/j.ejpb.2011.08.009. [DOI] [PubMed] [Google Scholar]
- 23.Wang Z-X. FEBS Letters. 1995;360(2):111–114. doi: 10.1016/0014-5793(95)00062-e. [DOI] [PubMed] [Google Scholar]
- 24.Jameson DM, Seifried SE. Methods. 1999;19(2):222–233. doi: 10.1006/meth.1999.0853. [DOI] [PubMed] [Google Scholar]
- 25.Findlay JWA, Dillard RF. AAPS Journal. 2007;9(2):E260–266. doi: 10.1208/aapsj0902029. [DOI] [PMC free article] [PubMed] [Google Scholar]
- 26.Clarke WL, et al. Diabetes Care. 1987;10(5):622–628. doi: 10.2337/diacare.10.5.622. [DOI] [PubMed] [Google Scholar]
Associated Data
This section collects any data citations, data availability statements, or supplementary materials included in this article.


