

Summary
There is accumulating evidence of the importance of linear polysaccharides in modulating biological phenomena in both the normal and the diseased states. This layer of regulation results from interactions between polysaccharides and other biomolecules, such as proteins, at the cell–extracellular matrix interface. The specific sequence of chemical modifications within the polymer backbone imparts a potential for interaction with other molecular species, and thus there exists important information within the various sulfation, acetylation, and epimerization states of such complex carbohydrates. A variety of factors have made the deciphering of this chemical code elusive. To this end, this report describes several techniques to elucidate the structural information inherent in glycosaminoglycan species. First, the use of depolymerizing enzymes that cleave polysaccharides at specific sites is described. Then, capillary electrophoretic (CE) techniques are employed to characterize the disaccharide species present in an enzymatically-cleaved polysaccharide sample. Mass spectrometry (MS) procedures can further be used to establish the length of an oligosaccharide chain and the presence of specific functional groups.
Keywords: Glycosaminoglycans, Capillary electrophoresis, Mass spectrometry, Heparinase, Chondroitinase, Heparin, Heparan sulfate, Chondroitin, Dermatan
1. Introduction
Glycosaminoglycans (GAGs) are linear acidic polysaccharides that are classified according to their structure into four distinct families: the heparin/heparan sulfate GAGs (HSGAGs), the chondroitin sulfate and dermatan sulfate galactosaminoglycans (GalAGs), keratan sulfate, and hyaluronic acid (1). HSGAGs are biosynthesized as a linear chain of 20–100 disaccharide units of N-acetylglucosamine (GlcNAc) α(1→4) linked to glucuronic acid (GlcA). Modifications to this basic disaccharide unit include O-sulfation at the 3-O and 6-O positions of the glucosamine and at the 2-O position of the uronic acid. The glucosamine can further be modified through N-deacetylation followed by N-sulfation. Epimerization at the C-5 position, resulting in a change from GlcA to iduronic acid (IdoA), can also occur (2). All of the possible modifications relay 48 potential unique disaccharide units that can be found in an HSGAG chain (3). GalAGs are similar to HSGAGs except that the hexosamine moiety is instead N-acetyl-galactosamine (GalNAc). GalAG chains are biosynthesized as a disaccharide repeat unit of GlcA β(1→3) linked to GalNAc. These basic repeat units are in turn β(1→4) linked to form polymeric GalAG. As with HSGAGs, GalAGs can be variably modified through epimerization of the uronic acid moiety and/or sulfation. The three major classes of GalAG biomolecules are chondroitin sulfate A (chondroitin-4-sulfate), chondroitin sulfate B (dermatan sulfate), and chondroitin sulfate C (chondroitin-6-sulfate) (4). Keratan sulfate has the basic disaccharide repeat unit of galactose β(1→4) linked to GlcNAc, and can be modified at the 6-O position of either moiety. Hyaluronic acid is the simplest of all GAG classes, comprised of GlcA β(1→3) linked to GlcNAc.
The study of GAGs is challenging for a variety of reasons (5–8). Their integral isolation from biological sources is tedious. The low quantities that can be consolidated are not sufficient for many analytical platforms. The non-template-based biosynthesis of GAGs precludes the possibility of amplification, as is possible with DNA or proteins. The inherent complexity, heterogeneity, and highly anionic character of GAG chains serve as additional barriers to their examination. In order to overcome these obstacles, investigators have begun to develop and integrate various technologies to unravel the structural (and thus informational) milieu of GAGs pertinent to biology (4). These include chemical and enzymatic tools with which to fragment specific GAG species; separation strategies for the analysis of these GAG fragments (capillary electrophoresis); and the characterization of the chemical groups inherent within a given oligosaccharide (mass spectrometry).
Capillary electrophoresis separates components under the influence of an electric field as they migrate through a capillary. The high resolution and sensitivity of this technique has made it a powerful analytical tool for the analysis of glycosaminoglycans (9, 10). A current is applied across a fused silica capillary filled with electrolyte. The charge on the inner wall of the capillary (invariably negatively charged due to the presence of silanol groups) causes the flow of electrolyte from the anode to the cathode. This flow is called the electro-osmotic flow (EOF) and it is primarily responsible for migration of analytes through the capillary to the detector. Electrophoresis also plays a role in this separation as the electrophoretic force enhances the EOF for cations and opposes it for anions. The pH of the electrolyte controls the balance between the EOF and the force of electrophoresis. The electrolyte used for the analysis of glycosaminoglycans typically has a pH around 2.5. At this pH the capillary wall is uncharged – therefore, the primary force governing the separation is electrophoresis. Typically for the resolution of GAGs by CE the sample is applied at the cathode and detected at the anode and this mode of separation is called the reverse-polarity mode. The resolution achieved by CE is dependent mainly on the charge, mass, and molecular mobility of the analytes present. Detection is typically by ultraviolet (UV) absorbance or fluorescence emission. The procedure described in section 3.2 outlines CE analysis of a mixture of glycosaminoglycan building blocks (disaccharides and tetrasaccharides) generated by enzymatic digestion of the GAG.
Matrix-assisted laser desorption ionization mass spectrometry (MALDI-MS) can be used to identify saccharide intermediates generated upon cleavage of oligosaccharides by GAG-degrading enzymes. These analytical methodologies can be used to probe the underlying biology of GAG-protein interactions through the elucidation of GAG structural elements that are important to these phenomena (11, 12).
2. Materials
2.1. Enzymatic Degradation of Glycosaminoglycans
A variety of GAG-depolymerizing lyases (heparinases I, II, and III and chondroitinases AC and B from Pedobacter heparinus and chondroitinase ABC I from Proteus vulgaris) are commercially available and some have been expressed in recombinant fashion (13–18). Storage buffer and storage conditions for each enzyme are as directed by the supplier. For illustration, we will use chondroitinase ABC I (Seikagaku-America, East Falmouth, MA).
Chondroitin-6-sulfate (Seikagaku-America, East Falmouth, MA).
37°C water bath.
2.2. Capillary Electrophoresis: Compositional Analysis
Fused silica capillaries from Hewlett-Packard (i.d. 75 μm, o.d. 363 μm, ldet. 72.1 cm, and ltot. 80.5 cm).
Agilent 3DCE (capillary electrophoresis) unit coupled with an extended path detection cell.
Electrolyte solution. 10 μM dextran sulfate and 50 mM Tris/phosphoric acid, pH 2.5.
Biovials (100 μl) composed of low protein adsorption CZ resin (Scientific Resources, Eatontown, NJ).
2.3. Mass Spectrometry
A saturated solution of caffeic acid (12 mg/ml in 30% ace-tonitrile/water).
(Arg-Gly)15Arg ([RG15]R) and sucrose octasulfate for calibration.
Mass spectra sample plate with stainless steel flat targets (Perseptive Biosystems).
Glass microscope slide (Gold Seal Products, VWR, West Chester, PA).
Methanol.
Ultrasonic bath.
Applied Biosystems Voyager time-of-flight instrument fitted with a 337-nm laser.
3. Methods
The methods described here provide the pertinent steps needed to analyze a GAG sample once isolated from a biological source. Such a GAG sample can first be systematically fragmented through chemical/enzymatic means (Table 1) (2, 4, 19–21). The resulting species can then be examined on several analytical platforms. Capillary electrophoresis can be used to determine which disaccharide or tetrasaccharide species are present in a fragmented GAG population (22, 23). Mass spectrometry can be employed to determine the number and type of sulfate groups in a given GAG oligosaccharide and the length of the oligosaccharide chain.
Table 1.
GAG-depolymerizing enzymes
| Enzyme class | Enzyme | Specificity |
|---|---|---|
| Heparinase | I | HNx6x(α1,4)-IdoA2S |
| II | HNy6x(α1,4)-U2x | |
| III | HNy6x(α1,4)-GlcA & HNAc(α1,4)-IdoA | |
| Chondroitinase | AC | GalNAc4x6x(β1,4)-GlcA2x |
| B | -GalNAc4x6x(β1,4)-IdoA2x- | |
| ABC I | -GalNAc4x6x(β1,4)-U2x- | |
| ABC II | GalNAc4x6x(β1,4)-U2x- | |
| C | -GalNAc6x(β1,4)-GlcA- | |
| Keratanase | I | HNAc6x-Gal(β1,4)-HNAc6x- |
| II | HNAc6S(β1,3)-Gal6x-HNAc6S | |
| Hyaluronate Lyase | -HNAc(β1,4)-GlcA- |
x Sulfated or unsubstituted; S Sulfated; y Acetylated or sulfated; Ac Acetylated; Gal Galactose; H Hexosamine; U Uronic acid of either the GlcA or IdoA epimer state. Heparinases I, II, and III are from Pedobacter heparinus. Chondroitinases AC, B, and C are also from Pedobacter heparinus. Hyaluronate lyases are available from a variety of sources including Peptostreptococcus, Staphylococcus, Streptococcus, and Apis mellifera, among others. Keratanases mediate the depolymerization of keratan sulfate and are not lyases, but rather hydrolases
3.1. Enzymatic Degradation of Glycosaminoglycans
As an example of GAG depolymerization via enzymatic digestion, chondroitinase ABC I is described. Other enzymes for depolymerizing GAGs are also available (as previously discussed in this chapter and in Table 1, Chapter “Small-Scale Enzymatic Digestion of Glycoproteins and Proteoglycans for Analysis of Oligosaccharides by LC-MS and FACE Gel Electrophoresis”).
Chondroitinase ABC I will be placed in reaction with chondroitin-6-sulfate. A solution of 100 μl of 100 μg/ml chondroitin-6-sulfate in 50 mM Tris–HCl, 50 mM sodium acetate, pH 8.0 is mixed with 1 μg chondroitinase ABC I enzyme.
After gentle mixing, the reaction mixture is placed in a 37°C water bath (optimal temperature for chondroitinase ABC I-mediated catalysis) for 18 h.
The reaction vial can then be stored at 4°C until use.
3.2. Capillary Electrophoresis
These instructions assume use of an Agilent 3DCE unit with uncoated fused silica capillaries (i.d. 75 μm, o.d. 363 μm, ldet. 72.1 cm, and ltot. 80.5 cm) coupled with an extended path detection cell.
For CE analysis, 15 μl of the reaction mixture is placed in a 100 μl biovial from Scientific Resources (Eatontown, NJ) made of low protein adsorption CZ resin.
Analytes are monitored by using UV detection at 232 nm using an electrolyte solution of 10 μM dextran sulfate and 50 mM Tris/phosphoric acid, pH 2.5 (see Note 1).
-
Electrophoretic separation is performed using reverse polarity at a voltage of −30 kV (see Note 2).
Newly installed fused silica capillaries should be prepared by repeated rinsing with 0.1 N sodium hydroxide, water, and 0.1N hydrochloric acid (10 min each, 920 mbar pressure) prior to use. Wash once more for 10 min with distilled water. Finally, wash for 10 min with running buffer. In addition, capillaries are flushed with buffer for 3 min (940 mbar pressure) prior to each separation.
Pressure injection at 30 mbar for 20 s is used to inject samples (see Note 3). When enzymatic digests are being monitored by CE, injection of deionized water for 20 s at 10 mbar should precede sample injection. See Notes 4 and 5 for additional information about capillary electrophoretic experimentation.
Figure 1 is a representative capillary electrophoretogram depicting the disaccharides present in an enzymatic digest with heparinases I and III.
Fig. 1. Capillary electrophoresis.

A representative capillary electrophoretogram showing the product profile of a fragmented oligosaccharide. (1) ΔUHNS, 6S; (2) ΔUHNS; (3)ΔUHNAc, 6S.
3.3. MALDI-MS
For an overview of the MALDI-MS procedure, seeNote 9 and Fig. 2.
Fig. 2. Mass spectrometry.
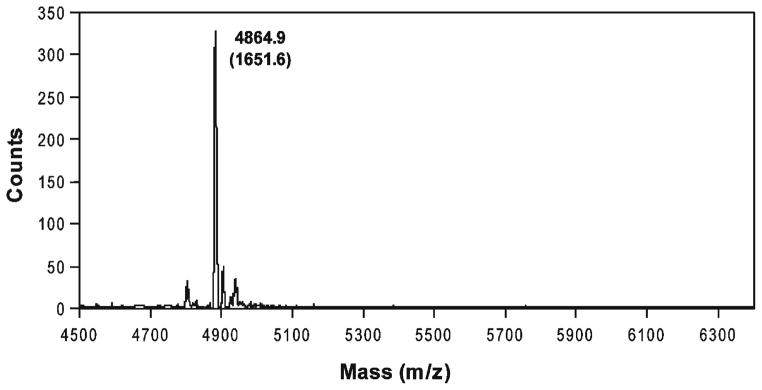
MALDI-MS of an oligosaccharide (shown here as a complex with RG peptide). The actual saccharide mass is shown in parentheses.
The Voyager MALDI-TOF reflectron mass spectrometer from Applied Biosystems (Framingham, MA) is used. The instrument can be modified to allow for the acquisition of mass spectra by delayed extraction (24) (see Note 6).
Sample spots are irradiated using the N2 laser at a repetition rate of 4 Hz. In static mode (continuous extraction), the resulting ions were immediately accelerated to 25 kV kinetic energy. Eighty-five percent of the voltage is applied between the sample stage and the grid. The guide wire is set at 0.1% of the acceleration voltage. During delayed extraction, ions are accelerated to 22 kV kinetic energy with a delay time of 150 ns and the guide wire is set at 0.15%. Ninety-three percent of the voltage is applied between the sample stage and the grid of the acceleration voltage. Low mass ions (matrix ions) are deflected by setting the low mass gate at m/z 1,000. Each spectrum is the average of 128 laser shots (range established by experience). The sample plate is continuously moved during acquisition for samples that have been prepared as microcrystalline layers.
Matrix preparation. Caffeic acid is used as matrix to prepare GAG oligosaccharide samples. A saturated solution of caffeic acid (12 mg/ml) in 30% acetonitrile/70% water is used (see Note 7).
Sample plate preparation. Flat stainless steel targets (Applied Biosystems) are used for depositing samples. The targets are washed with methanol to remove any traces of the previous sample material. The plates are rinsed with water and then ultrasonicated while submerged in an acetonitrile bath. Following ultrasonication, the plates are placed vertically for efficient drying (see Note 8). Traces of methanol or water on the steel surface will inhibit the seeding of polycrystalline layers.
A saturated solution of caffeic acid is then deposited on the cleaned surface, with 1 μl per spot.
After the solvent has completely evaporated, a glass microscope slide (Gold Seal Products) is pressed against the steel surface and moved in a circular motion, creating a thin brownish film on the surface. Any loose material should be gently brushed off.
Sample preparation. Solutions of basic peptide (20–40 μM) are prepared in water. Counterions are removed by the addition of a few beads of anion exchanger AG 1-X2 (Bio-Rad Laboratories). Supernatant is diluted 1:9 with saturated caffeic acid. A volume of 9 μl peptide/matrix mixture is added to 1 μl of sample (10–40 μM oligosaccharide). A 1 μl aliquot of the latter preparation is placed on the seeded sample stage. Polycrystalline layers will form instantaneously. Excess liquid is removed after 1 min by rinsing the sample stage with deionized water. Unused parts of the sample stage must freshly be seeded with caffeic acid after every washing step in order to ensure proper formation of the microcrystalline layers. Samples are therefore deposited in batches of 2–40 prior to rinsing with water. Samples with high salt or glycerol content are applied without prior cleanup. A twofold excess of peptide is required to obtain high sensitivity.
Calibration. Spectra are calibrated externally using sucrose octasulfate or internally using (RG)15R.
MALDI-MS spectra are acquired in the linear mode on an instrument fitted with a 337-nm laser.
Acknowledgments
Funding was provided by the National Institutes of Health Grant GM57073. Vikas Prabhakar was the recipient of the National Institutes of Health Biotechnology Training Fellowship (5-T32-GM08334).
Footnotes
Dextran sulfate is added to the buffer to suppress non-specific interactions with the silica wall. This buffer is prepared by dissolving 10 mg dextran sulfate (Mav = 10,000) and 605 mg Tris in 80 mL deionized water. The solution is then titrated to pH 2.5 with ca. 13 mL 0.5 N phosphoric acid and diluted to 100 mL.
Separations are carried out at 30 kV with the anode at the detector side (reverse polarity).
It is crucial to carefully place the analyte at the bottom of the vial with no air bubbles. A minimum volume of 15 μl is required for the procedure.
The experiment should run at a constant voltage of −30 kV and a constant current between 55 and 65 μA at all times. Abort the procedure if the trial runs outside of these parameters.
Sample levels of the inlet vial and outlet vial should be monitored. The inlet should have a filled volume of about 2/3 and the outlet about 1/3.
Overview of MALDI-MS procedures. A saturated solution of caffeic acid (~12mg/ml in 30% acetonitrile/water) is used as the matrix solution. Seeded surfaces are prepared in an analogous fashion according to previous reports (25, 26). A twofold molar excess of (Arg-Gly)15Arg is pre-mixed with the matrix prior to addition of the oligosaccharide sample solution. A 1 μl aliquot of the sample/matrix mixture is deposited on the seeded stainless steel surface. Following formation of the polycrystalline layer, excess liquid is removed by rinsing with deionized water. MALDI-MS spectra are acquired in the linear mode using an Applied Biosystems Voyager reflectron time-of-flight instrument fitted with a 337-nm laser. Delayed extraction is used to increase resolution (22 kV, grid at 93%, guide wire at 0.15%, pulse delay 150 ns, low mass gate at 1,000, 128 shots averaged). Mass spectra are calibrated externally by using signals for protonated (Arg-Gly)15Arg and its complex with oligosaccharide (Fig. 2).
The protonated complexes of peptides and GAG oligosaccharides are outside the mass range that can be isotopically resolved. Therefore only the isotope averages are measured and conditions are optimized to maximize sensitivity.
The properties of caffeic acid differ depending on the commercial supplier. Our studies suggest that caffeic acid from Sigma provides the greatest sensitivity, superior to material from both Aldrich and Fluka. Some batches from Sigma showed abundant +98 peaks, owing to contamination with sodium sulfate. In this case, the material can be recrystallized in two steps. First, the caffeic acid is dissolved in pure methanol at room temperature and precipitated overnight at 4°C. The precipitate is filtered, washed with water, and then dried. The large yellow needles are then redissolved in an aqueous ammonium solution and precipitated with acetic acid. The initial brown precipitate, pH 5, was discarded and only the subsequent faint yellow precipitate, pH 4, is used. A yellow powder is obtained after drying the filtrate.
Departures from these cleaning procedures have been observed to reduce signal intensities.
References
- 1.Sasisekharan R, Shriver Z, Venkataraman G, Narayanasami U. Roles of heparan-sulphate glycosaminoglycans in cancer. Nat Rev Cancer. 2002;2:521–528. doi: 10.1038/nrc842. [DOI] [PubMed] [Google Scholar]
- 2.Ernst S, Langer R, Cooney CL, Sasisekharan R. Enzymatic degradation of glycosaminoglycans. Crit Rev Biochem Mol Biol. 1995;30:387–444. doi: 10.3109/10409239509083490. [DOI] [PubMed] [Google Scholar]
- 3.Sasisekharan R, Venkataraman G. Heparin and heparan sulfate: biosynthesis, structure and function. Curr Opin Chem Biol. 2000;4:626–631. doi: 10.1016/s1367-5931(00)00145-9. [DOI] [PubMed] [Google Scholar]
- 4.Prabhakar V, Sasisekharan V. Advances in Pharmacology. Vol. 53. Elsevier; Amsterdam: 2006. pp. 69–115. [DOI] [PubMed] [Google Scholar]
- 5.Sasisekharan R, Raman R, Prabhakar V. Glycomics approach to structure-function relationships of glycosaminoglycans. Annu Rev Biomed Eng. 2006;8:181–231. doi: 10.1146/annurev.bioeng.8.061505.095745. [DOI] [PubMed] [Google Scholar]
- 6.Venkataraman G, Shriver Z, Raman R, Sasisekharan R. Sequencing complex polysaccharides. Science. 1999;286:537–542. doi: 10.1126/science.286.5439.537. [DOI] [PubMed] [Google Scholar]
- 7.Turnbull JE. Integral glycan sequencing of heparan sulfate and heparin saccharides. Methods Mol Biol. 2001;171:129–139. doi: 10.1385/1-59259-209-0:129. [DOI] [PubMed] [Google Scholar]
- 8.Turnbull JE, Hopwood JJ, Gallagher JT. A strategy for rapid sequencng of heparan sulfate and heparin saccharides. Proc Natl Acad Sci U S A. 1999;96:2698–2703. doi: 10.1073/pnas.96.6.2698. [DOI] [PMC free article] [PubMed] [Google Scholar]
- 9.Mao W, Thanawiroon C, Linhardt RJ. Capillary electrophoresis for the analysis of glycosaminoglycans and glycosaminoglycan-derived oligosaccharides. Biomed Chromatogr. 2002;16:77–94. doi: 10.1002/bmc.153. [DOI] [PubMed] [Google Scholar]
- 10.Desai UR, Wang H, Ampofo SA, Linhardt RJ. Oligosaccharide composition of heparin and low-molecular-weight heparins by capillary electrophoresis. Anal Biochem. 1993;213:120–127. doi: 10.1006/abio.1993.1394. [DOI] [PubMed] [Google Scholar]
- 11.Saad OM, Leary JA. Compositional analysis and quantification of heparin and heparan sulfate by electrospray ionization ion trap mass spectrometry. Anal Chem. 2003;75:2985–2995. doi: 10.1021/ac0340455. [DOI] [PubMed] [Google Scholar]
- 12.Rhomberg AJ, Ernst S, Sasisekharan R, Biemann K. Mass spectrometric and capillary electrophoretic investigation of the enzymatic degradation of heparin-like glycosaminoglycans. Proc Natl Acad Sci U S A. 1998;95:4176–4181. doi: 10.1073/pnas.95.8.4176. [DOI] [PMC free article] [PubMed] [Google Scholar]
- 13.Prabhakar V, Capila I, Bosques CJ, Pojasek K, Sasisekharan R. Chondroitinase ABC I from Proteus vulgaris: cloning, recombinant expression and active site identification. Biochem J. 2005;386:103–112. doi: 10.1042/BJ20041222. [DOI] [PMC free article] [PubMed] [Google Scholar]
- 14.Prabhakar V, Raman R, Capila I, Bosques CJ, Pojasek K, Sasisekharan R. Biochemical characterization of the chondroitinase ABC I active site. Biochem J. 2005;390:395–405. doi: 10.1042/BJ20050532. [DOI] [PMC free article] [PubMed] [Google Scholar]
- 15.Pojasek K, Shriver Z, Kiley P, Venkataraman G, Sasisekharan R. Recombinant expression, purification, and kinetic characteriation of chondroitinase AC and chondroitinase B from Flavobacterium heparinum. Biochem Biophys Res Commun. 2001;286:343–351. doi: 10.1006/bbrc.2001.5380. [DOI] [PubMed] [Google Scholar]
- 16.Godavarti R, Davis M, Venkataraman G, Cooney C, Langer R, Sasisekharan R. Heparinase III from Flavobacterium heparinum: cloning and recombinant expression in Escherichia coli. Biochem Biophys Res Commun. 1996;225:751–758. doi: 10.1006/bbrc.1996.1246. [DOI] [PubMed] [Google Scholar]
- 17.Myette JR, Shriver Z, Claycamp C, McLean MW, Venkataraman G, Sasisekharan R. The heparin/heparan sulfate 2-O-sulfatase from Flavobacterium heparinum. Molecular cloning, recombinant expression, and biochemical characterization. J Biol Chem. 2003;278:12157–12166. doi: 10.1074/jbc.M211420200. [DOI] [PubMed] [Google Scholar]
- 18.Myette JR, Shriver Z, Kiziltepe T, McLean MW, Venkataraman G, Sasisekharan R. Molecular cloning of the heparin/heparan sulfate delta 4,5 unsaturated glycuronidase from Flavobacterium heparinum, its recombinant expression in Escherichia coli, and biochemical determination of its unique substrate specificity. Biochemistry. 2002;41:7424–7434. doi: 10.1021/bi012147o. [DOI] [PubMed] [Google Scholar]
- 19.Hernaiz MJ, Linhardt RJ. Degradation of chondroitin sulfate and dermatan sulfate with chondroitin lyases. Methods Mol Biol. 2001;171:363–371. doi: 10.1385/1-59259-209-0:363. [DOI] [PubMed] [Google Scholar]
- 20.LeBrun LA, Linhardt RJ. Degradation of heparan sulfate with heparin lyases. Methods Mol Biol. 2001;171:353–361. doi: 10.1385/1-59259-209-0:353. [DOI] [PubMed] [Google Scholar]
- 21.Jandik KA, Gu K, Linhardt RJ. Action pattern of polysaccharide lyases on glycosaminoglycans. Glycobiology. 1994;4:289–296. doi: 10.1093/glycob/4.3.289. [DOI] [PubMed] [Google Scholar]
- 22.Linhardt RJ, Toida T. Tech. Sight. Capillary electrophoresis. Ultra-high resolution separation comes of age. Science. 2002;298:1441–1442. doi: 10.1126/science.298.5597.1441. [DOI] [PubMed] [Google Scholar]
- 23.Calabro A, Midura R, Wang A, West L, Plaas A, Hascall VC. Fluorophore-assisted carbohydrate electrophoresis (FACE) of glycosaminoglycans. Osteoarthr Cartil. 2001;9(Suppl A):S16–22. doi: 10.1053/joca.2001.0439. [DOI] [PubMed] [Google Scholar]
- 24.Juhasz P, Roskey MT, Smirnov IP, Haff LA, Vestal ML, Martin SA. Applications of delayed extraction matrix-assisted laser desorption ionization time-of-flight mass spectrometry to oligonucleotide analysis. Anal Chem. 1996;68:941–946. doi: 10.1021/ac9510503. [DOI] [PubMed] [Google Scholar]
- 25.Xiang P, Lin P. Comment on ‘Solid sampling technique for direct detection of condensed tannins in bark by matrix-assisted laser desorption/ionization mass spectrometry’, Rapid Commun. Mass Spectrom. 2006;2005(19):706. doi: 10.1002/rcm.2291. [DOI] [PubMed] [Google Scholar]; Rapid Commun Mass Spectrom. 20:521. doi: 10.1002/rcm.2291. author reply 522. [DOI] [PubMed] [Google Scholar]
- 26.Beavis RC, Chait BT. Matrix-assisted laser desorption ionization mass-spectrometry of proteins. Methods Enzymol. 1996;270:519–551. doi: 10.1016/s0076-6879(96)70024-1. [DOI] [PubMed] [Google Scholar]