

Abstract
Aims
Mounting data support a ‘calcification paradox’, whereby reduced bone mineral density is associated with increased vascular calcification. Furthermore, reduced bone mineral density is prevalent in older persons with lower body mass index (BMI). Therefore, although BMI and coronary artery calcification (CAC) exhibit a positive relationship in younger persons, it is predicted that in older persons and/or those at risk for osteoporosis, an inverse relationship between BMI and CAC may apply. We sought to explore this hypothesis in a large group of patients with coronary artery disease undergoing percutaneous coronary intervention (PCI).
Methods and Results
We accessed our single-center registry for 07/01/1999 to 06/30/2009, extracting data on all patients that underwent PCI. To minimize bias we excluded those at the extremes of age or BMI and non-Black/Hispanic/Caucasians, leaving 9,993 study subjects (age 66.6±9.9 years). Index lesion calcification (ILC) was analyzed with respect to BMI. Comparing index lesions with no angiographic calcification to those with the most severe, mean BMI decreased by 1.11 kg.m−2; a reduction of 3.9% (P<0.0001). By multivariable modeling, BMI was an independent inverse predictor of moderate-severe ILC (m-sILC; Odds Ratio [OR] 0.967, 95%CI 0.953–0.980, P<0.0001). Additional fully adjusted models identified that, compared to those with normal BMI, obese patients had an OR of 0.702 for m-sILC (95%CI 0.596–0.827, P<0.0001).
Conclusions
In a large group of PCI patients, we identified an inverse correlation between BMI and index lesion calcification. These associations are consistent with established paradigms and suggest a complex interrelationship between BMI, body size and vascular calcification.
INTRODUCTION
Progressive vascular ‘stiffening’ and increased vascular calcification are hallmarks of the aging process.1 Increased arterial calcification and stiffness are associated with a range of adverse physiologic consequences, including increased pulse wave velocity, increased pulse pressure and atherosclerotic plaque burden.1 The relationship between coronary artery calcification (CAC) and plaque biology is complex, with post mortem studies indicating that the degree of calcification is least for eroded plaques, greatest for acute and healed plaque ruptures, and intermediate for stable plaques.2 Although we frequently refer to the extent of gross (macroscopic) CAC, this is an oversimplification that has arisen due to the insensitivity of imaging modalities such as computed tomographic (CT) scanning. In fact, either the intima and/or media may become calcified, and the biology underlying the calcification of these regions appears to be distinct. Intimal calcification is classically associated with atherosclerotic lipid accumulation in that layer, while medial calcification is associated with arteriosclerosis or Mönckeberg’s sclerosis and with associated medial vascular smooth muscle cell transition into an osteoblast-like phenotype.3 Regardless of these subtleties, CAC is an independent predictor of future cardiovascular events and mortality.4
Numerous lines of evidence indicate that a vascular ‘calcification paradox’ exists, whereby reduced bone mineral density is associated with increased vascular calcification. In other words, an inverse relationship appears to apply between vascular calcification and the degree of bone mineralization.3,5 Various mechanisms and signaling pathways are potentially responsible for this association and certainly, there is biologic plausibility to support the calcification paradox.3,5 Importantly, measures of body size including body weight and body mass index (BMI) are positively associated with bone mineral density,6–8 and it is proposed that the physiologic requirement of carrying a larger or heavier body mass results in greater bone mineralization. In support of this, a lack of physical activity is associated with osteoporosis.7
On linking these associations it may be stated that: low body weight or size is independently associated with decreased bone mineral density, which in turn, is independently associated with increased vascular calcification. Therefore, if these relationships hold true and confounding factors do not significantly detract from these associations, body weight and size may be inversely related to vascular calcification. In particular, this may apply in an older population that is more likely to suffer from bone de-mineralization.9 We elected to investigate the possibility that body size is inversely related to CAC in a large group of patients undergoing percutaneous coronary intervention (PCI).
METHODS
Patients and PCI procedure
Our institution established a prospectively collected registry of all PCIs in 1998. All patients undergoing PCI are entered into this institutional review board approved registry within 24 hours of their index intervention. Initial data captured includes baseline clinical characteristics, height, weight, presence of a family history of coronary artery disease (defined as ischemic heart disease in first-degree male relative < 55 or female < 65 years of age), procedural details, details of events occurring immediately post-procedure, in-hospital clinical course, laboratory data, and other test results associated with the procedure.
The registry also includes prospectively collected information regarding the specific nature of each patient’s coronary artery disease, including measures of disease severity, calcification and lesion morphology. These calcification, lesion and anatomical data are adjudicated immediately after PCI by careful visual estimate and consensus decision based on fluoroscopic angiographic appearance and involve, as a minimum, both an experienced interventional cardiologist and a senior interventional fellow. These assessments were exclusively made prior to the conception of this study. Data adjudicated in this fashion includes the degree of index lesion calcification (ILC) of the initial stenotic obstruction on which PCI is performed (none, mild, moderate, severe). Our institution has consistently used a standard visual estimate cut-off of ≥ 60% stenosis to indicate a significant coronary stenosis warranting PCI.10
Data extraction and handling
We retrospectively accessed our single center interventional registry and extracted data on every index PCI procedure performed from July 1st 1999 to June 30th 2009 (inclusive). Initially, we conducted our analyses by including the first (index) PCI of every patient that underwent PCI during this period for a stenotic coronary lesion, with no exceptions or exclusion criteria whatsoever. During the 10 year sampling period, 20,068 patients underwent index lesion PCI and were initially analyzed. For the final analysis presented here, only subjects with complete data for BMI and ILC, and those who were either Caucasian, Black or Hispanic, are presented. In addition, to eliminate confounding due to extreme influences, patients at the extremes of age (age < 45 and > 85) and BMI (BMI < 17 and > 40) were excluded. Patients undergoing PCI of lesions involving coronary artery bypass grafts (CABG) were also excluded. Only one procedure and one lesion (index) is included per patient.
The following definitions were used: BMI = (weight in kg)/(height in meters)2; Glomerular filtration rate (GFR) was calculated according to the modification of diet in renal disease (MDRD) formula;11 hypertension = use of anti-hypertensive medication(s) or a prior clinical diagnosis of hypertension documented from the primary referring physician; dyslipidemia = use of lipid lowering therapy, a prior clinical diagnosis of dyslipidemia documented from the primary referring physician, serum total cholesterol > 240 mg/dL or low-density lipoprotein-cholesterol > 100 mg/dL on presentation to the catheterization laboratory; diabetes = use of anti-diabetic agents, prior clinical diagnosis of diabetes with ongoing dietary control efforts (‘diet controlled’) or blood glucose > 200 mg/dL on presentation to the catheterization laboratory. Normal BMI was defined as a BMI of 18.5 – 24.99 kg.m−2, overweight as BMI 25.0 – 29.99 kg.m−2 and obese as BMI ≥ 30.0 kg.m−2.
Statistical analyses
Comparisons of means between 2 groups were performed by 2-tailed Student’s t test (parametric data) or Kruskal-Wallis test (non-parametric data). Multiple group means were compared by ANOVA with Bonferroni post-hoc testing. Categorical variable group comparisons were performed by 2-sided Fisher’s exact test or Pearson’s Chi-square test. Continuous variables are presented as mean ± standard deviation (SD) or 95% confidence interval (CI). Differences were deemed significant if P < 0.05.
Initially, we verified a normal distribution for BMI and analyzed the complete data of all 20,068 patients who underwent index lesion PCI, with no exclusion criteria whatsoever. This initial analysis yielded a significant independent inverse relationship between BMI and ILC (not presented). Deterministic sensitivity analyses were also performed for being overweight (using BMI ≥ 25 as the cut-off) as a predictor for ILC using the Stata EPISENSRRI module.12 We assumed a non-differential misclassification of being overweight, and assigned sensitivity and specificity among cases and non-cases to 0.9. The observed OR was 0.86 (95% Confidence Interval [CI] 0.81, 0.92) with a deterministic sensitivity analytic external adjusted OR of 0.81, and Percent Bias of 7%. Therefore, the findings are robust even in the presence of minor classification errors for ILC and BMI. For the final analysis presented here, certain patient groups were excluded, as detailed elsewhere. Missing data was dealt with by ‘complete case analysis’ (incomplete cases were excluded), however, in the final analysis left ventricular ejection fraction (LVEF) is the single variable with incomplete data.
Binary logistic regression was used to assess the relationships between the co-variables and ILC. Given that a mild degree of arterial calcification is common in older persons and potentially of reduced discriminatory value, for the binary analysis of ILC we made the a priori decision to compare the presence of moderate or severe ILC (m-sILC) with that of no or mild ILC. Patient race was treated in a standard fashion by taking Caucasian race as the referent group and setting this to 1, with the odds ratio (OR) of the dependent variable for other races (Hispanic and Black) then reported as compared to that of Caucasians.13 For all binary predictors, 1 = presence of the predictor (0 = absence). Initially, expected and potential predictors of the dependent measures were assessed by univariable logistic regression modeling. All significant univariable predictors at the level of P < 0.1 were then entered into multivariable models to identify independent predictors. Only variables that remained in the multivariable models at the level of P < 0.05 were considered independent predictors. Testing for interaction between BMI, age, gender and race was performed with respect to the relationship with ILC; results were non-significant for all interaction terms (P > 0.1). Mindful of the limitation of automated selection of variables,14 we did not enter the co-variables of LVEF or a prior history of CABG into the models for multivessel coronary artery disease because these variables are dependent on the extent of coronary artery disease.
Statistical analyses were performed using IBM SPSS/PASW Statistics 18 (SPSS Inc. Chicago, Il), except for regression, sensitivity analyses and interaction testing, which were performed using Stata 11.1 (College Station, TX).
RESULTS
During the study period 20,068 patients with stenotic coronary artery disease underwent PCI, all of whom were included in pilot analyses. After identifying a possible independent inverse relationship between BMI and ILC across this entire sample, to minimize bias several patient groups were excluded (see methods). This gave a sample of 9,993 patients who were included in the final analysis.
Clinical characteristics were typical of those undergoing PCI at a tertiary referral center (Table 1).15–16 However, this was a racially diverse group, with Caucasians comprising ~ 55% of all subjects. Mean BMI was 28.2 kg.m−2, with > 30% of patients being clinically obese. Angiographic characteristics of index coronary lesions were also typical, with ~ 46% of these lesions being in the left anterior descending artery. Approximately 14% of index lesions exhibited moderate or severe calcification (Table 2).
Table 1.
Baseline patient demographics at index PCI. Data are presented as mean ± SD, or number of subjects (%), with minimum and maximum values also presented for age, height, weight and BMI.
| Females (n = 3446) | Males (n = 6547) | All patients (n = 9993) | P value (females vs. males) | |
|---|---|---|---|---|
|
| ||||
| Age (years) | 68.8 ± 9.6 (45–84) | 65.5 ± 9.9 (45–84) | 66.6 ± 9.9 (45–84) | < 0.0001 |
|
| ||||
| Race: | < 0.0001 | |||
| Black | 772 (22.4%) | 858 (13.1%) | 1630 (16.3%) | |
| Caucasian | 1497 (43.4%) | 4046 (61.8%) | 5543 (55.5%) | |
| Hispanic | 1177 (34.2%) | 1643 (25.1%) | 2820 (28.2%) | |
|
| ||||
| Body size | ||||
|
| ||||
| Height (cm) | 160.2 ± 7.6 (120–195) | 173.0 ± 8.1 (126–211) | 168.6 ± 10.0 (120–211) | < 0.0001 |
|
| ||||
| Weight (kg) | 73.1 ± 14.2 (40.0–121.0) | 84.1 ± 14.7 (45.0–141.0) | 80.3 ± 15.5 (40.0–141.0) | < 0.0001 |
|
| ||||
| BMI (kg.m−2) | 28.5 ± 5.0 (17.0–39.9) | 28.0 ± 4.3 (17.0–39.9) | 28.2 ± 4.6 (17.0–39.9) | < 0.0001 |
|
| ||||
| Number of obese subjects (BMI ≥ 30.0) | 1296 (37.6%) | 1971 (30.1%) | 3267 (32.7%) | < 0.0001 |
|
| ||||
| Cardiovascular risk factors | ||||
|
| ||||
| Diabetes | 1530 (44.4%) | 2156 (32.9%) | 3686 (36.9%) | < 0.0001 |
|
| ||||
| Hypertension | 3108 (90.2%) | 5541 (84.6%) | 8649 (86.6%) | < 0.0001 |
|
| ||||
| Dyslipidemia | 2945 (85.5%) | 5482 (83.7%) | 8427 (84.3%) | 0.024 |
|
| ||||
| Positive family history | 1256 (36.4%) | 2325 (35.5%) | 3581 (35.8%) | 0.36 |
|
| ||||
| Smoking: | ||||
| Current | 589 (17.1%) | 1403 (21.4%) | 1992 (19.9%) | < 0.0001 |
| Any | 1412 (41.0%) | 3667 (56.0%) | 5079 (50.8%) | < 0.0001 |
|
| ||||
| Serum creatinine (mg/dL) | 1.18 ± 1.25 | 1.34 ± 1.32 | 1.29 ± 1.30 | < 0.0001 |
|
| ||||
| GFR (ml/min/1.72m2) | 70.6 ± 28.6 | 76.8 ± 28.2 | 74.6 ± 28.5 | < 0.0001 |
|
| ||||
| Receiving dialysis | 124 (3.6%) | 202 (3.1%) | 326 (3.3%) | 0.17 |
|
| ||||
| Cardiovascular Status | ||||
|
| ||||
| LVEF* | 55.1 ± 10.3 | 52.8 ± 11.2 | 53.6 ± 11.0 | < 0.0001 |
|
| ||||
| Prior CABG | 323 (9.4%) | 879 (13.4%) | 1202 (12.0%) | < 0.0001 |
|
| ||||
| AMI presentation | 155 (4.5%) | 336 (5.1%) | 491 (4.9%) | 0.17 |
|
| ||||
| Number of diseased coronary vessels: | < 0.0001 | |||
| 1 only | 1618 (46.9%) | 2340 (35.7%) | 3958 (39.6%) | |
| 2 only | 1067 (31.0%) | 2188 (33.4%) | 3255 (32.6%) | |
| 3 vessel | 761 (22.1%) | 2019 (30.8%) | 2780 (27.8%) | |
|
| ||||
| Peripheral vascular disease | 372 (10.8%) | 591 (9.0%) | 963 (9.6%) | 0.005 |
|
| ||||
| Baseline medication use | ||||
|
| ||||
| Aspirin | 2929 (85.0%) | 5642 (86.2%) | 8571 (85.8%) | 0.11 |
|
| ||||
| Clopidogrel | 1017 (29.5%) | 1990 (30.4%) | 3007 (30.1%) | 0.37 |
|
| ||||
| ACEI/ARB | 1726 (50.1%) | 3161 (48.3%) | 4887 (48.9%) | 0.088 |
|
| ||||
| β-blocker | 2202 (63.9%) | 4158 (63.5%) | 6360 (63.6%) | 0.71 |
|
| ||||
| Calcium Channel Blocker | 1036 (30.1%) | 1454 (22.2%) | 2490 (24.9%) | < 0.0001 |
|
| ||||
| Nitrates (long acting) | 817 (23.7%) | 1184 (18.1%) | 2001 (20.0%) | < 0.0001 |
|
| ||||
| Diuretic - thiazide | 499 (14.5%) | 636 (9.7%) | 1135 (11.4%) | < 0.0001 |
|
| ||||
| Diuretic–non thiazide | 647 (18.8%) | 877 (13.4%) | 1524 (15.3%) | < 0.0001 |
|
| ||||
| Lipid lowering - Statin | 1993 (57.8%) | 3763 (57.5%) | 5756 (57.6%) | 0.73 |
|
| ||||
| Lipid lowering–other | 325 (9.4%) | 651 (9.9%) | 976 (9.8%) | 0.44 |
For LVEF data was only available for 3300/3446 (95.8%) of females and 6217/6547 (95.0%) of males. There were no other missing data.
Abbreviations not previously defined: ACEI, angiotensin conveting enzyme inhibitor; ARB, angiotensin receptor blocker.
Table 2.
Angiographic characteristics of index coronary lesions. Data are presented as mean ± SD, or number of subjects (%). Complete data were available for all lesions.
| Females (n = 3446) | Males (n = 6547) | All patients (n = 9993) | P value (females versus males) | |
|---|---|---|---|---|
|
| ||||
| Culprit vessel: | < 0.0001 | |||
| Left anterior descending | 1659 (48.1%) | 2999 (45.8%) | 4658 (46.6%) | |
| Circumflex | 784 (22.8%) | 1843 (28.2%) | 2627 (26.3%) | |
| Right coronary | 971 (28.2%) | 1636 (25.0%) | 2607 (26.1%) | |
| Left main coronary | 32 (0.9%) | 69 (1.1%) | 101 (1.0%) | |
|
| ||||
| Calcification severity: | 0.38 | |||
| None | 1902 (55.2%) | 3657 (55.9%) | 5559 (55.6%) | |
| Mild | 1060 (30.8%) | 1934 (29.6%) | 2994 (30.0%) | |
| Moderate | 386 (11.2%) | 737 (11.3%) | 1123 (11.2%) | |
| Severe | 98 (2.8%) | 219 (3.3%) | 317 (3.2%) | |
| Mod-severe calcification | 484 (14.0%) | 956 (14.6%) | 1440 (14.4%) | |
|
| ||||
| Stenosis severity (%) | 84.2 ± 10.5 | 85.4 ± 10.7 | 85.0 ± 10.7 | < 0.0001 |
Unadjusted body anthropometric measures were compared across ILC scores. We observed a progressive, step-wise decrease in BMI with increasing ILC (Figure 1A). From index lesions classified as having no calcification to those graded as severely calcified, mean BMI decreased 1.11 kg.m−2 (95% CI of the difference: 0.59 – 1.62, P < 0.0001), representing a decrease of 3.9% (Figure 1A). This inverse association between BMI and ILC was consistent across males and females (Figure 2). Lower body weight was also observed among those with greater ILC, with mean body weight decreasing by 2.5 kg (95% CI of the difference: 0.7 – 4.2, P = 0.006) from patients with no angiographic ILC to those with the most severe (Figure 1B). There was no significant relationship between ILC and height (Figure 1C). These relationships between weight or height with ILC (or lack thereof) were consistent across males and females (Supplementary Figure 1).
Figure 1.

Unadjusted body anthropometric relationships with ILC. Data were analyzed by ANOVA with Bonferroni post-hoc comparisons and are presented as mean ± 95% CI with between group differences presented as compared to no ILC (*P < 0.05; ***P < 0.0001). (A) BMI verses ILC, overall ANOVA: P < 0.0001. (B) Weight verses ILC, overall ANOVA: P < 0.0001. (C) Height verses ILC, overall ANOVA: P = 0.055.
Figure 2.
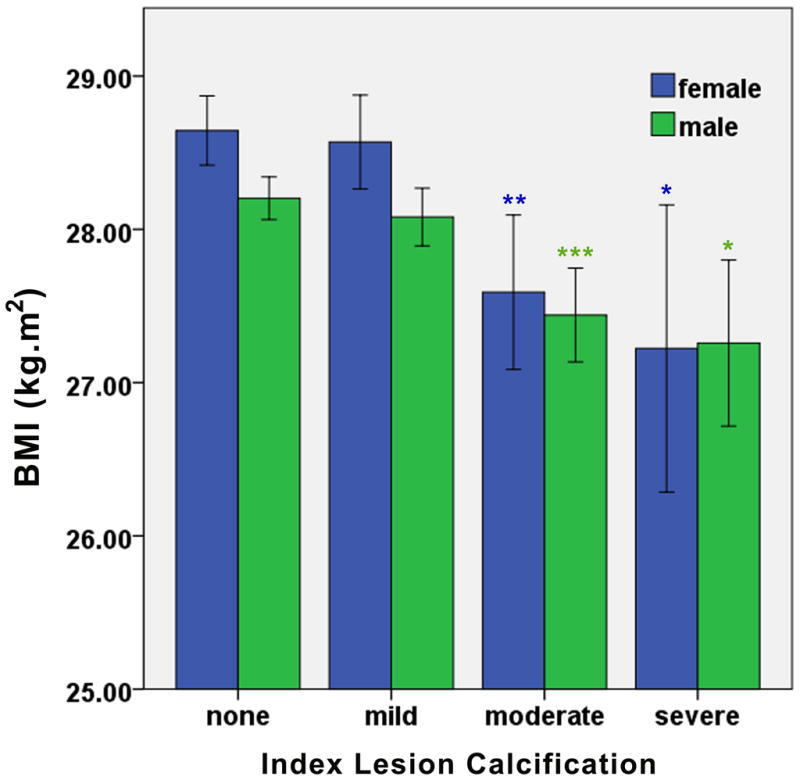
Unadjusted relationships between BMI and ILC stratified by gender. Data were analyzed by ANOVA with Bonferroni post-hoc comparisons and are presented as mean ± 95% CI with between group differences presented separately for males and females as compared to no ILC (*P < 0.05; **P <0.005; ***P < 0.0001). For both females and males the overall ANOVA analysis was significant at P < 0.0001.
These associations were evaluated by logistic regression analyses. Compared to no or mild ILC, BMI and weight were univariable inverse predictors of the presence of moderate or severe ILC (m-sILC) (BMI: OR 0.957, 95% CI 0.945 to 0.970, P < 0.0001; weight: OR 0.989, 95% CI 0.985 to 0.992, P < 0.0001) (Table 3). Similar results were obtained for the presence of any ILC (versus no ILC; BMI: OR 0.983, P < 0.0001; weight: OR 0.994, P < 0.0001) and severe ILC (versus no, mild or moderate ILC; BMI: OR 0.952, P < 0.0001; weight: OR 0.992, P = 0.03).
Table 3.
Univariable and multivariable predictors of moderate or severe index lesion calcification (m-sILC) by binary logistic regression analysis, with BMI entered as a co-variable in the multivariable model (and not weight). For this model, −2 log-likelihood = 7264.2, P < 0.0001.
| Predictors of moderate or severe index lesion calcification | |||||
|---|---|---|---|---|---|
| Univariable Analysis | Multivariable Analysis | ||||
| Variable | Odds Ratio† (95% CI) | P-value | Wald Chi-Square | Odds Ratio† (95% CI) | P-value |
| BMI (per 1 kg.m−2 increase) | 0.957 (0.945, 0.970) | < 0.0001 | 22.94 | 0.967 (0.953, 0.980) | < 0.0001 |
| Weight (per 1 kg increase) | 0.989 (0.985, 0.992) | < 0.0001 | See separate model | ||
| Age (per 1 year increase) | 1.042 (1.035, 1.048) | < 0.0001 | 83.86 | 1.032 (1.025, 1.038) | < 0.0001 |
| Race (vs. Caucasian) | |||||
| -Caucasian* | 1 | 1 | |||
| -Black | 0.529 (0.443, 0.631) | < 0.0001 | 39.34 | 0.545 (0.451, 0.659) | < 0.0001 |
| -Hispanic | 0.633 (0.553, 0.724) | < 0.0001 | 34.33 | 0.646 (0.558, 0.748) | < 0.0001 |
| Hypertension | 1.521 (1.265, 1.830) | < 0.0001 | 10.70 | 1.402 (1.145, 1.716) | 0.001 |
| AMI presentation | 0.346 (0.236, 0.510) | < 0.0001 | 21.29 | 0.382 (0.254, 0.575) | < 0.0001 |
| LVEF (per 1% increase) | 0.990 (0.985, 0.995) | < 0.0001 | 11.89 | 0.991 (0.986, 0.996) | 0.001 |
| Prior CABG | 1.637 (1.405, 1.908) | < 0.0001 | 8.73 | 1.286 (1.088, 1.519) | 0.003 |
| Peripheral vascular disease | 1.908 (1.623, 2.244) | < 0.0001 | 21.96 | 1.526 (1.279, 1.821) | < 0.0001 |
| GFR (per ml/min/1.72m2) | 0.995 (0.993, 0.997) | < 0.0001 | did not enter model | ||
| Diabetes | 1.143 (1.020, 1.282) | 0.022 | 12.94 | 1.268 (1.114, 1.444) | < 0.0001 |
| Dyslipidemia | 1.148 (0.979, 1.345) | 0.090 | did not enter model | ||
| Positive family history | 0.935 (0.831, 1.051) | 0.26 | - | ||
| Male gender | 1.046 (0.930, 1.178) | 0.45 | - | ||
| Any smoking (prior or current) | 0.965 (0.863, 1.079) | 0.54 | - | ||
| Use of thiazide diuretic | 0.948 (0.793, 1.133) | 0.56 | - | ||
Represents the OR for m-sILC (versus no or mild ILC) per unit change in predicting co-variable.
Caucasian race was used as the referent group for race and is set to 1 as it is redundant. In another analysis weight was entered into this multivariable model in place of BMI, and is presented as Supplementary Table 1.
The ability of BMI to independently predict m-sILC (versus no or mild ILC) was then evaluated. Binary logistic regression analyses exploring the effects of age and race on the inverse relationship between BMI and m-sILC revealed that BMI remained an independent predictor of m-sILC when entered into models with age alone (BMI prediction of m-sILC: OR 0.970, 95% CI 0.958 to 0.983, P < 0.0001), race alone (BMI prediction of m-sILC: OR 0.960, 95% CI 0.948 to 0.972, P < 0.0001), or both age and race (BMI prediction of m-sILC: OR 0.972, 95% CI 0.959 to 0.985, P < 0.0001). All univariable predictors were entered into a multivariable model to assess for independent predictors of m-sILC. In this model, BMI remained a significant inverse predictor of m-sILC (OR 0.967, 95% CI 0.953 to 0.980, P < 0.0001) (Table 3). Other independent predictors of m-sILC in this fully adjusted model were age, race, hypertension, index lesion being associated with acute myocardial infarction (AMI), LVEF, prior CABG, peripheral vascular disease and diabetes. Similar results were obtained when weight was substituted for BMI in these models (Supplementary Table 1).
Alternatively, these fully adjusted models were performed after categorizing BMI into discrete groups of normal, overweight and obese. As compared to having a normal BMI, overweight patients had an OR of 0.838 for m-sILC (95% CI 0.725 to 0.969, P = 0.017), while obese patients had an OR of 0.702 (95% CI 0.596 to 0.827, P < 0.0001).
Given that prior publications reported a greater prevalence of CAC in males versus females, yet we found no gender difference (Table 3), we performed gender-specific analyses to identify whether predictors of ILC varied among males and females. While certain other predictors differed slightly, BMI remained a significant independent predictor of ms-ILC for both males (OR 0.974, 95% CI 0.956 to 0.991, P = 0.004) and females (OR 0.961, 95% CI 0.941 to 0.982, P < 0.0001) (Supplementary Tables 2 and 3, respectively).
To assess its relationship to a more global measure of the extent of coronary disease, we evaluated the ability of BMI to predict multivessel coronary artery disease (versus single vessel disease). These analyses revealed that BMI was both a univariable (OR 0.989, 95% CI 0.980 to 0.997, P = 0.011) and an independent inverse predictor of multivessel disease (OR 0.990, 95% CI 0.980 to 0.999, P = 0.030) (Supplementary Table 4).
While numerous local hemorheologic factors that were not measured are known to affect index lesion stenosis severity, we also assessed the relationship between this parameter and BMI. BMI was a univariable inverse predictor of the index lesion being of > 85% stenosis (OR 0.991, 95% CI 0.982 to 0.999, P = 0.031). However, BMI was not an independent predictor of this parameter (not presented).
DISCUSSION
Our understanding of the patho-biology of aging, atheorsclerosis and vascular calcification is expanding rapidly.1,17–18 In this analysis of 9,993 patients with clinically significant coronary disease undergoing PCI, we identified that both BMI and body weight are independent predictors of decreased ILC. The validity of our data was substantiated by deterministic sensitivity analyses and the fact that traditional risk factors associated with CAC and coronary artery disease such as age, race, diabetes, hypertension and peripheral vascular disease were highly predictive of increased ILC (Table 3). Furthermore, the OR for m-sILC was significantly reduced where the index lesion was associated with an AMI presentation. This is consistent with the fact that culprit atherosclerotic lesions that rupture and cause AMI are typically soft, lipid-laden plaques without calcification.19–20 Given the robust associations of ILC with traditional risk factors, the inverse association between AMI presentation and ILC, and the fact that this was a biologically anticipated result, it would seem likely that this is a true biologic association. Moreover, these findings were further substantiated by the fact that increasing BMI was associated with a decreased likelihood of having multivessel coronary disease.
Previously, a large body of data has suggested that increasing BMI or other measures of obesity are associated with increasing CAC, as typically adjudicated by a ‘CAC score’.21–26 How can our findings be reconciled with these studies? Foremost, a careful examination of these predominantly CT-based studies reveals that they were virtually all conducted in persons without clinically significant coronary artery disease.21–26 We are aware of only a single study that suggested a positive association between body weight/BMI and CAC in patients with clinically significant disease.27 However, this report contained only 115 patients, their mean age was only 53.3 years, and the possible association between CAC and BMI was suggested only indirectly.27 In contrast, our patients were significantly older (mean age 66.6) and all had clinically significant coronary disease. Therefore, considering these studies and our data together, this may suggest a dichotomous or “U-shaped” relationship where body size is positively associated with CAC during early stages of the disease, but that at a later stage this relationship becomes reversed. As an alternate explanation, our study measured index lesion calcification whereas prior CT-based studies measured calcification of the entire coronary tree.
Numerous studies already exist that support at a U-shaped relationship between body size and CAC. For example, Shaffer et al9 have reported that atherosclerotic disease burden is associated with decreased bone mineral density in older (but not younger) Mexican American men and women, independent of serum cardiovascular risk factors. As further evidence, Cassidy et al28 reported that BMI and waist-hip ratio were positively associated with progression of CAC in patients at low-risk for cardiovascular events, but that in persons at higher risk no baseline obesity measures were associated with progression of CAC. In addition, in the CARDIA study of 2243 patients enrolled between the ages of 18 - 30 and who were followed for 20 years, BMI at study enrolment was associated positively and linearly with CAC at final follow-up.29 However, the relationship between CAC at final follow-up and measurements of BMI performed at the 5, 10, 15 and 20 year time-points became progressively U-shaped, such that the risk of higher final follow-up CAC was greater for subjects that experienced a reduction in BMI (weight loss) during the study.29 Importantly, the subjects in the CARDIA study had a low prevalence of CAC and they were also significantly younger than those presented here. Finally, bisphosphonate use was recently described as being associated with a decreased prevalence of cardiovascular calcification in older subjects, but more prevalent calcification in younger persons.30 Together, these studies support our findings and the notion that an initial positive association between body weight/BMI and CAC in younger patients or those with pre-clinical atherosclerosis may become reversed with older age, reduced bone mineral density or more advanced coronary artery disease.
What biologic pathways may mediate an inverse association between body size and CAC in older patients or those with significant coronary disease? As an initial component of this explanation, the physical burden of supporting a larger body size is generally considered to be responsible for the biologic need for a more robust supporting bone structure and for the positive association between body size and bone mineralization.6–8 In turn, the vascular ‘calcification paradox’, whereby increasing bone mineral density is inversely related to CAC, appears related to a number of proteins and signaling systems that have opposing actions on bones and the vasculature. As one of these candidate proteins, osteoprotegerin is likely to play a key role in the vascular calcification paradox, with osteoprotegerin genetic knockout mice displaying a severe decrease in bone density with extensive medial vascular calcification.31 Alternatively, the klotho gene may also regulate the inverse relationship between bone and CAC, with mutation of klotho in mice resulting in an aging-like syndrome with reduced lifespan, osteoporosis and arteriosclerosis with extensive medial vascular calcification.32 Adding plausibility, a functional human klotho variant (termed KL-VS), that is prevalent in the general population (frequency 0.157), is an independent risk factor for occult coronary artery disease.33 In additional support of the vascular calcification paradox, in older patients or those on dialysis, clinical interventions using bisphosphonate therapy to increase bone mass also appear to inhibit vascular calcification.30,34–35 Finally, while the effects of statins on vascular calcification are controversial,3 a recent meta-analysis found a modest but significant positive effect on hip bone mineral density.36
Despite the fact that an inverse relationship between body weight/BMI and CAC was predicted based on these abovementioned data, it is important to note that our understanding of these pathways is rudimentary and any mechanistic links between BMI and CAC are speculative. Furthermore, while our original hypothesis was based on a theoretical sequential association between body size, bone mineralization and CAC, other pathways may be operative. For example, it is also possible that body size relates positively to developing more atherosclerotic lesions, but negatively to the rate of calcification or progression of existing lesions. Defining the biology that underlies this U-shaped relationship between body size and CAC will provide major insights into the aging process and vascular disease.
Prior studies have generally reported that males exhibit greater CAC than females.22 However, we found no gender difference in the extent of ILC. As a potential explanation, as mentioned, the majority of the published studies regarding CAC were conducted in subjects without clinically significant coronary artery disease. In contrast, in our study population there was a high prevalence of cardiovascular risk factors in both groups and females were on average ~3 years older than males. The fact that we evaluated ILC, while earlier studies evaluated global CAC, may be of additional importance. Similar factors may have also contributed to the fact that we found no association between the severity of ILC and either a family history of cardiovascular disease or smoking history.
Study limitations
Our data were retrospectively obtained from a single center. The primary parameter of interest, ILC, was determined by careful consensus visual estimate. We did not measure total CAC, or other measures of body size or adiposity such as waist:hip ratio. Also, we have no measure of bone mineral density. The study group had a high prevalence of hypertension and dyslipidemia, >35% had diabetes and >30% were obese (BMI ≥ 30). All of these factors indicate a need to reduce weight. Furthermore, in this cross-sectional study, there is no assurance that BMI at the time of PCI reflects lifetime BMI, and many may lose weight as a consequence of being diagnosed with disease. Regarding the differing imaging modalities of CT versus X-ray fluoroscopy as used in this study, while no direct comparisons exist in the literature with contemporary equipment, it is acknowledged that the sensitivity of CT for the detection of CAC may be superior to that of fluoroscopy. However, neither of these tests is considered the ‘gold standard’ (intravascular ultrasound is superior to both modalities). Furthermore, even using older generation X-ray equipment, fluoroscopy was acknowledged as exhibiting clear utility for the detection of CAC.37 Modern X-ray equipment has even greater sensitivity for the detection of CAC38 and its specificity is high.39
Conclusions
In a large group of consecutive patients with clinically significant coronary artery disease undergoing PCI, we identified an inverse relationship between BMI and body weight with index lesion CAC. These data are consistent with established biologic paradigms, and suggest a more complicated relationship between BMI and CAC than was previously appreciated. Further studies are required to define the biologic basis of this association.
Supplementary Material
Acknowledgments
No specific funding or grant was used to fund this study.
Roxana Mehran has received research grant support from Sanofi-Aventis/BMS, serves on advisory boards for Abbott Vascular, Cardiva, and Regado Bioscience, and has received honoraria from Cordis and The Medicines Company. George Dangas has received speaker’s honoraria from Cordis/Johnson & Johnson and Abbott Vascular. Samin K. Sharma acknowledges speaker’s honoraria from Boston Scientific, Abbott Vascular, The Medicines Company and Lilly/DSI.
We gratefully acknowledge the work of our data management team and Ms. Roja Thapi. We thank Samantha Sartori, PhD, for her valuable assistance with the statistical analyses. We also thank the staff of the Mount Sinai Hospital catheterization laboratory. No specific funding or grant was used to fund this study.
Footnotes
Relationships to industry
The following authors have no relationships to declare: Jason C. Kovacic, Paul Lee, Usman Baber, Rucha Karajgikar, Solene M. Evrard, Pedro Moreno, Valentin Fuster, Annapoorna S. Kini.
References
- 1.Kovacic JC, Moreno P, Nabel EG, et al. Cellular senescence, vascular disease, and aging: part 2 of a 2-part review: clinical vascular disease in the elderly. Circulation. 2011;123:1900–1910. doi: 10.1161/CIRCULATIONAHA.110.009118. [DOI] [PubMed] [Google Scholar]
- 2.Burke AP, Taylor A, Farb A, et al. Coronary calcification: insights from sudden coronary death victims. Z Kardiol. 2000;89:49–53. doi: 10.1007/s003920070099. [DOI] [PubMed] [Google Scholar]
- 3.Persy V, D’Haese P. Vascular calcification and bone disease: the calcification paradox. Trends Mol Med. 2009;15:405–416. doi: 10.1016/j.molmed.2009.07.001. [DOI] [PubMed] [Google Scholar]
- 4.Budoff MJ, Shaw LJ, Liu ST, et al. Long-term prognosis associated with coronary calcification: observations from a registry of 25,253 patients. J Am Coll Cardiol. 2007;49:1860–1870. doi: 10.1016/j.jacc.2006.10.079. [DOI] [PubMed] [Google Scholar]
- 5.Sage AP, Tintut Y, Demer LL. Regulatory mechanisms in vascular calcification. Nat Rev Cardiol. 2010;7:528–536. doi: 10.1038/nrcardio.2010.115. [DOI] [PMC free article] [PubMed] [Google Scholar]
- 6.Akdeniz N, Akpolat V, Kale A, et al. Risk factors for postmenopausal osteoporosis: anthropometric measurements, age, age at menopause and the time elapsed after menopause onset. Gynecol Endocrinol. 2009;25:125–129. doi: 10.1080/09513590802549817. [DOI] [PubMed] [Google Scholar]
- 7.Broussard DL, Magnus JH. Risk assessment and screening for low bone mineral density in a multi-ethnic population of women and men: does one approach fit all? Osteoporos Int. 2004;15:349–360. doi: 10.1007/s00198-003-1549-2. [DOI] [PubMed] [Google Scholar]
- 8.Wildner M, Peters A, Raghuvanshi VS, et al. Superiority of age and weight as variables in predicting osteoporosis in postmenopausal white women. Osteoporos Int. 2003;14:950–956. doi: 10.1007/s00198-003-1487-z. [DOI] [PubMed] [Google Scholar]
- 9.Shaffer JR, Kammerer CM, Rainwater DL, et al. Decreased bone mineral density is correlated with increased subclinical atherosclerosis in older, but not younger, Mexican American women and men: the San Antonio Family Osteoporosis Study. Calcif Tissue Int. 2007;81:430–441. doi: 10.1007/s00223-007-9079-0. [DOI] [PubMed] [Google Scholar]
- 10.Ischinger T, Gruentzig AR, Hollman J, et al. Should coronary arteries with less than 60% diameter stenosis be treated by angioplasty? Circulation. 1983;68:148–154. doi: 10.1161/01.cir.68.1.148. [DOI] [PubMed] [Google Scholar]
- 11.Levey AS, Bosch JP, Lewis JB, et al. A more accurate method to estimate glomerular filtration rate from serum creatinine: a new prediction equation. Modification of Diet in Renal Disease Study Group. Ann Intern Med. 1999;130:461–470. doi: 10.7326/0003-4819-130-6-199903160-00002. [DOI] [PubMed] [Google Scholar]
- 12.Orsini N, Bellocco R, Bottai M, et al. A tool for deterministic and probabilistic sensitivity analysis of epidemiologic studies. Stata Jnl. 2008;8:29–48. [Google Scholar]
- 13.O’Meara E, Clayton T, McEntegart MB, et al. Clinical correlates and consequences of anemia in a broad spectrum of patients with heart failure: results of the Candesartan in Heart Failure: Assessment of Reduction in Mortality and Morbidity (CHARM) Program. Circulation. 2006;113:986–994. doi: 10.1161/CIRCULATIONAHA.105.582577. [DOI] [PubMed] [Google Scholar]
- 14.Austin PC, Tu JV. Automated variable selection methods for logistic regression produced unstable models for predicting acute myocardial infarction mortality. J Clin Epidemiol. 2004;57:1138–1146. doi: 10.1016/j.jclinepi.2004.04.003. [DOI] [PubMed] [Google Scholar]
- 15.Boden WE, O’Rourke RA, Teo KK, et al. Optimal medical therapy with or without PCI for stable coronary disease. N Engl J Med. 2007;356:1503–1516. doi: 10.1056/NEJMoa070829. [DOI] [PubMed] [Google Scholar]
- 16.Tonino PA, De Bruyne B, Pijls NH, et al. Fractional flow reserve versus angiography for guiding percutaneous coronary intervention. N Engl J Med. 2009;360:213–224. doi: 10.1056/NEJMoa0807611. [DOI] [PubMed] [Google Scholar]
- 17.Kovacic JC, Moreno P, Hachinski V, et al. Cellular senescence, vascular disease, and aging: part 1 of a 2-part review. Circulation. 2011;123:1650–1660. doi: 10.1161/CIRCULATIONAHA.110.007021. [DOI] [PubMed] [Google Scholar]
- 18.Kovacic JC, Randolph GJ. Vascular calcification: harder than it looks. Arterioscler Thromb Vasc Biol. 2011;31:1249–1250. doi: 10.1161/ATVBAHA.111.227868. [DOI] [PMC free article] [PubMed] [Google Scholar]
- 19.Virmani R, Kolodgie FD, Burke AP, et al. Lessons from sudden coronary death: a comprehensive morphological classification scheme for atherosclerotic lesions. Arterioscler Thromb Vasc Biol. 2000;20:1262–1275. doi: 10.1161/01.atv.20.5.1262. [DOI] [PubMed] [Google Scholar]
- 20.Stone GW, Maehara A, Lansky AJ, et al. A prospective natural-history study of coronary atherosclerosis. N Engl J Med. 2011;364:226–235. doi: 10.1056/NEJMoa1002358. [DOI] [PubMed] [Google Scholar]
- 21.Allison MA, Michael Wright C. Body morphology differentially predicts coronary calcium. Int J Obes Relat Metab Disord. 2004;28:396–401. doi: 10.1038/sj.ijo.0802571. [DOI] [PubMed] [Google Scholar]
- 22.Kronmal RA, McClelland RL, Detrano R, et al. Risk factors for the progression of coronary artery calcification in asymptomatic subjects: results from the Multi-Ethnic Study of Atherosclerosis (MESA) Circulation. 2007;115:2722–2730. doi: 10.1161/CIRCULATIONAHA.106.674143. [DOI] [PubMed] [Google Scholar]
- 23.Lee CD, Jacobs DR, Jr, Schreiner PJ, et al. Abdominal obesity and coronary artery calcification in young adults: the Coronary Artery Risk Development in Young Adults (CARDIA) Study. Am J Clin Nutr. 2007;86:48–54. doi: 10.1093/ajcn/86.1.48. [DOI] [PubMed] [Google Scholar]
- 24.See R, Abdullah SM, McGuire DK, et al. The association of differing measures of overweight and obesity with prevalent atherosclerosis: the Dallas Heart Study. J Am Coll Cardiol. 2007;50:752–759. doi: 10.1016/j.jacc.2007.04.066. [DOI] [PubMed] [Google Scholar]
- 25.Hsu CH, Chang SG, Hwang KC, et al. Impact of obesity on coronary artery calcification examined by electron beam computed tomographic scan. Diabetes Obes Metab. 2007;9:354–359. doi: 10.1111/j.1463-1326.2006.00617.x. [DOI] [PubMed] [Google Scholar]
- 26.Kramer CK, von Muhlen D, Gross JL, et al. A prospective study of abdominal obesity and coronary artery calcium progression in older adults. J Clin Endocrinol Metab. 2009;94:5039–5044. doi: 10.1210/jc.2009-1497. [DOI] [PMC free article] [PubMed] [Google Scholar]
- 27.Brown BG, Morse J, Zhao XQ, et al. Electron-beam tomography coronary calcium scores are superior to Framingham risk variables for predicting the measured proximal stenosis burden. Am J Cardiol. 2001;88:23E–26E. doi: 10.1016/s0002-9149(01)01753-2. [DOI] [PubMed] [Google Scholar]
- 28.Cassidy AE, Bielak LF, Zhou Y, et al. Progression of subclinical coronary atherosclerosis: does obesity make a difference? Circulation. 2005;111:1877–1882. doi: 10.1161/01.CIR.0000161820.40494.5D. [DOI] [PubMed] [Google Scholar]
- 29.Lee DH, Steffes MW, Gross M, et al. Differential associations of weight dynamics with coronary artery calcium versus common carotid artery intima-media thickness: The CARDIA Study. Am J Epidemiol. 2010;172:180–189. doi: 10.1093/aje/kwq093. [DOI] [PMC free article] [PubMed] [Google Scholar]
- 30.Elmariah S, Delaney JA, O’Brien KD, et al. Bisphosphonate Use and Prevalence of Valvular and Vascular Calcification in Women MESA (The Multi-Ethnic Study of Atherosclerosis) J Am Coll Cardiol. 2010;56:1752–1759. doi: 10.1016/j.jacc.2010.05.050. [DOI] [PMC free article] [PubMed] [Google Scholar]
- 31.Bucay N, Sarosi I, Dunstan CR, et al. Osteoprotegerin-deficient mice develop early onset osteoporosis and arterial calcification. Genes Dev. 1998;12:1260–1268. doi: 10.1101/gad.12.9.1260. [DOI] [PMC free article] [PubMed] [Google Scholar]
- 32.Kuro-o M, Matsumura Y, Aizawa H, et al. Mutation of the mouse klotho gene leads to a syndrome resembling ageing. Nature. 1997;390:45–51. doi: 10.1038/36285. [DOI] [PubMed] [Google Scholar]
- 33.Arking DE, Becker DM, Yanek LR, et al. KLOTHO allele status and the risk of early-onset occult coronary artery disease. Am J Hum Genet. 2003;72:1154–1161. doi: 10.1086/375035. [DOI] [PMC free article] [PubMed] [Google Scholar]
- 34.Hashiba H, Aizawa S, Tamura K, et al. Inhibition of the progression of aortic calcification by etidronate treatment in hemodialysis patients: long-term effects. Ther Apher Dial. 2006;10:59–64. doi: 10.1111/j.1744-9987.2006.00345.x. [DOI] [PubMed] [Google Scholar]
- 35.Nitta K, Akiba T, Suzuki K, et al. Effects of cyclic intermittent etidronate therapy on coronary artery calcification in patients receiving long-term hemodialysis. Am J Kidney Dis. 2004;44:680–688. [PubMed] [Google Scholar]
- 36.Uzzan B, Cohen R, Nicolas P, et al. Effects of statins on bone mineral density: a meta-analysis of clinical studies. Bone. 2007;40:1581–1587. doi: 10.1016/j.bone.2007.02.019. [DOI] [PubMed] [Google Scholar]
- 37.Langou RA, Huang EK, Kelley MJ, et al. Predictive accuracy of coronary artery calcification and abnormal exercise test for coronary artery disease in asymptomatic men. Circulation. 1980;62:1196–1203. doi: 10.1161/01.cir.62.6.1196. [DOI] [PubMed] [Google Scholar]
- 38.de la Torre Hernandez JM, Laso FS, Ruisanchez C, et al. Coronary angiography with flat panel digital detectors significantly increases the sensitivity for calcium detection in relation to conventional fluoroscopy: comparison of both systems with intravascular ultrasound. J Invasive Cardiol. 2005;17:365–368. [PubMed] [Google Scholar]
- 39.Tuzcu EM, Berkalp B, De Franco AC, et al. The dilemma of diagnosing coronary calcification: angiography versus intravascular ultrasound. J Am Coll Cardiol. 1996;27:832–838. doi: 10.1016/0735-1097(95)00537-4. [DOI] [PubMed] [Google Scholar]
Associated Data
This section collects any data citations, data availability statements, or supplementary materials included in this article.