

Abstract
Endochondral ossification is a highly regulated process that relies on properly orchestrated cell-cell interactions in the developing growth plate. This study is focused on understanding the role of a crucial regulator of cell-cell interactions, the membrane-anchored metalloproteinase ADAM17, in endochondral ossification. ADAM17 releases growth factors, cytokines, and other membrane proteins from cells and is essential for epidermal growth factor receptor (EGFR) signaling and for processing tumor necrosis factor alpha. Here, we report that mice lacking ADAM17 in chondrocytes (A17ΔCh) have a significantly expanded zone of hypertrophic chondrocytes in the growth plate and retarded growth of long bones. This abnormality is caused by an accumulation of the most terminally differentiated type of chondrocytes that produces a calcified matrix. Inactivation of ADAM17 in osteoclasts or endothelial cells does not affect the zone of hypertrophic chondrocytes, suggesting that the main role of ADAM17 in the growth plate is in chondrocytes. This notion is further supported by in vitro experiments showing enhanced hypertrophic differentiation of primary chondrocytes lacking Adam17. The enlarged zone of hypertrophic chondrocytes in A17ΔCh mice resembles that described in mice with mutant EGFR signaling or lack of its ligand transforming growth factor α (TGFα), suggesting that ADAM17 regulates terminal differentiation of chondrocytes during endochondral ossification by activating the TGFα/EGFR signaling axis.
INTRODUCTION
Skeletal development is crucial to ensure optimal mobility and breathing, as well as protection of vital organs, such as the brain, spinal cord, lung, and heart. The axial and appendicular skeletons are formed through the generation of a cartilage intermediate, a process known as endochondral ossification, whereas the skull and clavicles are formed through intramembranous ossification (1–3). In the limb bud, which can be used as a model, endochondral ossification is initiated when mesenchymal precursor cells condense and the most central chondrocytes begin to differentiate. Eventually, this gives rise to different zones of chondrocytes in the growth plate, beginning with the resting zone, followed by the proliferating zone and the hypertrophic zone, in which chondrocytes secrete a type X collagen-rich matrix (1, 2). Once the hypertrophic chondrocytes mature into a terminally differentiated state and the lowermost cell layer becomes surrounded by mineral, the hypertrophic chondrocytes undergo apoptosis. This area in the developing long bone is directly adjacent to the primary center of ossification and is remodeled into trabecular bone as the invading vasculature supports the influx of osteoblasts and osteoclasts. In this process, the calcified matrix laid down by the hypertrophic chondrocytes is thought to be degraded through proteolytic activities, including MMP13 and MMP9 (4), while the remaining matrix provides a scaffold for the formation of trabecular bone. A secondary center of ossification develops after birth in mice at both ends of developing long bones.
One of the signaling pathways that regulates endochondral ossification and differentiation of hypertrophic chondrocytes involves activation of the epidermal growth factor receptor (EGFR), a tyrosine kinase receptor with important roles in development and disease (3, 5). Mice carrying the human EGFR instead of the mouse receptor have an enlarged zone of hypertrophic cells, presumably because the human EGFR is only weakly expressed, thereby generating a partial loss-of-function mutation (6). An analysis of Egfr−/− mice revealed an expanded hypertrophic zone as well as a lack of osteoclast recruitment (7). Moreover, treatment of 1-month-old rats with the EGFR inhibitor gefitinib results in a profound expansion of the growth plate, caused by an increased size of the hypertrophic zone (8). This treatment reduces the MMP9, MMP13, and MMP14 levels at the chondro-osseus junction (COJ) and causes a defect in osteoclast migration to the COJ, presumably due to altered levels of RANKL and OPG released by hypertrophic chondrocytes (8). An expansion of the hypertrophic zone was also seen in mice carrying a dominant-negative allele of Egfr (Wa5), and this was exacerbated by inactivation of the other, floxed allele of Egfr by the chondrocyte-specific Col2a1-Cre (8). Taken together, these results demonstrate that chondrocyte growth or differentiation is regulated by the EGFR (8).
The EGFR signaling pathway is activated by the binding of any of the seven EGFR ligands to the EGFR. All EGFR ligands are synthesized with a transmembrane domain and must be proteolytically released to create the active soluble growth factor (9, 10). The membrane-anchored metalloproteinase ADAM17 (a disintegrin and metalloproteinase 17) has emerged as the principal sheddase for five EGFR ligands: heparin binding-epidermal growth factor (HB-EGF), transforming growth factor α (TGFα), amphiregulin, epiregulin, and epigen (11, 12). The related ADAM10 is required for shedding of the remaining two ligands, betacellulin and EGF (12, 13). Mice lacking ADAM17 resemble mice lacking the EGFR or specific EGFR ligands, in that they have open eyes at birth and wavy and stunted hair, as well as defects in lung and heart development (14–19). Moreover, targeted deletion of Adam17 in keratinocytes gives rise to skin barrier defects that resemble those observed in mice lacking the EGFR in keratinocytes (20, 21). Mice with strongly reduced overall ADAM17 activity develop skin defects and intestinal inflammation that most likely are caused by a lack of TGFα/EGFR signaling (22). Interestingly, TGFα also appears to be the physiologically relevant EGFR ligand in endochondral ossification, as Tgfα−/− mice display a phenotype remarkably similar to that of EGFR inhibitor-treated rats (23). These mice have an increased zone of hypertrophic chondrocytes with decreased levels of MMP13 and RANKL, resulting in reduced numbers of osteoclasts at the COJ at postnatal day 21 (P21). Taken together, these findings raise interesting questions about the role of ADAM17 as a regulator of cell-cell interactions during bone development.
The role of ADAM17 in early endochondral ossification was first addressed by Boissy et al., who identified a defect of osteoclast migration into the primary center of ossification in Adam17−/− mice (24). Additionally, conditional deletion of ADAM17 in all osteochondroprogenitor cells (Adam17flox/flox/Sox-9cre) results in an elongated hypertrophic zone as well as shorter proliferating zones (25). The goal of this study was to gain a better understanding of the role of ADAM17 in endochondral ossification by analyzing Adam17−/− mice in parallel with mice bearing conditional inactivation of Adam17 in chondrocytes, osteoclasts, or endothelial cells in different stages of development, as well as in adults.
MATERIALS AND METHODS
Ethics statement.
All experiments were performed according to the guidelines of the American Veterinary Association and were approved by the IACUC of the Hospital for Special Surgery.
Reagents and antibodies.
All reagents were purchased from Sigma-Aldrich unless specified otherwise. ADAM17 was detected using a previously described antibody directed against its cytoplasmic domain (26). Cleaved collagen I or collagen II was detected using the C1,2C antibody (IBEX) against the shorter end of the cleavage site that generates the 3/4 and 1/4 fragments. Endomucin was detected using a purified anti-mouse endomucin antibody (eBiosciences).
Mouse strains.
Mice with a transgene expressing the Cre recombinase under the control of the chondrocyte-specific Col2a1 promoter (27), kindly provided by Hicham Drissi (University of Connecticut, Farmington, CT), were crossed with Adam17flox/flox (28) mice to generate Adam17flox/flox/Col2a1-cre mice, which are referred to as A17ΔCh mice. Additionally, Adam17flox/flox/LysM-Cre mice (A17ΔMC) lacking ADAM17 in the myeloid/osteoclast lineage (28) were crossed with A17ΔCh mice to generate Adam17flox/flox/LysM-Cre/Col2a1-cre (A17ΔCh/MC) mice. Adam17flox/flox/Tie2-cre mice have been previously described and are referred to as A17ΔEC mice (29). Genotyping was performed by standard PCR protocols as described previously (LysM-cre and Adam17flox were described by Horiuchi et al. [28]; Col2a1-cre was described by Jackson Laboratories). Adam17flox/flox littermates were used as controls and are referred to as the wild type (wt), as they showed no phenotypic abnormality (28, 29). Adam17−/− pups were generated from matings of Adam17+/− mice and identified by their open-eye phenotype (later confirmed by genotyping), which is not observed in the wt or heterozygous littermates (15, 28). Tnfα−/− mice were purchased from Jackson Laboratories (B6;129S-Tnftm1Gkl/J). All mice were of 129Sv/C57BL/6 mixed genetic background, and all comparisons were between littermates.
Histological analysis. (i) Whole-mount alcian blue and alizarin red staining.
Alcian blue and alizarin red staining were performed using a modified version of McLeod's method on ethanol-fixed samples (30). Cartilage was stained with alcian blue, followed by clearing of the skeleton with potassium hydroxide and staining of the bones with alizarin red.
(ii) Sample processing.
Samples were fixed overnight at 4°C in 4% paraformaldehyde (PFA). PFA was removed and replaced with 10% EDTA in 0.1 M Tris buffer, pH 7.4, for decalcification. Samples were decalcified for 6 to 14 days depending on the age of the pups. Samples were rinsed in running, distilled water for at least 4 h before dehydration and embedded in paraffin through immersion in a graded series of alcohol, xylene, and paraffin. Six-micrometer sections were floated in a 48°C water bath onto Superfrost Plus microscope slides (Cardinal Health). Slides were dried at 37°C overnight before further treatment.
(iii) Histological staining.
Hematoxylin and eosin (H&E), safranin O, and fast green staining were performed according to standard protocols on paraffin-embedded sections. Von Kossa staining was performed on P0.5 samples that were fixed and washed 3 times with PBS without decalcification and then processed as described above. The sections were deparaffinized, rehydrated, and rinsed with water before immersion in a solution of 1% silver nitrate and exposed to UV light for 5 min in a Bio-Rad UV transilluminator. Residual silver was removed with one wash of 5% sodium thiosulfate. The samples were then counterstained with eosin.
(iv) TRAP staining.
Tartrate-resistant acid phosphatase (TRAP) staining was performed on deparaffinized and rehydrated sections using an acid phosphatase, leukocyte TRAP kit (Sigma-Aldrich) according to the manufacturer's instructions.
(v) TUNEL staining.
Terminal deoxynucleotidyltransferase-mediated dUTP-biotin nick end labeling (TUNEL) staining was performed using an in situ cell death detection kit, fluorescein (Roche Applied Science) according to the manufacturer's directions. Staining was quantitated by counting all positively stained nuclei within an area of 100 μm above and below the COJ (for a total width of 200 μm) along the length of the COJ. This number was divided by the length of the COJ in μm and multiplied by 100 to calculate the number of apoptotic specks per 100 μm of COJ.
(vi) EdU labeling.
The nucleotide 5-ethynyl-2′-deoxyuridine (EdU) was used to measure proliferation in a manner similar to that of bromodeoxyuridine (BrdU) incorporation. Pregnant mice were injected with EdU (10 μg/g) and sacrificed 2 h postinjection. Embryos were fixed with 4% PFA and processed as described above. EdU detection was performed using a Click-iTEdU imaging kit (Invitrogen) according to the manufacturer's instructions. EdU-positive cells were marked by an Alexa Fluor 594 azide, imaged using a Nikon Eclipse E600 microscope, photographed using a Retiga Exi camera, and processed with the accompanying software from QImaging. All nuclei were stained with Hoechst dye and visualized under UV light. Images were imported into ImageJ (NIH), and EdU-stained images (red) were merged with images of Hoechst staining (blue). All of the cells within a column closest to the middle of the section (width, 100 μm; length, 700 μm) were counted using the cell count function, and then cells with purple nuclei (EdU plus Hoechst stain) were counted separately. The cell proliferation ratio was calculated by dividing the number of EdU-stained cells by the total number of cell nuclei.
Immunohistochemistry. (i) Endomucin.
After deparaffination and rehydration, samples were blocked in 2% bovine serum albumin (BSA) dissolved in phosphate-buffered saline (PBS). Anti-mouse endomucin (clone eBioV.7C7) (eBiosciences) was diluted 1:100 in 2% BSA-PBS and incubated with the samples overnight at 4°C. The samples were washed 3 times with PBS and incubated for 1 h at room temperature with anti-rat Cy3 (1:400) (Jackson ImmunoResearch). Samples were counterstained with Hoechst dye. After washing an additional 3 times with PBS, the samples were mounted in fluorescent mounting media (Dako) and processed as described above. Quantification was performed on a randomly selected area of 500 μm along the COJ that started at the COJ and extended 100 μm toward the trabecular side of the COJ for the P0.5 samples. For P21 samples, an area of 1,500 μm along the COJ was chosen that extended into the trabecular side by 500 μm. Positive pixels were selected using the magic wand tool set to recognize a value of red of 90 with a tolerance of 45, allowing positive pixels plus those with levels of ±45 for red. The positive pixels were divided by the total number of pixels in the selected area in order to obtain the percent positive staining.
(ii) Collagen II (C1,2C) staining.
After deparaffinization and rehydration, antigen retrieval was performed by incubating with hyaluronidase (Sigma-Aldrich) for 30 min at 37°C. Endogenous peroxidase activity was quenched using a 3% hydrogen peroxide solution. For blocking, secondary antibody, and signal amplification, the Vectastain ABC rabbit IgG kit (Vector Laboratories) was used according to the manufacturer's instructions. Primary antibody (C1,2C; IBEX) was used diluted 1:100. Signal was developed using NovaRED (Vector Laboratories).
(iii) In situ hybridization.
Samples were dissected in diethyl pyrocarbonate (DEPC)-treated PBS and fixed overnight at 4°C in neutral buffered formalin (NBF). The samples were decalcified in a 50:50 mixture of NBF and 0.5 M EDTA for 7 days, washed 6 times with excess DEPC-treated water, paraffin embedded, and sectioned as described above, utilizing DEPC-treated water to prepare all reagents. Digoxigenin (DIG)-labeled probes were prepared using linearized DNA and a DIG RNA labeling kit (SP6/T7) (Roche) according to the manufacturer's instructions. Hybridization was performed as previously described (31). For in situ hybridization using radioactive 35S-labeled RNA probes, the procedures described by Gagnon et al. (32) were employed on humeri from P0.5 mice. The probes for in situ detection of Col10a1 mRNA (33) (originally generated in the laboratory of Kathryn Cheah, University of Hong Kong, Hong Kong), Runx2 mRNA (originally generated by the laboratory of Gerard Karsenty, Columbia University Medical Center, New York, NY), Mmp13 mRNA (2), and Col2a1 mRNA were obtained from D. Plumb (34).
Faxitron analysis.
Digital Faxitron images of disarticulated limbs were generated. The images were imported and the lengths of the bones measured in ImageJ. The longest distances from the proximal to the distal joint of tibiae and femurs were measured for this purpose.
μCT analysis.
P21 disarticulated tibiae were separated from all soft tissues before being fixed in 100% ethanol and then moved to 70% ethanol for analysis. The metaphysis and a section of the cortical bone of the tibiae were subjected to bone microcomputed tomography (microCT) analysis on a Scanco mCT 35 (Scanco Medical, Brüttisellen, Switzerland) system with a voxel size of 6 μm. The images were analyzed by three-dimensional reconstruction using Scanco μCT software (HP DECwindows Motif 1.6) with a global threshold of 0.4 g/mm3. Parameters were calculated as described by Bouxsein et al. (35).
FTIR spectroscopic imaging.
Distal humeri from wt and Adam17−/− mice at embryonic day 18.5 (E18.5) were cleaned of soft tissue, embedded in polymethyl methacrylate, and sectioned at a 2-μm thickness prior to examination by Fourier transform infrared (FTIR) imaging spectroscopy as detailed elsewhere (36). Three sections from each bone, including the growth plate, primary spongiosa, and a section of long bone, were analyzed for mineral content, crystallinity, and collagen maturity. The distributions of these parameters in the images were visually compared, and the mean values of each parameter were compared.
Western blot analysis.
Primary cartilage isolated from P2 pups was lysed in 1% Triton X-100, 50 mM 1,10-phenanthroline (to prevent postlysis autodegradation of mature ADAM17 [26, 37]), and 1× protease inhibitor cocktail in PBS. Samples were homogenized using a Polytron (Polytron part 10-35 GT; Kinematica). After clearing the lysate by spinning at 15,000 × g for 5 min to remove nuclei and cell debris, glycoproteins were concentrated on concanavalin A-Sepharose (25 μl of 50% slurry per 1 ml of lysate; GE Healthcare). The bound glycoproteins were removed using SDS-sample loading buffer, reduced by the addition of 5 mM β-mercaptoethanol, and then separated on 10% SDS-PAGE gels and transferred to nitrocellulose. ADAM17 was detected using a previously described antibody directed against its cytoplasmic domain (26). Phosphorylated EGFR was detected using an anti-p-EGFR (Y1068) (D7A5) XP rabbit monoclonal antibody at 1:1,000 (Cell Signaling Technology). ADAM9 was detected using a previously described antibody against the cytotail (38).
Cell culture for in vitro differentiation.
Primary mouse chondrocytes were isolated from 0.5-day-old wt and Adam17−/− mouse articular cartilage by following a slightly modified version of a previous protocol for isolation of chondrocytes from P5 animals (39). Passage 0 to 2 murine primary chondrocytes were plated at 2.5 × 10⁴ cells/cm2 in Dulbecco's modified Eagle medium (DMEM)–F-12 containing 10% fetal bovine serum (FBS), 1× ITS universal culture supplement (containing insulin, transferrin, and selenous acid; BD Biosciences), and 50 μg/ml of ascorbic acid (Sigma-Aldrich) and were maintained in culture for the indicated times with medium changes every 48 h. For pellet cultures, 5 × 10⁵ wt or Adam17−/− primary chondrocytes were pelleted in two sequential centrifugations (5 min at 4°C, 1000 × g) and maintained in culture for 1 and 3 weeks in 500 ml of DMEM–F-12 containing 10% FBS, 1× ITS, and 50 μg/ml of ascorbic acid, with medium changes every 48 h. The hypertrophic differentiation and mineralization of chondrocytes was assessed by real-time quantitative reverse transcription-PCR (qRT-PCR) analysis and alizarin red staining (Sigma-Aldrich). Alizarin red staining was quantified by counting the number of positively staining nodules per well. The number of nodules seen in a wt well was set to one for each experiment and used to calculate the fold difference in the number of nodules generated by Adam17−/− chondrocytes. Protein ectodomain shedding experiments with transfected alkaline phosphatase-tagged EGFR ligands were performed as described previously (12, 40).
qRT-PCR analysis.
For qRT-PCR analysis, total RNA was isolated from primary chondrocytes cultured in monolayers for 3 and 4 weeks after confluence or in pellet cultures for 3 weeks using standard protocols. Briefly, total RNA was isolated using TRIzol reagent (Life Technologies), and after DNase treatment (Qiagen) and column cleanup (Qiagen), 250 ng of total RNA was reverse transcribed using the QuantiTect reverse transcription kit (Qiagen) according to the manufacturer's instructions. Amplifications were carried out using SYBR green I-based RT-PCR on the Opticon 2 real-time PCR detector system (Bio-Rad) with the PCR primers listed below. Amplification efficiencies were calculated for all primers, utilizing serial dilutions of the pooled cDNA samples. The data were calculated as the ratio of each gene to expression of a housekeeping gene, Hprt, for monolayer culture and Gapdh for pellet culture, using the 2−ΔΔCT method for relative quantification. Data are represented as fold change versus the levels for the wt controls. Melting curves were generated to ensure a single gene-specific peak, and no-template controls were included for each run and each set of primers to control for unspecific amplifications. The following primers were used for qRT-PCR: mouse Col10a1, 5′-ACGCATCTCCCAGCACCAGAATC-3′ (forward) and 5′-GGGGCTAGCAAGTGGGCCCT-3′ (reverse); mouse Runx2, 5′-TCCCCGGGAACCAAGAAGGCA-3′ (forward) and 5′-AGGGAGGGCCGTGGGTTCTG-3′ (reverse); mouse Mmp13, 5′-ATGGTCCAGGCGATGAAGACCCC-3′ (forward) and 5′-GTGCAGGCGCCAGAAGAATCTGT-3′ (reverse); mouse Vegfa, 5′-CTCGCAGTCCGAGCCGGAGA-3′ (forward) and 5′-GCAGCCTGGGACCACTTGGC-3′ (reverse); mouse Tnfsf11 (Rankl), 5′-CGAGCGCAGATGGATCCTAA-3′ (forward) and 5′-CCCCCTGAAAGGCTTGTTTC-3′ (reverse); mouse Tnfrsf11b (Opg), 5′-ACAGTTTGCCTGGGACCAAA-3′ (forward) and 5′-TCACAGAGGTCAATGTCTTGGA-3′ (reverse); mouse Hprt1, 5′-CAAACTTTGCTTTCCCTGGT-3′ (forward) and 5′-CAAGGGCATATCCAACAACA-3′ (reverse); mouse Gapdh, 5′-GGGCTCATGACCACAGTCCATGC-3′ (forward) and 5′-CCTTGCCCACAGCCTTGGCA-3′ (reverse).
Statistical analysis.
Averages, standard deviations (SD), and standard errors of the means (SEM) were calculated using Prism (GraphPad Software). Significance was calculated using an unpaired Student's t test. Results with P < 0.05 were considered statistically significant and are indicated with an asterisk in the figures. Additionally, the significance of the qRT-PCR results was calculated using the Wilcoxon-Mann-Whitney test for paired samples, and P < 0.05 was considered significant.
RESULTS
Expansion of the zone of hypertrophic chondrocytes in Adam17−/− mice.
To assess the role of ADAM17 in endochondral ossification, we performed a whole-mount analysis of newborn Adam17−/− mice. Inspection of alcian blue/alizarin red-stained skeletons revealed an expansion of the blue staining for cartilage at the COJ in the developing scapula (Fig. 1a, arrows) and at other epiphyseal plates, although the skeletons of Adam17−/− mice were otherwise very similar to that of wt controls. The expanded area of blue staining at the COJ prompted us to further explore how lack of ADAM17 affects the growth plate by performing a histological analysis of sections of the tibiae and humeri stained with H&E (Fig. 1b, top) or safranin O/fast green (Fig. 1b, lower). This uncovered a significant enlargement of the zone of hypertrophic chondrocytes in the growth plates of the long bones of Adam17−/− mice compared to controls. The average length of the hypertrophic zone of the proximal humerus in Adam17−/− mice was about double that of controls (Fig. 1c). We next analyzed sections of Adam17−/− and control humeri at different stages of embryonic development (E14.5, E16.5, and E18.5). At E14.5, the zone of hypertrophic chondrocytes extended from one end of the growth plate to the other in Adam17−/− humeri, with no evidence of a primary ossification center (POC), which clearly divided the growth plate of wt littermates into two parts at this stage (Fig. 1d). By E16.5, the Adam17−/− humeri had also developed a POC; however, the zone of hypertrophic cells was expanded compared to the zone of littermate controls (Fig. 1e), and this phenotype remained evident at E18.5 (Fig. 1f).
Fig 1.

Expansion of the hypertrophic zone in Adam17−/− humeri and tibiae. (a) Front limbs of newborn Adam17−/− and wt littermates stained with alcian blue (cartilage) and alizarin red (bone). Note the increased area of overlap between the two stains located at the COJ. This is most evident in the scapulae (arrows) but can also be seen in the humerus, radius, and ulna. Scale bar, 1 mm. (b) Histological sections of newborn Adam17−/− and wt tibiae (left two panels) and humeri (right two panels). Top sections are stained with H&E; the lower adjacent sections are stained with safranin O, to label cartilage proteoglycans (red), and fast green. Lines denote the hypertrophic zone. Scale bar, 250 μm. (c) Quantification of the length of the hypertrophic zones of humeri from wt and Adam17−/− sections: Adam17−/−, 321 ± 40 μm, n = 7; wt, 142 μm ± 19 μm, n = 4 (P < 0.0001). Data are shown as averages ± SD. (d to f) Analysis of the hypertrophic zone during embryonic development (safranin O/fast green staining). (d) A primary ossification center (POC) has formed in the humeri of wt mice at E14.5, but Adam17−/− humeri remain composed of only hypertrophic chondrocytes. (e) By E16.5, a POC is established in both wt and Adam17−/− mice, but the hypertrophic zone is expanded in mutant mice. (f) At E18.5, the zone of hypertrophic chondrocytes remains enlarged in Adam17−/− embryos compared to wt controls. Scale bar, 250 μm; inset scale bar, 100 μm.
Expansion of the hypertrophic zone is caused by conditional deletion of Adam17 in chondrocytes but not in osteoclasts or endothelial cells.
Since Adam17−/− mice die at birth, we generated mice lacking ADAM17 in chondrocytes (Adam17flox/flox/Col2a1-Cre [A17ΔCh] mice; see Materials and Methods for details) to assess the role of ADAM17 in these cells during postnatal endochondral ossification. A17ΔCh mice were born at the expected Mendelian ratio and were indistinguishable from their littermate controls (Adam17flox/flox lacking Col2a1-Cre) upon visual inspection and during routine handling (for A17ΔCh mice, n = 87 [51%]; controls, n = 82 [49%]; total n = 169). Alizarin red/alcian blue-stained whole-mount skeletons showed an enlarged hypertrophic zone in the scapulae of A17ΔCh mice compared to controls (Fig. 2a, arrows), similar to newborn Adam17−/− mice (Fig. 1a). Moreover, histological analysis revealed a significant expansion of the hypertrophic zone in the A17ΔCh humeri relative to those of wt littermates (Fig. 2b and c). No enlargement of the zone of hypertrophic cells was observed in mice expressing Col2a1-Cre with wt ADAM17 (data not shown).
Fig 2.

Conditional deletion of Adam17 in chondrocytes, but not in osteoclasts or endothelial cells, causes expansion of the hypertrophic zone. (a) Front limbs of newborn A17ΔCh and wt littermates stained with alcian blue (cartilage) and alizarin red (bone). Note the increased area of overlap between the two stains located at the COJ in the scapulae (arrows), humeri, radii, and ulnae. Scale bar, 1 mm. (b) Quantification of hypertrophic zones of humeri from wt (Adam17flox/flox-cre negative, 133.8 ± 20.5 μm, n = 9), A17ΔCh (Col2-cre+, 212.9 ± 33.1 μm, n = 11), A17ΔOC (LysM-cre+, 141.7 μm ± 15.4, n = 3), A17ΔCh/OC (Col2-cre+ and LysM-cre+, 239.6 μm ± 27.7, n = 3), A17ΔEC (Tie2-cre+, 166.0 μm ± 12.7, n = 2), and Tnfα−/− (142.8 ± 20.4 μm, n = 3) mice. Data are shown as averages ± SD. Comparisons between the other values indicate that the differences are not significant (NS). Littermate controls were independently measured for each genotype. However, as the measurements were not significantly different from those for the Adam17flox/flox-cre-negative controls, the individual control measurements are not shown. (c) Sections of humeri from newborn wt, A17ΔCh, A17ΔOC, A17ΔCh/OC, A17ΔEC, and Tnfα−/− animals, stained with H&E (top panel) or safranin O/fast green (lower panels). Vertical lines mark the hypertrophic zone. Scale bar, 250 μm. (d) Representative Western blot for ADAM17, phospho-EGFR, and ADAM9 on proteins isolated from primary cartilage of wt and A17ΔCh littermates. (e) Densitometric quantification of 3 Western blots (including those shown in panel d). The signal is shown normalized to levels of ADAM9, with wt signal set to 1. Data are averages ± SEM.
Several other cell types contribute to the formation of the growth plate in addition to chondrocytes, most prominently osteoclasts, endothelial cells, and osteoblasts. Since an enlarged growth plate could also be caused by a defect in osteoclast function, we analyzed the growth plates in mice lacking ADAM17 in myeloid cells (A17ΔMC), which give rise to osteoclasts and monocytes (41). No significant difference in the size of the hypertrophic zone was evident in A17ΔMC mice compared to controls at birth (Fig. 2b and c), even though ADAM17 is efficiently deleted from myeloid cells in these animals (41). Additionally, Adam17flox/flox animals carrying both LysM-Cre and Col2a1-Cre (A17ΔMC/Ch) to inactivate ADAM17 in the myeloid/osteoclast lineage and in chondrocytes had a zone of hypertrophic chondrocytes that was comparable to that of A17ΔCh mice (Fig. 2b and c). When we examined the growth plates of mice lacking ADAM17 in endothelial cells (A17ΔEC), we found no difference in the size of the hypertrophic zone compared to that of the controls (Fig. 2b and c), despite efficient deletion of ADAM17 in endothelial cells (29).
ADAM17 has been characterized as a principal sheddase for tumor necrosis factor alpha (TNF-α) and for several EGFR ligands (12, 15, 42–44). As noted in the introduction, previous studies have established a role for the EGFR and its ligand, TGFα, in endochondral ossification, but little is known about the role of TNF-α in this process. Therefore, we analyzed the growth plate of Tnfα−/− mice (45) but found no significant difference in the total size of the hypertrophic zone or the relative distribution of the different cell types compared to controls (Fig. 2b and c).
Western blot analysis of extracts of freshly isolated microdissected growth plates from humeri, femora, and tibiae of A17ΔCh mice (P2) confirmed a significant reduction in ADAM17 (Fig. 2d and e), along with a significant reduction in staining for the phosphorylated EGFR levels (Fig. 2d and e). ADAM9 served as a loading control.
Growth defect in long bones of A17ΔCh mice.
To learn more about postnatal endochondral ossification in A17ΔCh mice, we performed a histopathological analysis of the proximal humerus growth plate at P7, P14, and P21 and of the proximal tibia at P21 and in 20-week-old adults. The expanded zone of hypertrophic cells in the A17ΔCh humeri was clearly apparent at P7 and P14 but was comparable to that of controls at P21 (Fig. 3a). Tibiae from P21 A17ΔCh mice showed a significant expansion of the hypertrophic zone compared to controls (Fig. 3b), whereas the hypertrophic zone in the tibiae of 20-week-old A17ΔCh mice were indistinguishable from littermate controls (Fig. 3b). The growth plate and secondary ossification center of A17ΔMC, A17ΔEC, and Tnfα−/− mice also appeared normal at P21 (data not shown).
Fig 3.

Expanded zone of hypertrophic chondrocytes and shortened bones in A17ΔCh mice. (a) Histological sections from humeri of A17ΔCh and littermate controls at P7, P14, and P21 stained with safranin O/fast green. Scale bar, 50 μm. (b) Histological sections from tibiae of P14 and 20-week-old A17ΔCh and littermate control mice stained with safranin O/fast green. Scale bar, 250 μm. (c) Measurements of femurs and tibiae from P14, P21, and 20-week-old male mice. Data are shown as averages ± SD. P14, wt n = 2 and A17ΔCh n = 3; P21, wt n = 4 and A17ΔCh n = 5; adult, wt n = 8 and A17ΔCh n = 10. (d) Representative Faxitron images of humeri and tibiae from 20-week-old male mice show shorter bones in mutant mice than in wt controls. Scale, 1 mm.
When we measured the length of bones at different stages of development, we found that the long bones of A17ΔCh mice were significantly shorter than those of control mice starting at P14 and P21. The femora and tibiae of A17ΔCh adults (20 weeks old) were 5% shorter than those of littermate controls (Fig. 3c and d). However, there was no significant difference in the total weight of A17ΔCh mice compared to controls at any stage of development (data not shown).
Calcified cartilage within the growth plate is expanded in A17ΔCh mice.
To learn more about how ADAM17 in chondrocytes affects mineralization, tibiae from P21 A17ΔCh male mice and wt controls were analyzed by μCT imaging. No difference was noted in the trabecular or cortical bone between A17ΔCh and wt animals (Fig. 4a to c). Analysis of the calcified cartilage and the growth plate, defined as the space between the primary and secondary ossification centers, demonstrated that the expanded part of the hypertrophic zone is composed of calcified cartilage, whereas the nonmineralized parts of the growth plate were comparable in size between A17ΔCh mice and controls (Fig. 4d and e). In addition, the bone volume fraction (i.e., bone volume/total volume) was increased in the growth plates of A17ΔCh mice relative to controls (Fig. 4d).
Fig 4.

Expanded hypertrophic zone in A17ΔCh mice is caused by an increase in the area of mineralized cartilage. (a) Tibiae from P21 male mice were analyzed by μCT. Images show secondary center of ossification (SO), mineralized cartilage (MC), and trabecular bone (TB). Scale bar, 1 mm. (b) Trabecular parameters of A17ΔCh animals compared to wt controls show no significant differences in bone volume/total volume (BV/TV), trabecular number (Tb.N), trabecular thickness (Tb.Th), or trabecular spacing (Tb.Sp.) between the two genotypes. (c) Cortical thickness of A17ΔCh animals compared to controls shows no significant difference between the two genotypes. Data are averages ± SEM. (d) The TV of mineralized cartilage, which appears on μCT as a region of mineralized tissue of lower density than that of the trabecular bone, and the BV/TV of the mineralized cartilage was significantly increased in the A17ΔCh animals compared to those in the controls. (e) TV of nonmineralized cartilage was not significantly different between wt and A17ΔCh animals. Nonmineralized cartilage was measured as the area without signal between the mineralized cartilage and the secondary center of ossification. A17ΔCh, n = 5; wt, n = 3. (f and g) Safranin O/fast green (left) and von Kossa staining (right; black or brown color) of nondecalcified semiserial sections from P0.5 humeri of wt and Adam17−/− mice (f) or wt and A17ΔCh mice (g). Black lines indicate the length of the zone of hypertrophic chondrocytes, and red lines indicate the length of the mineralized portion of the hypertrophic zone. (h) FTIR of E18.5 Adam17−/− and wt littermates shown as mineral/matrix ratios. (i) Quantification of the FTIR scans of growth plates from 3 separate animals. Scale bars, 100 μm.
These findings were corroborated by a histological analysis of nondecalcified tissues, which revealed that the expanded area of hypertrophic chondrocytes in the growth plate of P0.5 Adam17−/− (Fig. 4f) and A17ΔCh (Fig. 4g) mice was positive for von Kossa staining, demonstrating that it is composed of mineralized matrix.
To learn how lack of ADAM17 affects matrix composition, we performed a Fourier transform infrared spectroscopic imaging analysis. This analysis provides a chemical photograph of the composition of the tissue. The compositional parameters were not significantly different when Adam17−/− mice were compared to the wt, but the FTIR images showed that the mutant bones had an abnormal epiphyseal composition, with mineral that appeared to extend further into the zone of hypertrophic cells in the growth plate (Fig. 4 h and i).
Evaluation of chondrocyte proliferation and apoptosis in Adam17−/− growth plates.
The increased number of hypertrophic chondrocytes in Adam17−/− mice could be caused by decreased apoptosis or increased proliferation. TUNEL staining at the COJ was comparable in Adam17−/− growth plates and controls (Fig. 5a and b), suggesting that decreased apoptosis is not the cause for the increased cell numbers. The strongest TUNEL staining was observed in the cortical bone adjacent to the hypertrophic chondrocytes in both wild-type and Adam17−/− growth plates. This zone was expanded in Adam17−/− bones, most likely because of the expanded zone of hypertrophic cells. In addition, we found no difference in metabolic labeling with the nucleotide 5-ethynyl-2′-deoxyuridine (EdU) in chondrocytes in all zones of the growth plate between Adam17−/− mice and controls (Fig. 5c and d). Together, these results indicate that the expanded hypertrophic zone in Adam17−/− growth plates is not caused by changes in chondrocyte proliferation or apoptosis.
Fig 5.

Assessment of apoptosis and proliferation in the growth plate. (a) TUNEL staining of humeri from P0.5 wt and Adam17−/− mice shows no difference in apoptosis in the Adam17−/− animals at the COJ. (b) Quantification of TUNEL staining. wt, n = 5; Adam17−/−, n = 5. (c) Representative images of EdU labeling of proliferating chondrocytes (red) merged with Hoechst staining of nuclei (blue). (d) Quantification of the proliferative index as described in Materials and Methods. wt, n = 8; Adam17−/−, n = 6. Data are averages ± SEM. Scale bars, 100 μm.
Analysis of the recruitment of osteoclasts, endothelial cells, and osteoblasts to the COJ.
Multinucleated osteoclasts migrate into the COJ, where they aid in the selective digestion of the chondrocyte-generated extracellular matrix in order to allow the synthesis of bone matrix by osteoblasts (46). Therefore, impaired osteoclastogenesis can lead to expanded hypertrophic zones in mice. When we assessed the number and location of osteoclasts in tibiae of newborn mice by tartrate-resistant acid phosphatase (TRAP) staining, we found no difference in the number of TRAP-positive cells at the COJ in Adam17−/− or A17ΔCh mice compared to those of their littermate controls, suggesting that ADAM17 is not required for recruitment of osteoclasts to the COJ at P0.5 (Fig. 6a and b). However, examination of P21 tibiae showed a significant reduction in TRAP-positive osteoclasts at the COJ in A17ΔCh mice relative to controls (Fig. 6c and d). Nevertheless, there was no significant difference in the concentration of collagen crosslaps in the serum (serum CTX) of A17ΔCh mice compared to controls, suggesting that overall osteoclast activity is comparable (Fig. 6e). Moreover, no significant difference in endomucin staining, which allows visualization of endothelial cells in bone (47), was observed at the COJ of Adam17−/− mice at P0.5 or in A17ΔCh mice at P21 compared to littermate controls, suggesting that the expanded hypertrophic zone is not caused by an inability to recruit endothelial cells to the COJ (Fig. 6f to i). Finally, there was no difference in osteoblast morphology, number, distribution, or location relative to trabeculae in the growth plate of newborn Adam17−/− mice or of A17ΔCh mice at P21 compared to their controls (data not shown).
Fig 6.

Osteoclast analysis at P0.5 and P21 indicates an osteoclast defect appearing after the development of the chondrocyte phenotype. (a) TRAP staining of osteoclasts at the COJ of wt and Adam17−/− mice at P0.5 (arrows point to TRAP+ cells). Scale bar, 50 μm. (b) Quantification of the results shown in panel a. Data are averages ± SEM. wt, n = 13; Adam17−/−, n = 13; wt, n = 4; A17ΔCh, n = 6. (c) TRAP+ osteoclasts at the COJ in tibiae of wt and A17ΔCh animals at P2. Scale bar, 100 μm. Inset scale bar, 50 μm. (d) Quantification of the results shown in panel c. Data are averages ± SEM. wt, n = 7; A17ΔCh, n = 5. (e) Collagen type I C-terminal telopeptide (CTX) values in serum of adult animals show no significant differences in cleaved collagen between the two genotypes. Data are averages ± SEM (wt, n = 4; A17ΔCh, n = 5). (f) Endomucin staining (red) of endothelial cells in P0.5 wt and Adam17−/− humeri. Hoechst staining (blue) is a nuclear counterstain. Scale bar, 100 μm. (g) Quantification of sections shown in panel f as described in Materials and Methods. Data are averages ± SEM (n = 5 for each wt and Adam17−/− animals). (h) Endomucin staining of endothelial cells in P21 wt and A17ΔCh animals. Scale bar, 250 μm. (i) Quantitation of the results shown in panel h. Data are averages ± SEM.
Chondrocyte-specific molecular signatures suggest that ADAM17 regulates terminal differentiation of chondrocytes.
To further characterize the differentiation status of the chondrocytes in the enlarged hypertrophic zone of P0.5 Adam17−/− mice, we performed in situ hybridization analysis for Col2a1 mRNA to visualize proliferating chondrocytes (Fig. 7a), Col10a1 and Mmp13 mRNA to define the zone of hypertrophic cells (Fig. 7b and c), and Runx2 as a marker for hypertrophic chondrocytes and osteoblasts (Fig. 7d). Col2a1 mRNA levels were comparable in Adam17−/− and wt mice, suggesting that the lack of ADAM17 does not affect the distribution of proliferating chondrocytes. However, the zone of Col10a1-expressing cells was strongly expanded in Adam17−/− mice, providing additional evidence that the terminally differentiated chondrocytes are most strongly affected by the lack of ADAM17. The analysis of Mmp13 mRNA indicated that its expression pattern adjacent to the hypertrophic chondrocytes at the COJ was similar in wt and Adam17−/− mice, although the Mmp13 expression appeared to be increased in chondrocytes closer to the cortical bone in Adam17−/− mice. Finally, the mRNA levels of the osteoblast marker Runx2 were comparable in Adam17−/− and wt bones.
Fig 7.

Expression of markers for chondrocyte differentiation in the growth plate. In situ hybridization for Col2a1 (a), Col10a1 (b), Mmp13 (c), and Runx2 (d) mRNA in sections from humeri of P0.5 wt and Adam17−/− animals. Scale bars in panels a, b, and d, 250 μm; scale bar in panel c, 100 μm. (e) Staining of growth plates of P0.5 wt and Adam17−/− humeri with antibodies against the collagen II 1C,2C neoepitope, which is generated through processing by collagenases. Scale bar, 100 μm.
To assess whether the lack of ADAM17 correlates with defective processing of type II collagen, the main structural component of cartilage, we performed immunohistochemical analysis of growth plates with an antibody against a type II collagen cleavage neo-epitope (C1,2C), which provides a readout for the processing of type II collagen. In wt growth plates, C1,C2-positive immunostaining was seen in hypertrophic chondrocytes, with the exception of the final layer of these cells immediately adjacent to the COJ. In Adam17−/− growth plates, there was only a thin layer of C1,C2-positive cells adjacent to the zone of proliferating chondrocytes, whereas the expanded zone of hypertrophic cells was C1,C2 negative (Fig. 7e).
Enhanced in vitro differentiation of hypertrophic chondrocytes lacking ADAM17.
To understand if the role of ADAM17 in the growth plate is cell type specific for chondrocytes, we examined how the loss of ADAM17 affects in vitro differentiation of murine primary chondrocytes to the terminal hypertrophic state using two different systems of in vitro hypertrophic differentiation: monolayer and pellet cultures. We first evaluated the differentiation of monolayer cultures from wt and Adam17−/− chondrocytes by alizarin red staining and by qRT-PCR analysis of Col10a1, Runx2, Vegfa, Mmp13, RankL, and Opg mRNA expression. Chondrocytes lacking ADAM17 displayed enhanced hypertrophic differentiation in vitro, as evidenced by the increased number of alizarin red-stained nodules after 4 weeks of differentiation, which could be completely prevented by adding soluble TGFα to knockout and wt cells (Fig. 8a and b). In addition, we found significantly increased Col10a1 and Runx2 levels after 3 weeks of differentiation (Fig. 8c and d) and significantly increased Vegfa expression after 4 weeks of differentiation (Fig. 8e) in the Adam17−/− chondrocytes compared to wt controls. Interestingly, Mmp13 and Opg expression levels were not significantly changed in Adam17−/− chondrocyte cultures relative to controls, whereas RankL levels were significantly decreased (Fig. 8f to h). Similarly, experiments performed in pellet cultures, which allow the cells to grow in a three-dimensional matrix (48; also see Materials and Methods for details), further confirmed that Col10a1, Runx2, Vegfa, and Ihh mRNA levels were significantly higher in 3-week-old Adam17−/− cultures than in wt controls (Fig. 8i to l). There was no difference in the expression of Hes/Hey, used as readouts for Notch signaling, or of Mmp9 or parathyroid hormone-related protein (Pthrp) (data not shown). The phosphorylation of SMAD1/5/8 was comparable in both wt and Adam17−/− chondrocytes (data not shown).
Fig 8.
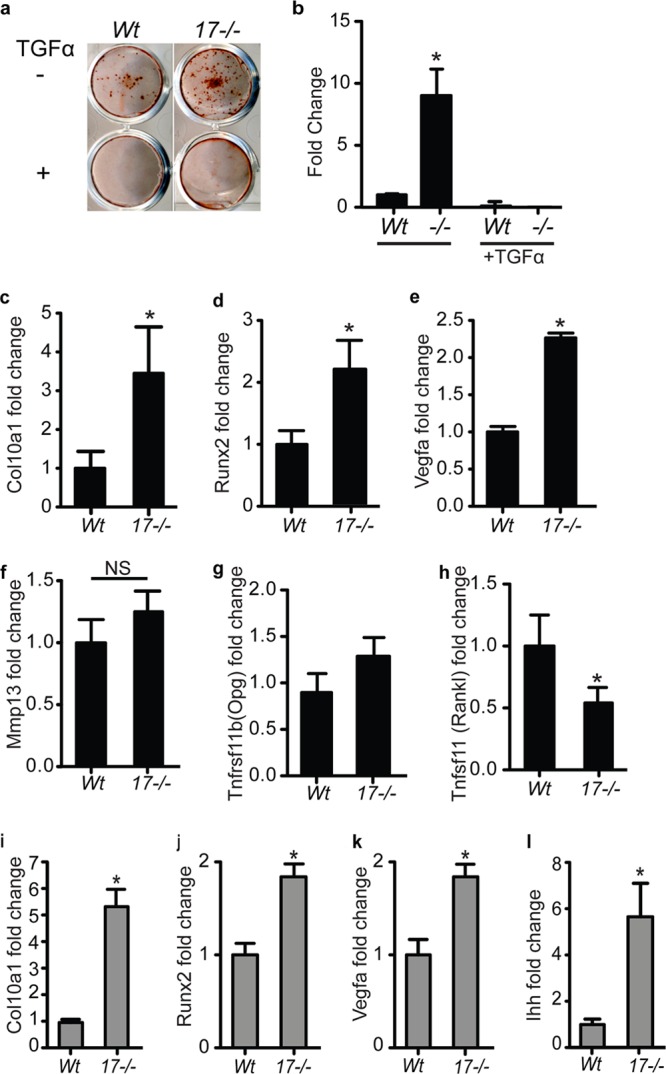
Increased in vitro hypertrophic differentiation of Adam17−/− chondrocytes in monolayer and pellet cultures. (a) Alizarin red staining of in vitro-differentiated primary chondrocytes after 4 weeks in culture revealed a greater number of nodules in Adam17−/− chondrocytes than in wt controls (results are representative of 4 separate experiments). Treatment with TGFα (10 ng/ml) completely abrogated nodule formation in wt and Adam17−/− chondrocytes. (b) Quantification of the results shown in panel a (see Materials and Methods for details), given as average (±SEM) fold increases compared to the wt control. (c to h) qRT-PCR analysis of RNA isolated from monolayer cultures for Col10a1 (c), Runx2 (d), Mmp13 (f), and Opg (g) expression at 3 weeks of culture and Vegfa (e) and Rankl (h) expression at 4 weeks. (i to l) qRT-PCR analysis of RNA isolated from 3-week-old pellet cultures for Col10a1 (i), Runx2 (j), Vegfa (k), and Ihh (l). Graphs with black bars are data from monolayer cultures; gray bars indicate experiments using pellet culture. Data are represented as averages ± SEM.
ADAM17 is the principal sheddase for TGFα and HB-EGF in primary chondrocytes.
Chondrocyte pellet cultures form a cartilage-like matrix over time; therefore, they provide an opportunity to assess the expression of EGFR ligands that are substrates for ADAM17 (HB-EGF, TGFα, amphiregulin, epiregulin, and epigen) or ADAM10 (EGF) in a more physiological system. Real-time PCR analysis of RNA isolated from 3-week-old pellet cultures revealed that HB-EGF expression (Fig. 9a) was higher than that of TGFα and EGF (Fig. 9b), whereas amphiregulin and epigen expression was not detectable under the conditions utilized in this study (data not shown). There was no difference in EGFR ligand expression between the Adam17−/− and wt pellets (Fig. 9a and b). We then attempted to detect shedding of endogenous TGFα or HB-EGF in the conditioned medium of wt and Adam17−/− pellet cultures after 3 weeks, but we found that the sensitivity of the enzyme-linked immunosorbent assays for these EGFR ligands was not sufficient for this purpose. Therefore, we monitored the release of transfected alkaline phosphatase-tagged TGFα, HB-EGF, or EGF into the supernatants of primary chondrocytes. The shedding of TGFα and HB-EGF from Adam17−/− chondrocytes was significantly reduced compared to that of wt controls, whereas the release of the ADAM10 substrate EGF was not affected (Fig. 9c).
Fig 9.
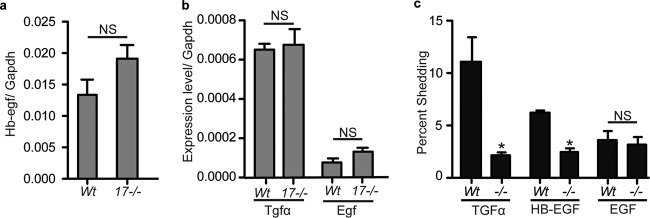
Expression and shedding of the EGFR ligands HB-EGF, TGFα, and EGF in wt and Adam17−/− chondrocytes in vitro. (a and b) qRT-PCR analysis of Hb-egf (a) and Tgfα and Egf (b) in 3-week-old pellet cultures of wt and Adam17−/− chondrocytes. (c) Shedding of alkaline phosphatase-tagged TGFα, HB-EGF, and EGF in Adam17−/− chondrocytes compared to controls. Data are averages ± SEM.
DISCUSSION
This study identified a critical role for ADAM17 in hypertrophic chondrocytes during endochondral ossification. The finding that Adam17−/− mice have an enlarged zone of hypertrophic chondrocytes could be recapitulated here by selective inactivation of Adam17 in chondrocytes but not by removing it from endothelial cells or osteoclasts. In mice lacking ADAM17 in chondrocytes, we observed an expansion of the most terminally differentiated type of mineralizing hypertrophic chondrocytes in the zone of provisional calcification, which normally occupies the area immediately adjacent to the COJ. This presumably resulted in improper remodeling of the mineralized matrix surrounding chondrocytes at the COJ and ultimately led to retarded growth of long bones.
The first part of this study focused on the characterization of bone development and endochondral ossification at different stages of embryogenesis in Adam17−/− mice up to the time of their perinatal lethality. Morphological abnormalities in the growth plate of Adam17−/− embryos could first be detected at E14.5, when humeri from Adam17−/− mice were filled with hypertrophic chondrocytes, with no evidence for the development of a primary ossification center (POC). A similar delay in the initiation of the POC has been reported in Egfr−/− mice (30). Nevertheless, a primary center of ossification develops with some delay in Adam17−/− bones, suggesting that these defects eventually can be overcome. At subsequent stages of bone development, Adam17−/− mice display an enlarged zone of hypertrophic cells, which is also clearly evident at birth.
To identify which cell types are the most important for the function of ADAM17 in the development of the pre- and postnatal growth plate, we conditionally inactivated Adam17 in chondrocytes (Col2a1-cre/A17ΔCh), in myeloid cells and osteoclasts (LysM-cre/A17ΔMC), or in endothelial cells (Tie2-Cre/A17ΔEC). We found that the zone of hypertrophic cells was strongly enlarged following inactivation of ADAM17 in chondrocytes but not when it was removed from endothelial cells or osteoclasts, highlighting that chondrocytes are most likely the cell type that requires ADAM17 during endochondral ossification. Previous studies have shown that the deletion of ADAM17 is very efficient in endothelial cells or myeloid cells using the same conditional knockout strains (28, 29), so the absence of a bone phenotype in A17ΔMC or A17ΔEC animals argues against a critical role for ADAM17 in these cell types in the growth plate. Additionally, we did not see any difference in the growth plates of Tnfα−/− mice compared to those of littermate controls, suggesting that the mechanism underlying the role of ADAM17 in bone growth does not depend on the shedding of TNF-α, which is a major function of ADAM17 (28, 42, 43). Finally, we did not observe any evident defects in osteoblasts in the growth plate of Adam17−/− mice, and osteoblasts cultured from A17ΔCh mice had normal levels of ADAM17 and developed normally, at least as measured by alkaline phosphatase production (data not shown). Although these experiments cannot rule out a contribution of ADAM17 in osteoblasts to the growth plate phenotype of A17ΔCh mice, they support the conclusion that the enlarged zone of hypertrophic cells is caused by the lack of a function of ADAM17 in chondrocytes.
Mice lacking TGFα, rats treated with the EGFR-inhibitor gefitinib, or mice carrying a mutant form of the EGFR or lacking the EGFR in chondrocytes all show similar increases in the zone of hypertrophic cells of the growth plate (8, 23, 49, 50). These studies are consistent with the notion that the abnormalities in endochondral ossification in A17ΔCh mice are caused by a defect in activation of the EGFR by the ADAM17 substrate and EGFR ligand TGFα. This model is further supported by our findings that TGFα and the ADAM17 substrate HB-EGF are expressed in chondrocytes, and that there is a defect in the proteolytic release of these two EGFR-ligands from Adam17-deficient chondrocytes.
Further histopathological evaluation showed that the loss of ADAM17 mainly affected a specialized subset of cells in the growth plate of mutant mice, the mineralizing hypertrophic chondrocytes. In newborn mice, the expanded layer of hypertrophic chondrocytes showed reduced staining with an antibody that detects collagen cleavage sites generated by collagenases such as MMP13. Moreover, the mineralized matrix surrounding hypertrophic chondrocytes extended much further into the zone of hypertrophic cells in Adam17−/− and A17ΔCh mice than in wt controls and appeared to encompass the entire expanded region in these animals. Only the most distal row of terminally differentiated hypertrophic chondrocytes is usually mineralized in wt animals, which suggests that the chondrocytes in the enlarged hypertrophic zone in Adam17−/− and A17ΔCh mice represent additional layers of the most terminally differentiated mineralizing hypertrophic chondrocytes. These observations were confirmed by μCT analysis of young adult animals at P21. Overall, the three-dimensional volume of the growth plate tissue, which includes all nonmineralized chondrocytes (resting, proliferating, and majority hypertrophic) but excludes the mineralizing hypertrophic cells, was not significantly different between wt and A17ΔCh mice. However, the volume of the area of calcified cartilage was almost doubled in A17ΔCh mice and had an increased density of signal per area, demonstrating increased mineralization in knockouts compared to wt controls. FTIR analysis demonstrated that the composition of the mineral of the trabecular bone was comparable between A17ΔCh and wt mice, although the distribution of the mineral around hypertrophic cells appeared to differ.
Interestingly, there was no augmented mineralization in the enlarged zone of hypertrophic cells in the growth plate in gefitinib-treated rats (7). This finding could be explained by species-specific differences in the role of the EGFR in matrix mineralization in the zone of hypertrophic chondrocytes, although it is also possible that pharmacological inhibition does not completely recapitulate the consequences of genetic inactivation of this pathway. The hypothesis that ADAM17 regulates the mineralization of hypertrophic chondrocytes by activating the EGFR in chondrocytes is further supported by a study demonstrating that EgfrΔCh mice have an enlarged zone of hypertrophic chondrocytes that resembles that observed in A17ΔCh mice (49).
There could be several explanations for the increased size of the layer of mineralizing hypertrophic chondrocytes in the absence of ADAM17, including increased proliferation or decreased apoptosis. However, we found no evidence for either mechanism, suggesting that ADAM17-deficient hypertrophic chondrocytes either synthesize more mineralizable matrix or are unable to remodel the mineralizing matrix to allow vascularization. The comparable number and spacing of TRAP-positive osteoclasts adjacent to the COJ in newborn Adam17−/− mice and wt controls, together with a similar distribution and spacing of endothelial cells and osteoblasts, argues against a major defect in the recruitment of these three cell types to the COJ when ADAM17 is lost at this stage. Nevertheless, we cannot unequivocally rule out an impairment of the function of the endothelial cells, osteoclasts, or osteoblasts at the COJ. In young adult A17ΔCh mice, there was a reduction in the number of osteoclasts at the COJ, which is consistent with the reduced expression of RANKL and increased OPG production after long-term culture of Adam17−/− chondrocytes, as also described by Saito et al. (49). However, the resulting reduction in osteoclast recruitment most likely was not the primary cause of the increased size of the zone of hypertrophic cells, as this was already clearly present at P0.5, when the number of osteoclasts at the COJ appeared normal in mutant mice. The finding of similar levels of serum crosslaps in A17ΔCh mice compared to controls suggests that overall osteoclast activity was not significantly affected by the loss of ADAM17 in chondrocytes.
The increase in alizarin red-stained nodules in long-term cultures of isolated Adam17−/− chondrocytes is an indicator of enhanced hypertrophic differentiation (51) and suggests that the defect is chondrocyte specific. This hypothesis is further supported by the increase in the expression of Col10a1, Runx2, and Vegfa in monolayer culture and in 3-dimensional cultures of Adam17−/− chondrocytes compared to controls. The increased in vitro differentiation was blocked by addition of soluble TGFα to both wt and knockout primary chondrocytes, demonstrating that gain-of-function experiments (adding the soluble cleavage product that is released by ADAM17) have the opposite effect of loss-of-function experiments (inactivation of the TGFα sheddase ADAM17). The comparable expression of Hes/Hey, indicators of Notch signaling, and similar phosphorylation of Smad1/5/8, used to monitor BMP signaling, argue against a role for ADAM17 in Notch or BMP signaling in chondrocytes.
Taken together, these results are consistent with a model in which a chondrocyte-specific defect in Adam17−/− mineralizing hypertrophic chondrocytes affects the remodeling of the calcified matrix surrounding the final layers of hypertrophic chondrocytes, most likely because of a lack of TGFα/EGFR signaling and reduced production of matrix-remodeling collagenases. Thus, the main role of ADAM17 in endochondral ossification apparently is to control the function of the most terminally differentiated hypertrophic chondrocytes in the growth plate. Since the enlarged zone of hypertrophic chondrocytes in the growth plate of A17ΔCh mice resembles that of Tgfα−/− mice and of mice and rats with genetic or pharmacological inhibition of EGFR signaling, ADAM17 most likely functions as an upstream regulator of EGFR signaling by controlling the release of TGFα, one of its principal substrates, from hypertrophic chondrocytes. In the absence of ADAM17, the most terminally differentiated mineralizing hypertrophic chondrocytes accumulate, giving rise to an enlarged calcified zone of hypertrophic cells. At later stages of development, this phenotype is presumably further exacerbated by decreased recruitment of osteoclasts to the COJ. The result is retardation in long bone growth, most likely caused by delayed or defective remodeling of the growth plate. It is worth noting that several types of EGFR inhibitors are already approved for treatment of cancer, and ADAM17 is considered a good target for treatment of EGFR- and TNF-α-dependent pathologies. Therefore, the finding that ADAM17/EGFR signaling affects the function of chondrocytes and, thus, bone and cartilage homeostasis raises interesting questions regarding the possible indication or contraindication of these treatments in the context of degenerative joint diseases, such as osteoarthritis and rheumatoid arthritis.
ACKNOWLEDGMENTS
This work was supported by National Institutes of Health grants 5T32AR007281-28 (musculoskeletal training grant to K.C.H.), R01-GM64750 (C.B.), R01-AG022021 and RC4-AR060546 (M.B.G.), R01-CA159222 (H.C.C.), 2R01 HD043997 (L.S.), and AR046121 (HSS Musculoskeletal Integrity Core Center). This investigation was conducted in a facility constructed with support from Research Facilities Improvement Program grant number C06-RR12538-01 from the National Center for Research Resources, National Institutes of Health.
We thank Elin Mogollon for excellent technical assistance, Kyung-Hyun Park-Min from Lionel Ivashkiv's laboratory for performing crosslap analysis, Sebastien Monette for analysis of osteoblast appearance and distribution in sections of Adam17−/− and A17ΔCh bones, and Jane Lian for input and suggestions.
Footnotes
Published ahead of print 3 June 2013
REFERENCES
- 1.Karsenty G, Wagner EF. 2002. Reaching a genetic and molecular understanding of skeletal development. Dev. Cell 2:389–406 [DOI] [PubMed] [Google Scholar]
- 2.Kronenberg HM. 2003. Developmental regulation of the growth plate. Nature 423:332–336 [DOI] [PubMed] [Google Scholar]
- 3.Schneider MR, Sibilia M, Erben RG. 2009. The EGFR network in bone biology and pathology. Trends Endocrinol. Metab. 20:517–524 [DOI] [PubMed] [Google Scholar]
- 4.Stickens D, Behonick DJ, Ortega N, Heyer B, Hartenstein B, Yu Y, Fosang AJ, Schorpp-Kistner M, Angel P, Werb Z. 2004. Altered endochondral bone development in matrix metalloproteinase 13-deficient mice. Development 131:5883–5895 [DOI] [PMC free article] [PubMed] [Google Scholar]
- 5.Yarden Y, Sliwkowski MX. 2001. Untangling the ErbB signalling network. Nat. Rev. Mol. Cell Biol. 2:127–137 [DOI] [PubMed] [Google Scholar]
- 6.Sibilia M, Wagner B, Hoebertz A, Elliott C, Marino S, Jochum W, Wagner EF. 2003. Mice humanised for the EGF receptor display hypomorphic phenotypes in skin, bone and heart. Development 130:4515–4525 [DOI] [PubMed] [Google Scholar]
- 7.Wang K, Yamamoto H, Chin JR, Werb Z, Vu TH. 2004. Epidermal growth factor receptor-deficient mice have delayed primary endochondral ossification because of defective osteoclast recruitment. J. Biol. Chem. 279:53848–53856 [DOI] [PMC free article] [PubMed] [Google Scholar]
- 8.Zhang X, Siclari VA, Lan S, Zhu J, Koyama E, Dupuis HL, Enomoto-Iwamoto M, Beier F, Qin L. 2011. The critical role of the epidermal growth factor receptor in endochondral ossification. J. Bone Miner. Res. 26:2622–2633 [DOI] [PMC free article] [PubMed] [Google Scholar]
- 9.Blobel CP. 2005. ADAMs: key players in EGFR-signaling, development and disease. Nat. Rev. Mol. Cell Biol. 6:32–43 [DOI] [PubMed] [Google Scholar]
- 10.Harris RC, Chung E, Coffey RJ. 2003. EGF receptor ligands. Exp. Cell Res. 284:2–13 [DOI] [PubMed] [Google Scholar]
- 11.Sahin U, Blobel CP. 2007. Ectodomain shedding of the EGF-receptor ligand epigen is mediated by ADAM17. FEBS Lett. 581:41–44 [DOI] [PubMed] [Google Scholar]
- 12.Sahin U, Weskamp G, Zhou HM, Higashiyama S, Peschon JJ, Hartmann D, Saftig P, Blobel CP. 2004. Distinct roles for ADAM10 and ADAM17 in ectodomain shedding of six EGFR-ligands. J. Cell Biol. 164:769–779 [DOI] [PMC free article] [PubMed] [Google Scholar]
- 13.Sanderson MP, Erickson SN, Gough PJ, Garton KJ, Wille PT, Raines EW, Dunbar AJ, Dempsey PJ. 2005. ADAM10 mediates ectodomain shedding of the betacellulin precursor activated by p-aminophenylmercuric acetate and extracellular calcium influx. J. Biol. Chem. 280:1826–1837 [DOI] [PubMed] [Google Scholar]
- 14.Miettinen PJ, Berger JE, Meneses J, Phung Y, Pedersen RA, Werb Z, Derynck R. 1995. Epithelial immaturity and multiorgan failure in mice lacking epidermal growth factor receptor. Nature 376:337–341 [DOI] [PubMed] [Google Scholar]
- 15.Peschon JJ, Slack JL, Reddy P, Stocking KL, Sunnarborg SW, Lee DC, Russel WE, Castner BJ, Johnson RS, Fitzner JN, Boyce RW, Nelson N, Kozlosky CJ, Wolfson MF, Rauch CT, Cerretti DP, Paxton RJ, March CJ, Black RA. 1998. An essential role for ectodomain shedding in mammalian development. Science 282:1281–1284 [DOI] [PubMed] [Google Scholar]
- 16.Shi W, Chen H, Sun J, Buckley S, Zhao J, Anderson KD, Williams RG, Warburton D. 2003. TACE is required for fetal murine cardiac development and modeling. Dev. Biol. 261:371–380 [DOI] [PubMed] [Google Scholar]
- 17.Sibilia M, Wagner EF. 1995. Strain-dependent epithelial defects in mice lacking the EGF receptor. Science 269:234–238 (Erratum, 269:909) [DOI] [PubMed] [Google Scholar]
- 18.Threadgill DW, Dlugosz AA, Hansen LA, Tennenbaum T, Lichti U, Yee D, LaMantia C, Mourton T, Herrup K, Harris RC, Barnard JA, Yuspa SH, Coffey RJ, Magnuson T.1995. Targeted disruption of mouse EGF receptor: effect of genetic background on mutant phenotype. Science 269:230–234. [DOI] [PubMed] [Google Scholar]
- 19.Zhao J, Chen H, Peschon JJ, Shi W, Zhang Y, Frank SJ, Warburton D. 2001. Pulmonary hypoplasia in mice lacking tumor necrosis factor-alpha converting enzyme indicates an indispensable role for cell surface protein shedding during embryonic lung branching morphogenesis. Dev. Biol. 232:204–218 [DOI] [PubMed] [Google Scholar]
- 20.Franzke C-W, Cobzaru C, Triantafyllopoulou A, Loffek S, Horiuchi K, Threadgill DW, Kurz T, van Rooijen N, Bruckner-Tuderman L, Blobel CP. 2012. Epidermal ADAM17 maintains the skin barrier by regulating EGFR ligand-dependent terminal keratinocyte differentiation. J. Exp. Med. 209:1105–1119 [DOI] [PMC free article] [PubMed] [Google Scholar]
- 21.Groot AJ, Cobzaru C, Weber S, Saftig P, Blobel CP, Kopan R, Voojs M, Franzke C-W. 3 April 2013. Epidermal ADAM17 is dispensable for Notch activation. J. Investig. Dermatol. [Epub ahead of print] 10.1038/jid.2013.162 [DOI] [PMC free article] [PubMed] [Google Scholar]
- 22.Chalaris A, Adam N, Sina C, Rosenstiel P, Lehmann-Koch J, Schirmacher P, Hartmann D, Cichy J, Gavrilova O, Schreiber S, Jostock T, Matthews V, Hasler R, Becker C, Neurath MF, Reiss K, Saftig P, Scheller J, Rose-John S. 2010. Critical role of the disintegrin metalloprotease ADAM17 for intestinal inflammation and regeneration in mice. J. Exp. Med. 207:1617–1624 [DOI] [PMC free article] [PubMed] [Google Scholar]
- 23.Usmani SE, Pest MA, Kim G, Ohora SN, Qin L, Beier F. 2012. Transforming growth factor alpha controls the transition from hypertrophic cartilage to bone during endochondral bone growth. Bone 51:131–141 [DOI] [PubMed] [Google Scholar]
- 24.Boissy P, Lenhard TR, Kirkegaard T, Peschon JJ, Black RA, Delaisse JM, del Carmen Ovejero M. 2003. An assessment of ADAMs in bone cells: absence of TACE activity prevents osteoclast recruitment and the formation of the marrow cavity in developing long bones. FEBS Lett. 553:257–261 [DOI] [PubMed] [Google Scholar]
- 25.Horiuchi K, Kimura T, Miyamoto T, Miyamoto K, Akiyama H, Takaishi H, Morioka H, Nakamura T, Okada Y, Blobel CP, Toyama Y. 2009. Conditional inactivation of TACE by a Sox9 promoter leads to osteoporosis and increased granulopoiesis via dysregulation of IL-17 and G-CSF. J. Immunol. 182:2093–2101 [DOI] [PMC free article] [PubMed] [Google Scholar]
- 26.Schlöndorff J, Becherer JD, Blobel CP. 2000. Intracellular maturation and localization of the tumour necrosis factor alpha convertase (TACE). Biochem. J. 347(Part 1):131–138 [PMC free article] [PubMed] [Google Scholar]
- 27.Ovchinnikov DA, Deng JM, Ogunrinu G, Behringer RR. 2000. Col2a1-directed expression of Cre recombinase in differentiating chondrocytes in transgenic mice. Genesis 26:145–146 [PubMed] [Google Scholar]
- 28.Horiuchi K, Kimura T, Miyamoto T, Takaishi H, Okada Y, Toyama Y, Blobel CP. 2007. Cutting edge: TNF-α-converting enzyme (TACE/ADAM17) inactivation in mouse myeloid cells prevents lethality from endotoxin shock. J. Immunol. 179:2686–2689 [DOI] [PubMed] [Google Scholar]
- 29.Weskamp G, Mendelson K, Swendeman S, Le Gall S, Ma Y, Lyman S, Hinoki A, Eguchi S, Guaiquil V, Horiuchi K, Blobel CP. 2010. Pathological neovascularization is reduced by inactivation of ADAM17 in endothelial cells but not in pericytes. Circ. Res. 106:932–940 [DOI] [PMC free article] [PubMed] [Google Scholar]
- 30.McLeod MJ. 1980. Differential staining of cartilage and bone in whole mouse fetuses by alcian blue and alizarin red S. Teratology 22:299–301 [DOI] [PubMed] [Google Scholar]
- 31.Hyde G, Dover S, Aszodi A, Wallis GA, Boot-Handford RP. 2007. Lineage tracing using matrilin-1 gene expression reveals that articular chondrocytes exist as the joint interzone forms. Dev. Biol. 304:825–833 [DOI] [PMC free article] [PubMed] [Google Scholar]
- 32.Gagnon ML, Angerer LM, Angerer RC. 1992. Posttranscriptional regulation of ectoderm-specific gene expression in early sea urchin embryos. Development 114:457–467 [DOI] [PubMed] [Google Scholar]
- 33.Rajpar MH, McDermott B, Kung L, Eardley R, Knowles L, Heeran M, Thornton DJ, Wilson R, Bateman JF, Poulsom R, Arvan P, Kadler KE, Briggs MD, Boot-Handford RP. 2009. Targeted induction of endoplasmic reticulum stress induces cartilage pathology. PLoS Genet. 5:e1000691. 10.1371/journal.pgen.1000691 [DOI] [PMC free article] [PubMed] [Google Scholar]
- 34.Plumb DA, Ferrara L, Torbica T, Knowles L, Mironov A, Jr, Kadler KE, Briggs MD, Boot-Handford RP. 2011. Collagen XXVII organises the pericellular matrix in the growth plate. PLoS One 6:e29422. 10.1371/journal.pone.0029422 [DOI] [PMC free article] [PubMed] [Google Scholar]
- 35.Bouxsein ML, Boyd SK, Christiansen BA, Guldberg RE, Jepsen KJ, Muller R. 2010. Guidelines for assessment of bone microstructure in rodents using micro-computed tomography. J. Bone Miner. Res. 25:1468–1486 [DOI] [PubMed] [Google Scholar]
- 36.Boskey AL, Gelb BD, Pourmand E, Kudrashov V, Doty SB, Spevak L, Schaffler MB. 2009. Ablation of cathepsin k activity in the young mouse causes hypermineralization of long bone and growth plates. Calcif. Tissue Int. 84:229–239 [DOI] [PMC free article] [PubMed] [Google Scholar]
- 37.McIlwain DR, Lang PA, Maretzky T, Hamada K, Ohishi K, Maney SK, Berger T, Murthy A, Duncan G, Xu HC, Lang KS, Haussinger D, Wakeham A, Itie-Youten A, Khokha R, Ohashi PS, Blobel CP, Mak TW. 2012. iRhom2 regulation of TACE controls TNF-mediated protection against Listeria and responses to LPS. Science 335:229–232 [DOI] [PMC free article] [PubMed] [Google Scholar]
- 38.Weskamp G, Krätzschmar J, Reid MS, Blobel CP. 1996. MDC9, a widely expressed cellular disintegrin containing cytoplasmic SH3 ligand domains. J Cell Biol. 132:717–726 [DOI] [PMC free article] [PubMed] [Google Scholar]
- 39.Gosset M, Berenbaum F, Thirion S, Jacques C. 2008. Primary culture and phenotyping of murine chondrocytes. Nat. Protoc. 3:1253–1260 [DOI] [PubMed] [Google Scholar]
- 40.Sahin U, Weskamp G, Zheng Y, Chesneau V, Horiuchi K, Blobel CP. 2006. A sensitive method to monitor ectodomain shedding of ligands of the epidermal growth factor receptor, p 99–113 In Patel TB, Bertics PJ. (ed), Epidermal growth factor: methods and protocols, vol 327 Humana Press Inc., Totowa, NJ: [DOI] [PubMed] [Google Scholar]
- 41.Clausen BE, Burkhardt C, Reith W, Renkawitz R, Forster I. 1999. Conditional gene targeting in macrophages and granulocytes using LysMcre mice. Transgenic Res. 8:265–277 [DOI] [PubMed] [Google Scholar]
- 42.Black R, Rauch CT, Kozlosky CJ, Peschon JJ, Slack JL, Wolfson MF, Castner BJ, Stocking KL, Reddy P, Srinivasan S, Nelson N, Boiani N, Schooley KA, Gerhart M, Davis R, Fitzner JN, Johnson RS, Paxton RJ, March CJ, Cerretti DP. 1997. A metalloprotease disintegrin that releases tumour-necrosis factor-a from cells. Nature 385:729–733 [DOI] [PubMed] [Google Scholar]
- 43.Moss ML, Jin S-LC, Milla ME, Burkhart W, Cartner HL, Chen W-J, Clay WC, Didsbury JR, Hassler D, Hoffman CR, Kost TA, Lambert MH, Lessnitzer MA, McCauley P, McGeehan G, Mitchell J, Moyer M, Pahel G, Rocque W, Overton LK, Schoenen F, Seaton T, Su J-L, Warner J, Willard D, Becherer JD. 1997. Cloning of a disintegrin metalloproteinase that processes precursor tumour-necrosis factor-a. Nature 385:733–736 [DOI] [PubMed] [Google Scholar]
- 44.Sunnarborg SW, Hinkle CL, Stevenson M, Russell WE, Raska CS, Peschon JJ, Castner BJ, Gerhart MJ, Paxton RJ, Black RA, Lee DC. 2002. Tumor necrosis factor-alpha converting enzyme (TACE) regulates epidermal growth factor receptor ligand availability. J. Biol. Chem. 277:12838–12845 [DOI] [PubMed] [Google Scholar]
- 45.Pasparakis M, Alexopoulou L, Episkopou V, Kollias G. 1996. Immune and inflammatory responses in TNF alpha-deficient mice: a critical requirement for TNF alpha in the formation of primary B cell follicles, follicular dendritic cell networks and germinal centers, and in the maturation of the humoral immune response. J. Exp. Med. 184:1397–1411 [DOI] [PMC free article] [PubMed] [Google Scholar]
- 46.Mackie EJ, Ahmed YA, Tatarczuch L, Chen KS, Mirams M. 2008. Endochondral ossification: how cartilage is converted into bone in the developing skeleton. Int. J. Biochem. Cell Biol. 40:46–62 [DOI] [PubMed] [Google Scholar]
- 47.Matsubara A, Iwama A, Yamazaki S, Furuta C, Hirasawa R, Morita Y, Osawa M, Motohashi T, Eto K, Ema H, Kitamura T, Vestweber D, Nakauchi H. 2005. Endomucin, a CD34-like sialomucin, marks hematopoietic stem cells throughout development. J. Exp. Med. 202:1483–1492 [DOI] [PMC free article] [PubMed] [Google Scholar]
- 48.Otero M, Favero M, Dragomir C, Hachem KE, Hashimoto K, Plumb DA, Goldring MB. 2012. Human chondrocyte cultures as models of cartilage-specific gene regulation. Methods Mol. Biol. 806:301–336 [DOI] [PubMed] [Google Scholar]
- 49.Saito K, Horiuchi K, Kimura T, Mizuno S, Yoda M, Morioka H, Akiyama H, Threadgill D, Okada Y, Toyama Y, Sato K. 2013. Conditional inactivation of TNFalpha-converting enzyme in chondrocytes results in an elongated growth plate and shorter long bones. PLoS One 8:e54853. 10.1371/journal.pone.0054853 [DOI] [PMC free article] [PubMed] [Google Scholar]
- 50.Zhang X, Tamasi J, Lu X, Zhu J, Chen H, Tian X, Lee TC, Threadgill DW, Kream BE, Kang Y, Partridge NC, Qin L. 2011. Epidermal growth factor receptor plays an anabolic role in bone metabolism in vivo. J. Bone Miner. Res. 26:1022–1034 [DOI] [PMC free article] [PubMed] [Google Scholar]
- 51.Hirata M, Kugimiya F, Fukai A, Ohba S, Kawamura N, Ogasawara T, Kawasaki Y, Saito T, Yano F, Ikeda T, Nakamura K, Chung UI, Kawaguchi H. 2009. C/EBPbeta promotes transition from proliferation to hypertrophic differentiation of chondrocytes through transactivation of p57. PLoS One 4:e4543. 10.1371/journal.pone.0004543 [DOI] [PMC free article] [PubMed] [Google Scholar]