CovaRNA and CovStat were developed to detect long-range covariation on a genomic scale and to determine the statistical significance of observed covariation patterns in alignment pairs. A genome-wide all-versus-all search for nucleotide covariation in Drosophila genomic alignments is presented. The results suggest that RNA–RNA long-range interactions are a widespread phenomenon.
Keywords: Drosophila, RNA–RNA, covariation, interaction network, long-range interactions
Abstract
Functionally important nucleotide base-pairing often manifests itself in sequence alignments in the form of compensatory base changes (covariation). We developed a novel index-based computational method (CovaRNA) to detect long-range covariation on a genomic scale, as well as another computational method (CovStat) for determining the statistical significance of observed covariation patterns in alignment pairs. Here we present an all-versus-all search for nucleotide covariation in Drosophila genomic alignments. The search is genome wide, with the restriction that only alignments that correspond to euchromatic regions, which consist of at least 10 Drosophila species, are being considered (59% of the euchromatic genome of Drosophila melanogaster). We find that long-range covariations are especially prevalent between exons of mRNAs as well as noncoding RNAs; the majority of the observed covariations appear as not reverse complementary, but as synchronized mutations, which could be due to interactions with common interaction partners or due to the involvement of genomic elements that are antisense of annotated transcripts. The involved genes are enriched for functions related to regionalization as well as neural and developmental processes. These results are computational evidence that RNA–RNA long-range interactions are a widespread phenomenon that is of fundamental importance to a variety of cellular processes.
INTRODUCTION
The increase in appreciation of the role of RNA in biological processes is staggering: From an initial view of RNAs playing a variety of roles (in the forms of tRNA, rRNA, mRNA) in protein production, it is now apparent, that—in the case of the human genome—the majority of genomic information is transcribed into RNAs (Derrien et al. 2012; Dunham et al. 2012). Although the functional annotation of RNAs is not as mature as compared with proteins, it seems likely that RNAs play fundamental roles in a large number of cellular processes, in particular in the development of multicellular organisms (Lozada-Chavez et al. 2011). It also has been found that RNA–RNA interactions play critical roles in a variety of processes such as post-transcriptional gene regulation (Fire et al. 1998), splicing (Will and Lührmann 2011), and transport (Jambor et al. 2011). In this work we present a computational pipeline that corresponds to a whole-genome all-versus-all bioinformatics search for potential RNA–RNA interactions applied to the genome of Drosophila melanogaster (and several aligned insect genomes). The goal is to obtain an initial version of an RNA–RNA interaction network.
An RNA base-pair interaction that is conserved among several related species means that at the two corresponding genomic positions there is a bias toward A-U and G-C (and G-U “wobble”) compared with other nucleotide pairs. This can lead to a characteristic signature in a multiple sequence alignment called covariation (Bindewald and Shapiro 2006; Bindewald et al. 2006) . Several programs for predicting nonlocal RNA–RNA interactions have been described. RNA–RNA prediction programs use as input either pairs of single nucleotide sequences (Tafer and Hofacker 2008; Huang et al. 2009c,d; Kato et al. 2010; Salari et al. 2010; Seemann et al. 2010a,b) or two multiple sequence alignments (Bernhart et al. 2006; Seemann et al. 2008, 2010a,b). Methods for computing consensus RNA secondary structures given unaligned homologous sequences have been described for the case of intramolecular structure, but to our knowledge, not for the case of RNA–RNA interactions.
We created a novel program, called CovaRNA, which allows the high-throughput detection of long-range nucleotide covariation from genomic multiple sequence alignments. The results of this program are analyzed by a program, CovStat, that computes a measure of statistical significance for the observed nucleotide bias in alignment pairs. The resulting RNA–RNA interaction network is then analyzed with respect to various aspects, such as existing functional annotations.
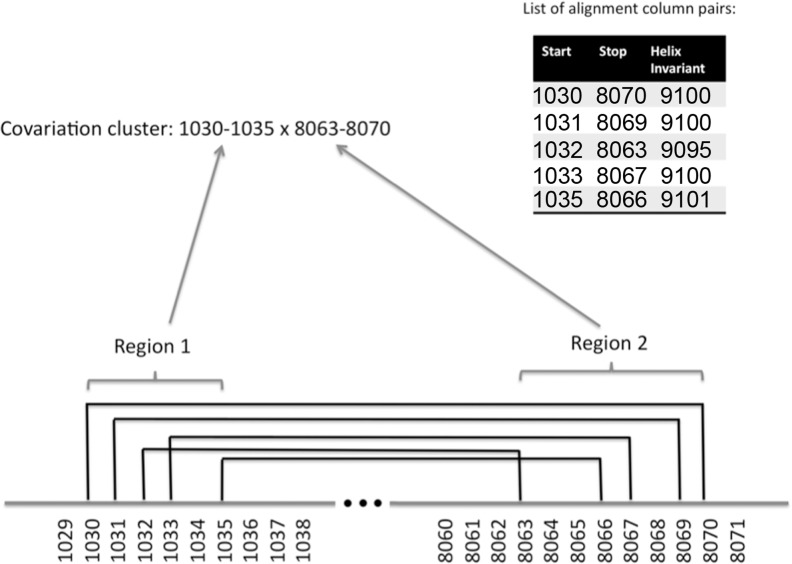
The key idea of the CovaRNA approach of a fast index-based scanning for long-range covariation is that a pair of covarying alignment columns can be viewed as two complementary sequences, each having a length equal to the number of rows in a sequence alignment. Detecting a pair of covarying alignment columns can thus be accomplished by using the sequence complement of one column as a query in a database of all considered alignment columns. Found covarying column pairs are grouped into clusters (called covariation clusters) (Fig. 1). Each covariation cluster corresponds to two genomic regions with potential covariation between them. With this method it is possible to perform an all-versus-all search, including searches for covariation between regions belonging to different chromosomes or chromosome arms; also, one can search for nucleotide covariation assuming the same or opposite strand directionality of the two involved genomic loci.
FIGURE 1.
Hypothetical example of a covariation cluster. Shown is a hypothetical chromosome with locations on that chromosome indicated by their nucleotide positions. A covariation cluster is a set of alignment column pairs with covariations that are grouped together by a clustering algorithm. Each alignment column pair with covariation is characterized by two genomic positions (called start and stop position) as well as the “helix invariant” (the sum of their respective start and stop positions—see Materials and Methods). In this hypothetical example, there are five column pairs with covariation (they are listed in the table embedded at the top-right of the figure; they are also depicted via black lines connecting the respective start and stop positions). Each covariation cluster consists of two genomic regions (called Region 1 and Region 2). Several conditions have to be fulfilled for a covariation cluster: (1) A covariation cluster has to contain at least five alignment column pairs with covariation; (2) the distance between the two genomic regions (in this example the distance between Region 1 and Region 2 is 8063–1035 = 7028) has to be at least 6000 nt; (3) the “difference” between the total number of covarying alignment column pairs of the cluster (in this example there are five alignment column pairs with covariation) and the number of “different” helix invariants (in this example there are three different helix invariants: 9095, 9100, 9101) has to be two units or larger; (4) the individual genomic regions have to have a minimum length of 5 nt (in this example the lengths of Regions 1 and 2 are 6 nt and 8 nt, respectively; in other words, in this example the covariation cluster would pass this particular filter criterion). The clustering algorithm (a single-linkage clustering) ensures that for every alignment column of a covarying alignment column pair there exists at least one other alignment column that belongs to another alignment column pair of the same cluster, such that their genomic positions differ by not more than 40 nt. Note that the two regions of a covariation cluster can be located on the same chromosome or on different chromosomes. Subsequent computational filtering stages are described in the subsection “Data processing steps” (Materials and Methods).
In a subsequent computational stage, a novel statistics-based method called CovStat is applied to this initial low-confidence covariation network. This method consists of two algorithms and each of them results in a P-value that indicates the probability that the observed correlated mutations spanning two genomic regions could have been observed by chance under the assumption that the two regions are independent. Briefly, these two measures are (1) a measure for a bias of alignment columns with covariation to be arranged such that they appear to correspond to the same helix; (2) a measure for how unusual it is to observe this many covarying alignment column pairs spanning the two involved genomic alignment regions. The resulting covariation clusters are then further analyzed with respect to existing gene annotation data; this strategy leads to several putative RNA–RNA interaction networks.
RESULTS
We applied the CovaRNA method to all regions of the genomic multiple sequence alignments consisting of genomic information corresponding to 12 Drosophila species in an all-versus-all manner (including intronic and intergenic regions) (Clark et al. 2007; Stark et al. 2007). Only alignment blocks consisting of at least 10 different Drosophila species were considered; the considered aligned regions correspond to 59% of the Drosophila melanogaster genome. The search results in a set of 2,917,973 covariation clusters (Fig. 2).
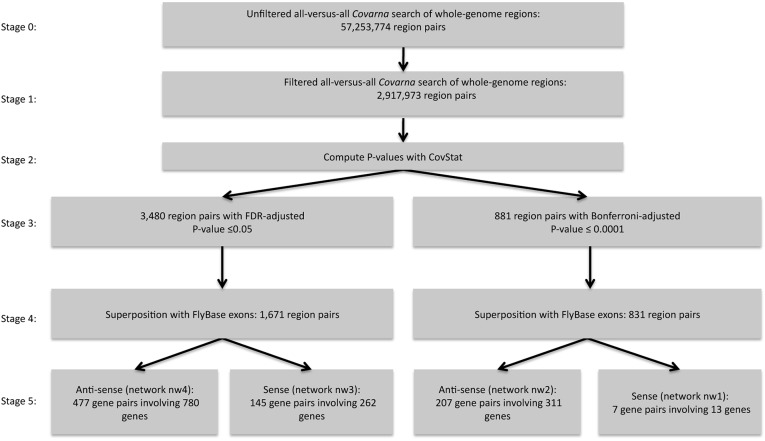
FIGURE 2.
Flowchart that depicts the various stages of data processing for identifying long-range nucleotide covariation. The involved steps are explained in the subsection “Data processing steps” (Materials and Methods). The sizes of the predicted networks corresponding to stage 5 relate to Table 1 in the following fashion: The sense networks (nw1 and nw3) appear in Table 1A. The antisense networks (nw2 and nw4) appear in Table 1B. The values corresponding to networks based on the False-Discovery-Rate correction (networks nw3 and nw4) appear in Table 1, A and B, in brackets. Note that the sum of predicted covariation relationships shown in Table 1, A and B, can be higher compared with the network sizes shown here, because a genomic region can be annotated with more than one feature simultaneously.
The set of initial clusters obtained by the CovaRNA method are annotated with P-values that were generated by the CovStat method. For this computational stage, the genomic information corresponding to the aligned genome sequences of 15 species was used (12 Drosophila species and three non-Drosophila insect species, see Materials and Methods). We obtain 3480 covariation clusters that correspond to a false-discovery rate (FDR) corrected P-value cutoff of 0.05 and 881 covariation clusters that correspond to a Bonferroni corrected P-value cutoff of 0.0001. Superposing these region pairs with exonic regions (obtained from FlyBase) (McQuilton et al. 2012) results in 1671 region pairs or 831 region pairs, depending on whether the FDR or Bonferroni corrected P-value was used as filter criterion (Fig. 2). This step also involves the filter criterion that the two regions of a region pair correspond to two nonidentical and nonoverlapping FlyBase genes, because in this analysis we focus on trans-acting covariation.
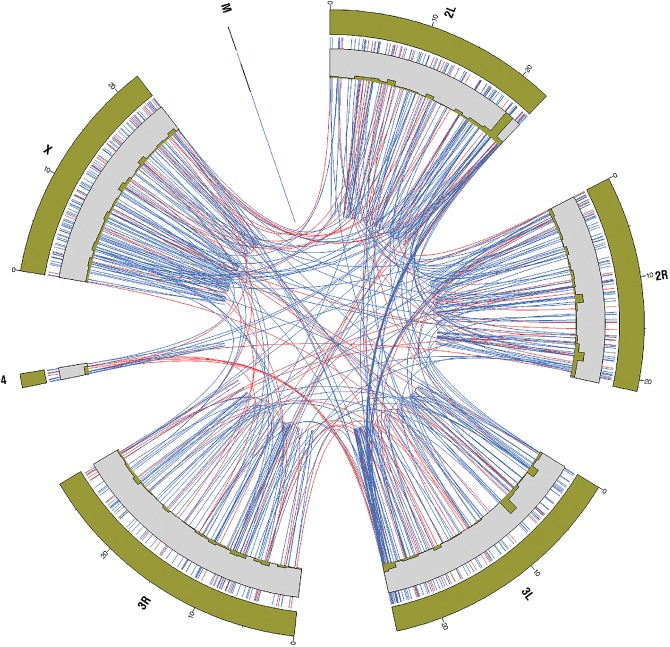
In Figure 3 the set of 881 covariation clusters is shown in the form of a circular representation. The plot shows that predicted inter- and intrachromosomal covariation clusters are found in all non-mitochondrial chromosomes. Furthermore, we observe pronounced interchromosomal covariation between regions proximal to the centromere (proximal regions of chromosome arms 2L/3L, as well as 2R/3L).
FIGURE 3.
Circular representation of detected covariation regions and their location with respect to the Drosophila melanogaster genome. Red connecting lines indicate the positions of reverse-complementary covariation between region pairs with the same strand directionality. Blue connecting lines indicate the positions of reverse-complementary covariation between region pairs with opposing strand directionality.
We found that the majority of detected covariations between two exons are such that the antisense of one exonic region exhibits conserved reverse complementarity to another exonic region; this appears as synchronized mutations if the two genomic alignments corresponding to the two exons are being interpreted in the 5′ to 3′ direction of their corresponding transcripts (Fig. 2). A smaller number of cases correspond to reverse complementarity with covariation between two exonic regions in the sense direction. This leads (for a given threshold of statistical significance) formally to a sense as well as an antisense network consisting of seven and 207 gene pairs, respectively (Supplemental Tables S1–S4).
In order to independently verify the reliability of the adjusted P-value approach, we applied the same computational pipeline (depicted in Fig. 2) to a set of shuffled genomic alignments (the method used for shuffling these control alignments is explained in the Materials and Methods section). The results are shown in Supplemental Figure S3. The CovaRNA method detects 6032 initial covariation clusters when applied to shuffled alignments; in other words, the number of initial covariation clusters is by the factor 2,917,973/6,032 = 483.7 smaller compared with the original alignments. After applying the CovStat method, only one covariation cluster remains for the case of the false-discovery-rate correction and zero covariation clusters remain significant after applying the Bonferroni correction. The superposition with known exonic regions leads to zero overlaps. This resulting size of zero predicted gene–gene interactions for the case of shuffled input alignments supports the notion that the computational pipeline is “conservatively reliable”; in other words, it leads to a low amount of false-positive predictions, leaving open the possibility of a substantial number of missed interactions (false negatives). One restriction is that the CovaRNA and CovStat methods rely on genomic alignments that exhibit covariation; for example, the alignments have to be of relatively high quality. Also, one cannot exclude the possibility that there are differences in the average alignment quality for different types of genomic regions. One area of improvement to enable the detection of a larger number of long-range interactions would be to extend the computational pipeline to allow for alignment-free methods.
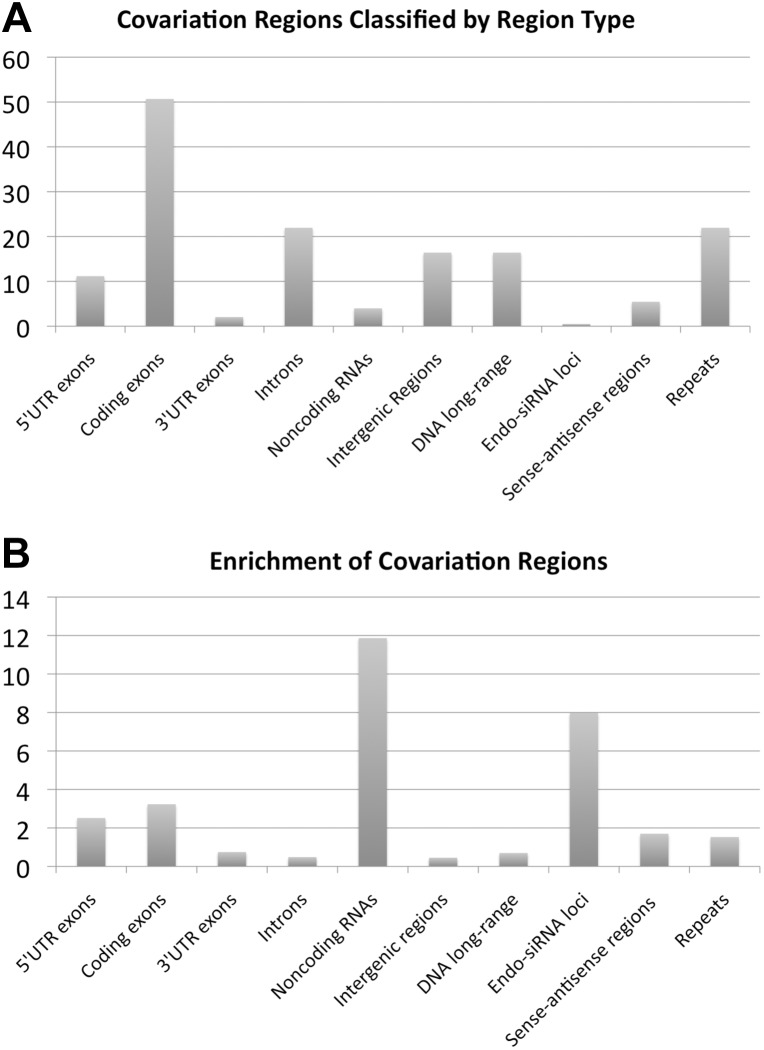
We analyzed which types of genomic regions the detected covariation clusters can be attributed to. We found that the majority of covariation clusters (>50%) overlap with an exon that is part of the coding region of an mRNA, followed by introns and intergenic regions (Fig. 4A). However, we observe the highest enrichment of predicted covariation (defined in the caption of Fig. 4) for noncoding RNAs, followed by exons of mRNAs that correspond to 5′ UTRs and coding regions (Fig. 4B). This suggests that many noncoding RNAs have trans-acting functionalities, many of which have yet to be characterized. The previously reported DNA chromosomal long-range interacting regions (Lieberman-Aiden et al. 2009) do not lead to a pronounced enrichment, indicating that this mechanism does not substantially contribute to the alignment properties that give rise to the computational results.
FIGURE 4.
Classification of genomic regions that are involved in long-range covariation. (A) Fraction (in percent) of covariation regions that overlap with genomic regions of a certain type. (B) Enrichment of a fraction of bases that are predicted to be within covariation regions. The enrichment of a region type is defined as (Ncr/Nr)/(Nc/N); Ncr: number of genome positions that overlap with at least one region of a predicted covariation cluster; Nr: number of different genome positions corresponding to the genomic region type of interest; Nc: total number of genome positions that overlap with at least one region of a predicted covariation cluster; N: total effective genome length. Note that the used uncorrected values of Ncr and Nc are affected by the restrictions w.r.t. the used available alignments that cover only 59% of the euchromatic genome. This bias toward the “alignome” is approximately canceled out in the above formula if the same correction factor of 0.59 is applied to both Nr and N. (Region types) DNA long-range: genomic regions that were previously reported to participate in long-range chromosomal interactions (Sexton et al. 2012); intergenic: all euchromatic genomic regions that are not annotated as coding exons, noncoding RNAs or introns; endo-siRNA loci: genomic regions reported to be involved in endo-siRNA generation (Czech et al. 2008). Note that because a genomic region can be annotated with several region-type attributes, the sum of the percentages do not have to add up to 100. The standard deviation (estimated using the standard deviation of a Poisson random variable combined with error propagation) relative to the magnitude of the computed enrichment is 4% in the case of the sense–antisense regions and below 0.01% for all other region types.
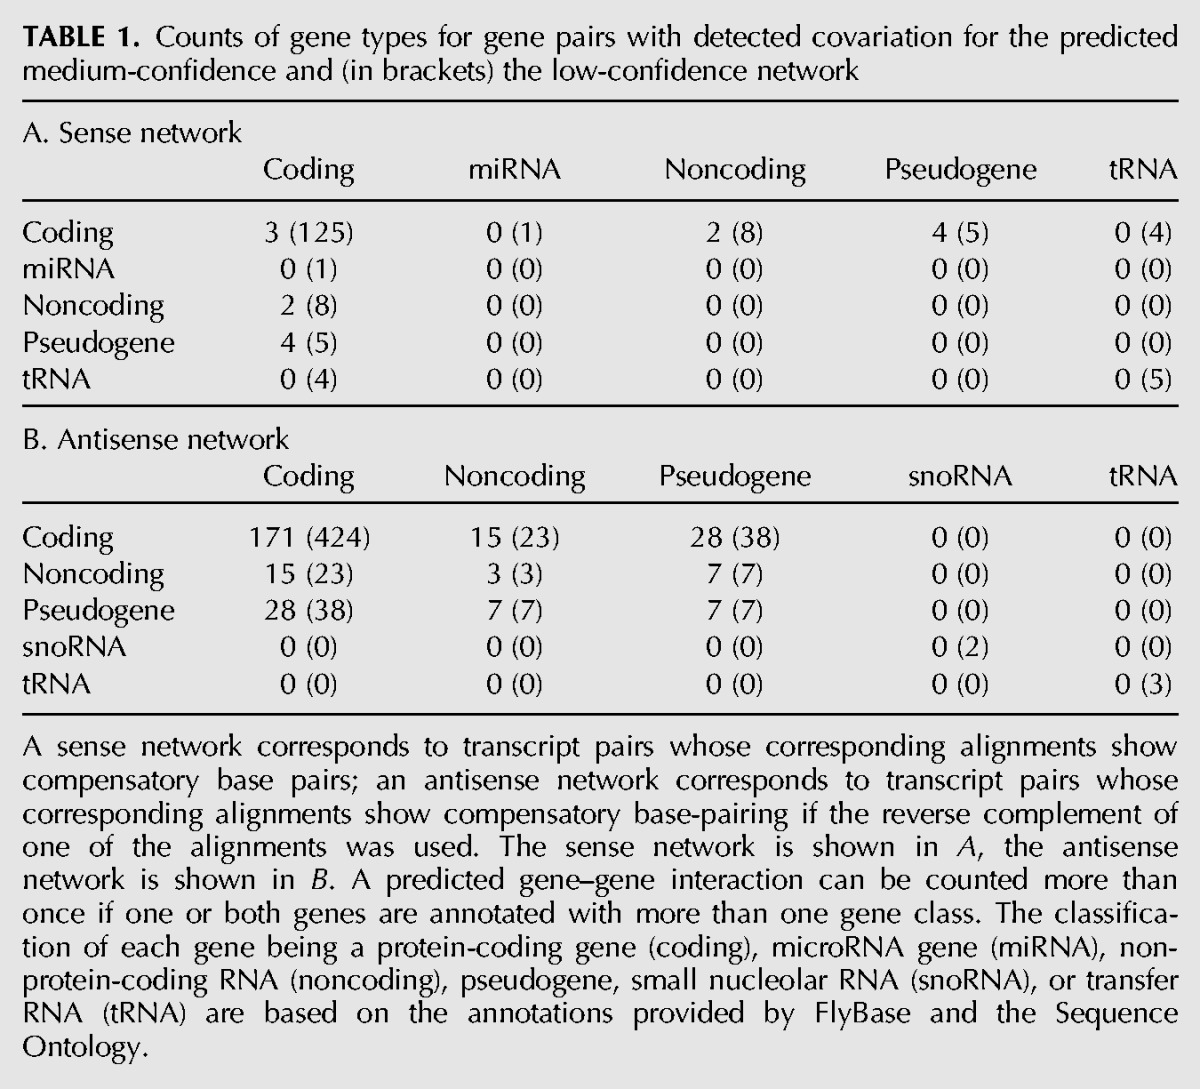
For each generated gene–gene network the number of occurrences of covariation clusters between gene pairs is shown in Table 1. Most covariation clusters occur between gene pairs such that both of them are annotated as protein coding, followed by covariation clusters that relate pseudogenes with protein-coding genes. The number of covariation clusters is strikingly higher if the antisense of an annotated gene is involved: In the case of the Bonferroni correction-based network, we obtain only three pairs of sense-mRNAs that exhibit covariation and 171 covariation clusters between an mRNA and the antisense of another mRNA. In other words, there appears to be a bias in order to avoid direct base-pairing between RNA transcripts; instead, the expression of an antisense transcript would lead to a specific base-pairing interaction.
TABLE 1.
Counts of gene types for gene pairs with detected covariation for the predicted medium-confidence and (in brackets) the low-confidence network
We analyzed which gene functions are over- and under-represented in our predicted network (Supplemental Table S5). We find a pronounced bias toward gene functions related to the organization of the cytoskeleton as well as the cell membrane. Also apparent is an intriguing bias toward genes that play a role in development (in particular neural development). Also, we compared the functional similarity between gene pairs of predicted networks compared with random.
We generated distance (i.e., sequence separation) histograms for intrachromosomal covariations for both the sense and antisense networks (Fig. 5A,B). The histograms reveal a striking distance dependence in the case of the antisense network, but not the sense network. A nonparametric statistical test indicates that the two sets of distances originate from different distributions (P < 0.001, two-sample, two-sided Kolmogorov–Smirnov test, sample sizes n1= 73, n2= 338). The plethora of observed relatively short-range antisense covariations warrants further (experimental) characterization. One may speculate that these detected covariations may be due to cis-antisense regulation or due to hotspots of repeat element generation.
FIGURE 5.
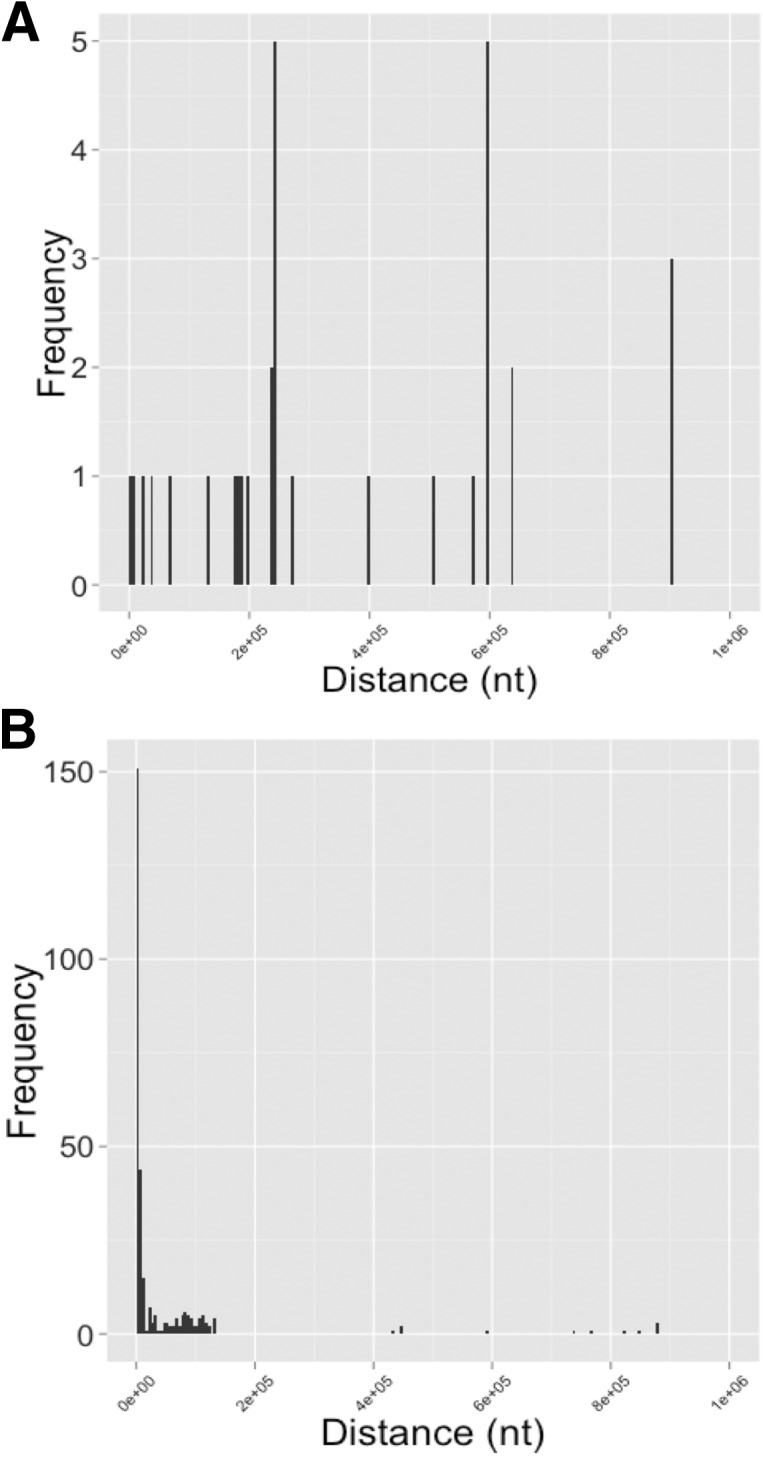
Histograms showing various properties of detected long-range covariation. (A) Histogram of genomic distances between pairs of genomic regions with covariation corresponding to two genes. (B) Histogram of genomic distances between pairs of genomic regions with covariation corresponding to a gene and the antisense of another annotated gene.
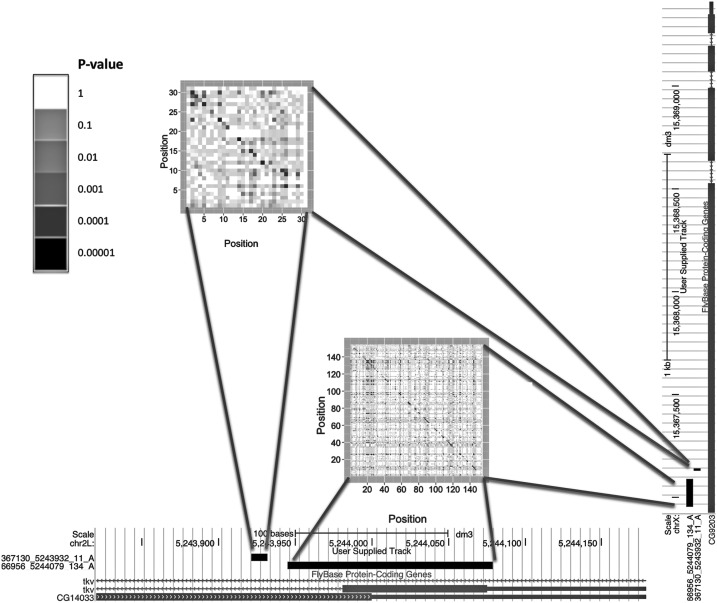
An example of detected covariation is shown in Figure 6. It involves a genomic locus corresponding to the tkv (thickveins) gene as well as a locus corresponding to the gene CG9203. The matrix with per-column P-values of nucleotide covariation suggests an extended helical structure of a possible duplex. Note the existence of the antisense transcript CR14033 (also known as CG14033); its expression could lead to the formation of tkv-CR14033 originating endo-siRNA, which in turn targets and down-regulates the gene CG9203 (Czech et al. 2008; Okamura and Lai 2008; Okamura et al. 2008). In other words, while antisense transcripts (such as CR14033) are endo-siRNA candidates, the methodology described in this study can also be used to detect endo-siRNA target sites. A second example of a detected long-range covariation is presented in Supplemental Figure S4.
FIGURE 6.
Example of two covariation clusters that were detected. They correspond to two genomic regions that contain exons of the tkv gene as well as CG9203. Notice that a transcript CG14033 (referred to in the image as CG14033) is overlapping with tkv and has reverse-strand directionality compared with the tkv transcript. This is suggestive of a scenario in which transcripts of tkv and CR14033 hybridize, thus forming extended helical secondary structures that are processed to endo-siRNAs, which in turn down-regulate the expression of CG9203 (Czech et al. 2008; Okamura et al. 2008).
DISCUSSION
A wide variety of molecular cell biology phenomena could, in principle, give rise to long-range covariation patterns. The following is a nonexhaustive list of possibilities: (1) RNA–RNA interaction via endo-siRNA, (Czech et al. 2008; Okamura and Lai 2008; Okamura et al. 2008; Zhou et al. 2009); (2) RNA hitchhiking (Jambor et al. 2011; Hartswood et al. 2012); (3) DNA long-range interactions (Sexton et al. 2012); (4) formation of self-assembling RNA–RNA complexes; (5) RNA splicing; (6) RNA–DNA interactions; or (7) gene duplication (Benovoy and Drouin 2009).
We find computational evidence supporting the involvement of endo-siRNA-based long-range interactions: The endo-siRNA generating clusters (Czech et al. 2008) are enriched for long-range covariation (Fig. 4B). Nine out of the 50 reported regions reported to be involved in endo-siRNA generation overlap with the predicted FDR-based covariation clusters. This suggests that this methodology can be utilized for endo-siRNA target prediction and be beneficial for the growing field of RNA nanotechnology (Afonin and Leontis 2006; Afonin et al. 2008a,b, 2010, 2011, 2012; Guo 2010; Bindewald et al. 2011). It should be noted that the computational pipeline depends on the existence of covariation and is designed to yield a low number of false positives, possibly at the expense of false negatives (missed interactions). The example shown in Figure 6 is a case that has been reported before as an endo-siRNA generating locus.
Figure 7 shows a plot of functional similarity between gene pairs with antisense covariation as a function of sequence similarity. This is based on pairwise sequence alignments between their respective nucleotide transcript sequences. This network is referred to as nw2 in Figure 2. The plotted functional similarity is a mean of a functional similarity measure applied to the three parts—biological process/molecular function/cellular component—of the Gene Ontology (Ashburner et al. 2000; Wang et al. 2007; Yu et al. 2010). The plot shows that for gene pairs of the predicted network with a pair-wise sequence similarity between 15% and 40%, the functional similarity is in all but one case higher than 0.8, as opposed to the randomized control gene network for which the majority of gene pairs have a functional similarity below 0.6. A Wilcoxon rank sum test applied to these two groups of functional similarity scores (the two groups of similarity scores originating from the predicted and randomized network for the gene pairs with <40% sequence similarity) results in a P-value of 9.13×10⁻⁶ (two-tailed Wilcoxon rank sum test, npred= 9, nrand= 70 using default values of the R software (the R software utilizes by default a normal distribution with continuity correction to approximate the distribution of ranks under the null hypothesis). In addition, the plot shows that in the majority of cases (88 of the 115 plotted cases [or 77%] of the predicted network shown as red circles), the functional similarity is higher than 0.8. This indicates that the approach for the detection of nucleotide covariation could be used as a novel approach for in-silico gene function prediction and annotation.
FIGURE 7.
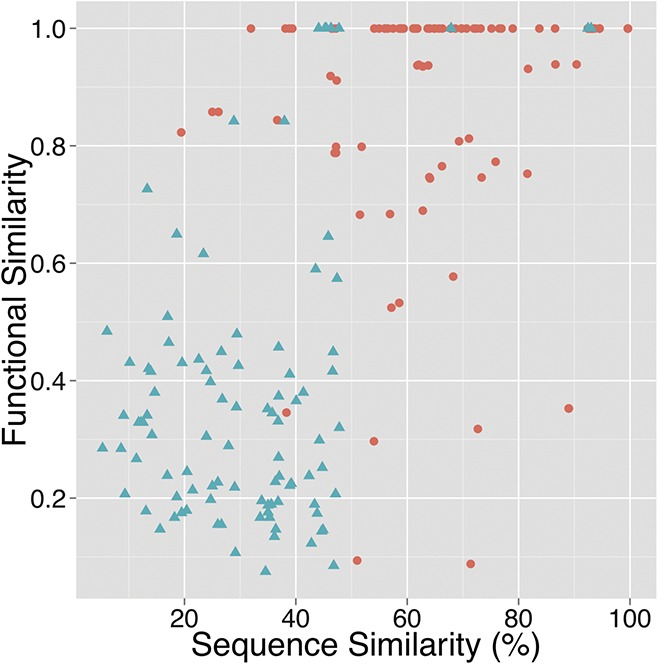
Functional similarity between gene pairs as a function of sequence similarity of their transcripts. The functional similarity is based on the measure described by Wang et al. (2007). Shown is the mean similarity with respect to the three parts of the Gene Ontology (biological process, molecular function, and cellular component). Red circles correspond to the set of 207 gene pairs with predicted antisense covariation (referred to as network nw2 in Fig. 2); from this set only 115 gene pairs are plotted, the nonplotted gene pairs correspond to cases for which the functional similarity could not be computed due to missing functional annotation (n= 115, mean sequence similarity: 69.51%, mean functional similarity: 0.88). Blue triangles represent the randomized version of network nw2 (n= 98, mean sequence similarity: 31.60%, mean functional similarity: 0.39). The sequence similarity is based on a pairwise alignment of gene transcript nucleotide sequences using the MUSCLE software (Edgar 2004).
For the data set of low-confidence covariation clusters, we find a functional bias toward genes that have cellular component annotations such as plasma membrane, or cytoskeleton. This may be interpreted as an indication of the widespread phenomenon of RNA hitchhiking, in which RNA transcripts bind to other RNAs that are already part of ribonucleoprotein complexes, which in turn are actively transported along the cytoskeleton. This proposed RNA–RNA interaction network might act in a statistical length-dependent manner, in which an RNA is more likely to be part of active transport if its transcript is longer, thus opposing the tendency of physical diffusion in which longer transcripts would be reaching distal cellular components at a lower rate. A role of natural antisense transcripts in RNA transport could have the effect that an RNA transport network is amenable to control and regulation.
We found that the detected covariation clusters correspond to intramolecular exon–exon covariation for only seven different genes (Supplemental Table S6). This suggests that the chosen set of parameters was very conservative; also, one can expect that the larger the number of sequenced genomes, the larger the number of covariation clusters that are detectable and statistically significant.
The computational pipeline can be applied to organisms other than Drosophila. The methodology depends on alignments that contain covarying alignment column pairs; unalignable regions as well as perfectly conserved regions are not amenable to such a search for covariation. Also, it would be interesting to extend the presented statistical test to include different weights that can be assigned to the different genomic sequences. Because the computational cost of the CovaRNA method scales with the third power with respect to the number of organisms, the increasing number of available sequences (in the form of sequence model organisms) should not be used indiscriminately; instead, a judicious choice of related model organisms will remain relevant.
CONCLUSION
Taken together, our pipeline of novel computational methods has uncovered a layer of genomic complexity in the form of long-range nucleotide covariation that has thus far not been fully appreciated. This set of detected covariation patterns is likely to be only the “tip of the iceberg.” This computational analysis could be an important step toward the further experimental and computational characterization of cellular RNA–RNA, DNA–DNA, and RNA–DNA interaction networks.
MATERIALS AND METHODS
Overview
The goal of the presented work is to generate and analyze results of a genome-wide search for long-range covariation in Drosophila genomes. Starting from genomic alignments, the novel CovaRNA software generates an initial set of long-range covariation clusters. The genomic alignment pairs corresponding to this initial set of covariation clusters are further analyzed with the help of the novel CovStat method in order to determine whether the observed covariation patterns are statistically significant. The CovStat method determines whether a bias toward conserved complementary base pairs is statistically significant. An all-versus-all search for long-range covariation applied to all euchromatic regions of the Drosophila 12-genome alignment and three non-Drosophila insect genomes has been performed (in other words, this search contains exonic, intronic, and intergenic regions, and is not restricted to regions corresponding to known exons). A flowchart (Fig. 2) provides an overview of the applied methods. Using various computational methods (explained in subsequent sections), this initial data set is filtered to obtain proposed low-confidence and medium-confidence predicted RNA–RNA interaction networks that are based on the false discovery rate (FDR) corrected P-values or Bonferroni corrected P-values, respectively.
Definition of long-range (trans) covariation
Two different definitions are used to define the concept of “long-range,” depending on whether gene annotations were used for a particular analysis. If predicted regions are analyzed without the use of FlyBase gene annotations, a covariation cluster is considered as a potential long-range interaction if its two genomic regions (indicated as “Region 1” and “Region 2” in Fig. 1) are either located on different chromosomes (or chromosome arms) or are separated by genomic regions that are at least 6000 nt apart.
Alternatively, if the FlyBase gene annotation is used, a covariation cluster is considered as long range if its corresponding two genomic regions are overlapping with two exons, such that the exons belong to two different genes whose genomic loci are not overlapping.
Detection of long-range covariation with CovaRNA
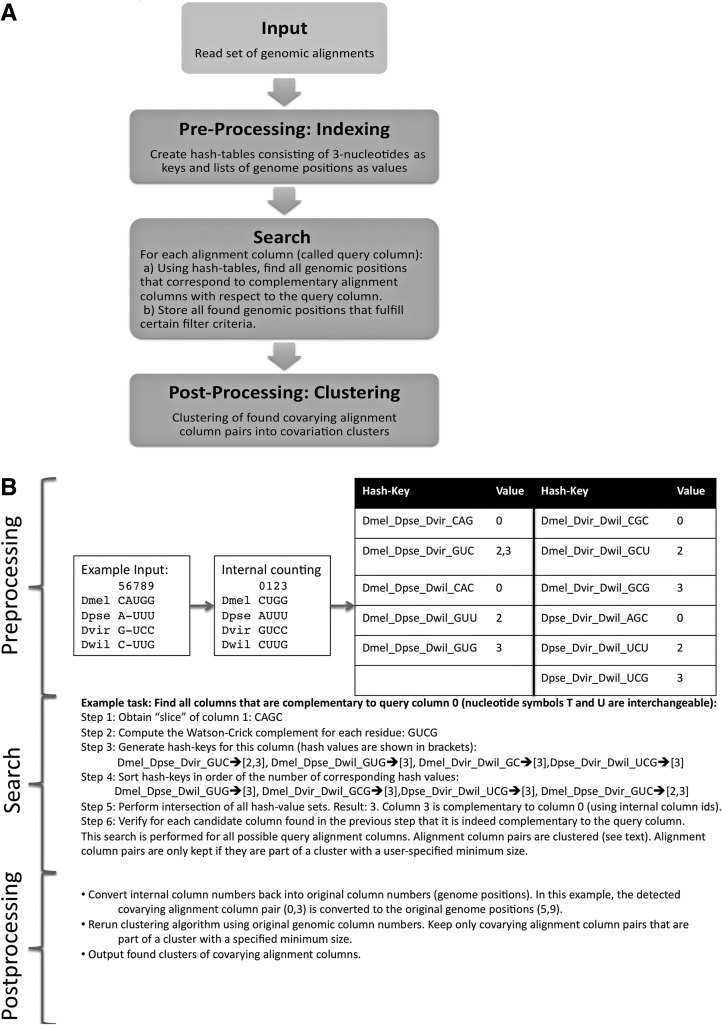
We developed software called CovaRNA that facilitates high-throughput detection of pairs of alignment columns in genomic alignments that show covariation. The key idea of the approach is to use alignment “columns” as queries and search space. Note that due to the nature of genomic alignments (frequent gaps, only some of the provided genomes are alignable to parts of the reference genome, missing experimental information) BLAST-type algorithms are not applicable for this approach, because they require a minimum number of consecutive sequence characters as a seed. Instead, we implemented an approach that stores for each alignment column a set of genome-triplet “fingerprints.” Each “fingerprint” contains the identifiers for three different genomes as well as three respective sequence characters corresponding to a particular alignment column.
For the task of finding all alignment columns that are Watson-Crick complementary to a nonconserved query column, the sequence complement and the corresponding genome-triplet “fingerprints” of that query column are computed. The algorithm for finding the set of complementary alignment columns for a given query alignment column is explained in detail in the form of a pseudocode (see pseudocode listings in Supplemental Figs. S1, S2) as well as in the form of an example (see Fig. 8). A list of candidate columns is obtained by collecting all alignment columns that have this set of genome-triplet fingerprints present. Each element of this candidate list is checked if it is indeed complementary to the original query alignment column. In addition, column pair i, j is only retained if (1) either column pair i+ 1, j − 1 or i − 1, j+ 1 is complementary, and (2) column pairs i+ 1, j+ 1 and i − 1, j − 1 are not complementary. These indices correspond to searches for reverse-complementary stretches on genomic regions with the same strand orientation; for covariation searches between regions of opposing strand directionality, the index-logic is adjusted accordingly.
FIGURE 8.
Flowchart (A) and example (B) of CovaRNA search for covarying alignment columns. The approach can be divided in a pre-processing stage, a search stage, and a post-processing stage. Pre-processing: The original genomic alignment blocks (that might contain gaps, overlaps, and different strand directionalities) are consolidated leading to an unambiguous internal counting of column positions. Hash keys are generated corresponding to each possible genome triple and each possible nonconserved nucleotide triple. For each hash key, the alignment positions at which the three corresponding genomes exhibit the three corresponding nucleotides of the hash key are stored as the “value” of a hash map. Note that triples that are “conserved” (that is, the nucleotides corresponding to the three genomes of a triple are either AAA, CCC, GGG, or UUU) are not stored.
Next, the individual alignment column pairs that exhibit covariation are grouped into clusters (called covariation clusters) using a single-linkage clustering algorithm (Fig. 1). In other words, a covarying alignment column pair is added to an existing cluster if that cluster contains at least one other covarying alignment column pair, such that their respective two involved alignment column indices are within 40 nt; otherwise, a new cluster is started. The rationale of the clustering is to separate potential interacting regions into domains that are separated by at least 40 nt. Each initial cluster is required to contain at least five covarying column pairs.
At least two alignment column pairs have to appear to belong to the same double helix by possessing the same “helix-invariant” that is the sum of genomic coordinates. The rationale is that if there are, for example, two base pairs, a and b, that are part of the same double helix and have the corresponding column pairs coordinates i, j and i+ 2, j − 2, respectively, the sum of their column pair coordinates in both cases is i+ j. For covariation searches in regions with opposing strand directionality, the helix invariant is the difference of their column pair coordinates. For a covariation cluster to pass a second filtering stage, the number of different helix invariants has to be at least two units lower compared with the total number of covarying alignment columns in that covariation cluster. Third, the length of both regions of a covariation cluster has to be at least 5 nt. This three-critera filtering of covariation clusters is performed in part by the CovaRNA program binary, and in part by a Perl-script that performs post-processing of the CovaRNA output.
Statistical tests for distinguishing alignment regions with covariation from “noise”
Using the R scripting language, we implemented two methods for further analysis and filtering of the “raw” covariation clusters obtained from the CovaRNA program and assigning a statistical significance to them. The statistical test is based on the null hypothesis that the amount of observed covariation is due to chance. The first tests the probability of obtaining a certain number (or more) of covarying alignment column pairs between two regions. The second tests the bias toward antidiagonal arrangements of the covarying alignment column pairs. Both methods result in a P-value that is a measure of confidence of covariation between two alignment regions; those two P-values are combined into one P-value.
A statistical test for a bias toward nucleotide complementarity
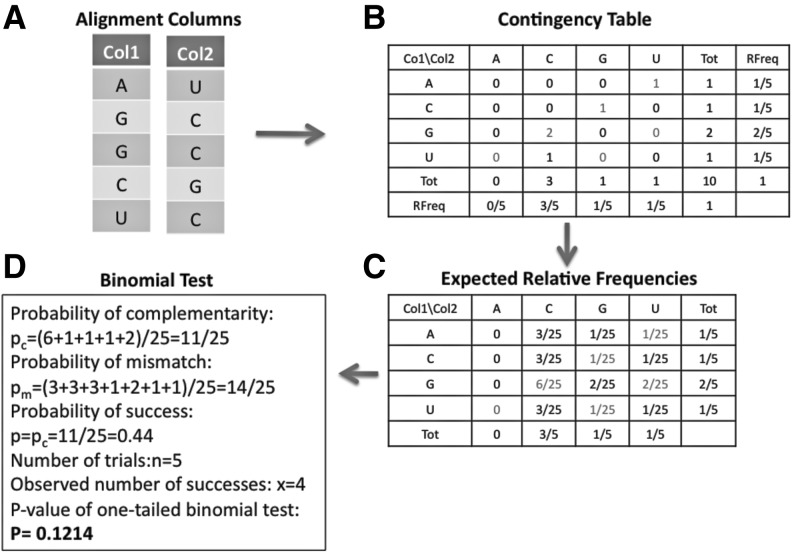
We describe here a statistical test that indicates whether, for two alignment columns, the six complementary pairings (AU, UA, GC, CG, GU, UG) are over-represented compared with the 16 possible different pairings between two nucleotides. Notice that such a statistical test could be implemented by estimating what fraction of randomly shuffled alignment columns with the same nucleotide content lead to the same or higher amount of complementary nucleotide pairings. This randomization test is replaced by a binomial test: Let there be two alignment columns each consisting of n characters for which k nucleotide pairs are complementary. The probability p of obtaining by chance a complementary nucleotide can be determined using a contingency table (see Fig. 9). The P-value for obtaining the observed number (or more) of complementary nucleotide pairings is approximated by a P-value of a one-tail binomial test with n trials, k successes and a probability of success p.
FIGURE 9.
Steps involved in computation of a statistical test for a bias toward complementary base pairs in two alignment columns. (A) Two alignment columns that are “input” for a statistical test that measures a bias toward dinucleotides that are complementary (AU, UA, CG, GC, GU, or UG). The number and identity of compared organisms corresponding to rows in the two columns must be identical. (B) A contingency table corresponding to counts of all 16 possible nucleotide pairings is computed. For example, the first row of the two alignment columns corresponds to a hypothesized “A-U” base-pair interaction. The column and row entitled “Tot” corresponds to the column-wise and row-wise sums, respectively. The column and row entitled “RFreq” corresponds to the relative frequency of that type of nucleotide in the first or second alignment column, respectively. (C) The expected relative frequencies of observing a certain nucleotide pairing are computed using the product of the per-column relative frequencies. (D) The information gathered in the previous steps is used to apply a one-tailed binomial test. The probability of observing a complementary nucleotide pairing by randomly picking a nucleotide from the first alignment column and a nucleotide from the second alignment column is the sum of the expected relative frequencies that correspond to the pairings AU, UA, CG, GC, GU, UG. The sum of those terms is pc= 0.44. This probability is used as the “probability of success” in the binomial test. The number of trials is set equal to the number of rows of the two alignment columns (n= 5). The number of observed successes among the five trials is x = 4, because for this example one observes the four complementary base-pairings AU, GC, GC, CG. A one-tailed binomial test with n = 5, P = 0.44, and x = 4 results in a P-value of 0.1214.
If, for a given alignment column i, m different columns j1, …, jm are being examined, one obtains m different P-values, each one testing the null-hypothesis that the nucleotide pairings of two specific alignment columns are randomly distributed. If one wants to test the combined null hypothesis that alignment column i is not correlated to any of the columns j1, …, jm, one can achieve this by combining the P-values corresponding to the null hypothesis H01, H02, …, H0m. We use the truncated product method as a means of computing a combined P-value from P-values that originate from multiple hypothesis tests that are assumed to be independent (Zaykin et al. 2002).
Now there are n different columns, and for each one there is a P-value corresponding to the null hypothesis that this particular column is uncorrelated to any of the alignment columns of the target region. Next, a combined P-value corresponding to the different columns of the target region is computed. This combined P-value corresponds to the null hypothesis that all columns of the query region are uncorrelated with all columns of the target region. This P-value can be used for detecting long-range covariation in nucleotide alignments.
A measure for a bias with respect to anti-diagonals
The idea of this method is that covarying alignment column pairs in an RNA structure frequently correspond to an RNA double helix. To measure a bias toward anti-diagonals, we again use the concept of the helix invariant, explained in the previous section; for a potential base pair between genomic positions i and j, the helix-invariant is i+ j (because if their were another base pair that is part of the same RNA double helix, it would have the genomic coordinates i+ k, j − k, leading to the same invariant i+ j because i+ k + (j − k) = i+ j).
The input to this algorithm consists of two alignments corresponding to a covariation cluster (shown schematically in Fig. 1). For two aligned regions, this method first determines the set of nonconserved alignment column pairs that are complementary (A-U, G-C, and G-U pairings are considered). For two genomic regions consisting of m or n alignment columns, respectively, it generates a m × n matrix (called covariation matrix) that contains as elements the value 1 for alignment column pairs that are nonconserved and complementary, and zero otherwise. For the unshuffled alignment pair, the number of unique helix invariants is counted. A bias toward anti-diagonals corresponds to a small number of observed unique helix invariants; in other words, if a region pair (i.e., covariation cluster) corresponds to an RNA–RNA interaction, then random shuffles of the m × n matrix while preserving the number of covarying column pairs should correspond to a larger number of helix invariants compared with unshuffled alignments. The computed P-value for the bias toward anti-diagonals is the fraction of times that the number of unique helix invariants in the shuffled alignment pairs is smaller than or equal to the unshuffled alignments. The shuffling is performed by “scrambling” the aforementioned covariation matrix; in other words, the positions of the “ones” and “zeros” in that matrix are randomized without changing their total number.
Combination of statistical tests
The test for more than expected complementary nucleotide pairs is combined with the test for an over-representation of anti-diagonals using a hybrid method for combining P-values. If neither of the two P-values is less than or equal to a cutoff value of 0.05, the method of Simes (1986) is used to compute a P-value for the combined hypothesis that two alignments are uncorrelated (based on two statistical tests that use two different methods and are treated as independent). Otherwise, the truncated power method is used to compute a combined P-value (Zaykin et al. 2002). This P-value is used as a determination of whether two alignments are uncorrelated. This quantity is computed using the two original alignments as well as the reverse complement of both alignments.
Generation of shuffled control alignments
A program (called sufflemaf) was written to generate shuffled multiple sequence alignments that can be used as a control. The approach was to be “conservative,” in the sense that shuffled control alignments should leave many features of the original alignments intact in order to not make it artificially easy for the prediction software to dismiss potential predictions that are based on shuffled alignments. The approach works as follows: Alignments are “vertically” shuffled; in other words, only columns are shuffled individually. The locations of gaps are left unchanged. Also, the first “reference” sequence (corresponding in this case to the species Drosophila melanogaster) is not changed at all. This approach was chosen to demonstrate that the dramatically reduced number of detected covariation clusters (see Supplemental Fig. S3) is indeed due to destroyed covariation information in the multiple sequence alignments.
Tools for computational data processing and analysis
The processing of genomic regions, sequences, and alignments, as well as the analysis of the properties of the predicted interactions, were to a large extent performed using the Galaxy genome-analysis workbench (Giardine et al. 2005; Taylor et al. 2007). For the analysis of the functional enrichment of genes involved in nucleotide covariation we used the DAVID system (Huang et al. 2009b). From a gene list, DAVID computes a list of enriched genes. The enriched genes are grouped by the DAVID method into clusters of genes with similar functions. The DAVID clustering algorithm (called heuristic fuzzy multiple-linkage partitioning) groups enriched genes by functional similarity; note that this method allows a gene to be part of multiple clusters (Huang et al. 2007). The gene clusters obtained in this manner are converted to gene function clusters as shown in Supplemental Table S5. The methodology is described in more detail in the original publications (Huang et al. 2007, 2009a,b). Part of the data analysis has been performed using the R computer language, including the Bioconductor framework and the graphics package ggplot2 (Csardi and Nepusz 2006; Wickham 2009). Sequence similarity estimations have been performed using the MUSCLE sequence alignment software (Edgar 2004). The functional similarity between gene pairs has been estimated using the Gene Ontology in combination with a measure described by Wang and colleagues using the implementation of the R package GOSemSim (Ashburner et al. 2000; Wang et al. 2007; Yu et al. 2010). The plotted values are an arithmetic mean between the functional similarity measures with respect to the three parts of the Gene Ontology (biological pathway, molecular function, cellular component); unavailable functional annotations are ignored. The circular genomic representation shown in Figure 3 has been generated using the Circos software (Krzywinski et al. 2009).
Data sets
Alignment and annotation data were obtained from the UCSC genome browser web and ftp site (Kent et al. 2002). For the genomic alignment the multiz15way data was used; the data corresponding to the three non-Drosophila genomes included in the alignment were not used for the initial CovaRNA screen, but were used for the statistical analysis of the obtained covarying region pairs (Blanchette et al. 2004; Drosophila 12 Genomes Consortium 2007). This genomic alignment is based on the Drosophila melanogaster sequence assembly dm3 (Apr. 2006, BDGP Release 5) (Celniker et al. 2002). Alignments corresponding to heterochromatic genomic regions as well as unplaced regions were not considered. To split the compute-jobs into units requiring <8 GB, the genomic alignments were split into chunks of, at most, 50,000 block alignments. The genome annotation is based on FlyBase version 5.39 (with the exception of Fig. 4, which has been generated using FlyBase version 5.12) (Tweedie et al. 2009).
Data processing steps
The data processing steps are visualized in the form of a flowchart in Figure 2. The CovaRNA search resulted in 57,253,774 unfiltered and 2,917,973 filtered covariation clusters (the filtering step ensures that for each covariation cluster the number of helix invariants is at least two units lower compared with the number of covarying alignment column pairs). For each covariation cluster, a pair of genomic alignments was created; each alignment was extended by 10 nt upstream of and downstream from the initially identified region to capture adjacent regions that do not necessarily exhibit perfect covariation. For each alignment pair, two P-values were computed with the CovStat method, using in the first case the unmodified genomic alignment pair, and in the second case the reverse complement of both alignments. For each of the two P-values, an adjusted P-value was computed for each alignment pair using the Bonferroni correction and, alternatively, the False-Discovery-Rate correction (leading to four different corrected P-values per alignment pair). Filtering the FDR corrected P-value of the unmodified or reverse-complementary alignment pair so that it is smaller than or equal to 0.05 results in 3480 alignment pairs. Requiring instead that the Bonferroni corrected P-value is less than or equal to 0.0001 results in 881 covariation clusters. Superposing both regions of each covariation cluster with FlyBase exons of protein-coding as well as noncoding transcripts (using the Galaxy “join” command) results in covariation clusters in which each region corresponds to a FlyBase exon (1671 region pairs or 831 region pairs, depending on whether the FDR or Bonferroni correction was used, respectively, in the previous step; see Stage 4 in Fig. 2). Additionally requiring for each covariation cluster that the two superposing FlyBase genes are distinct and not overlapping results in 1131 (FDR) or 506 (Bonferroni) covariation clusters. From these covariation cluster sets, sets of 145 sense as well 477 antisense gene pairs are generated in the case of the FDR correction, and in the case of the Bonferroni correction, sets of seven sense and 207 antisense gene pairs (Stage 5 shown in Fig. 2). These sets of gene pairs are labeled as networks nw3, nw4, nw1, and nw2, respectively (Fig. 2).
Statistical procedures
The newly developed CovStat method computes a P-value corresponding to an observed bias in nucleotide covariation between two alignments corresponding to two genomic regions under the null-hypothesis that there is no correlation between the observed mutations. The method is applied to a set of 3840 alignment pairs that are obtained from the CovaRNA method and its subsequent filtering steps (see previous subsection “Data processing steps”). For each alignment pair, two P-values are computed: The first P-value (referred to as P1) corresponds to the two unmodified alignments; the second P-value (referred to as P2) refers to the reverse-complement of both alignments. Two alternative multiple-testing correction procedures (Bonferroni as well as False-Discovery-Rate) were applied to the set of all P1 values and additionally to the set of all P2 values. However, once the transcript strand orientations of the involved genes are used, a multiple-testing-corrected P-value is chosen from either the set of P1 or the set of P2 values.
As can be seen in Supplemental Figure S3, the computational pipeline applied to shuffled control multiple sequence alignments yields essentially zero “hits” for both the False-Discovery-Rate and the Bonferroni correction methods. This indicates that the overall procedure for ascertaining statistical significance is highly “conservative” (small number of false-positive predictions, albeit possibly at the expense of missed interactions). This suggests that in practice the less conservative False-Discovery-Rate P-value correction method is sufficiently conservative for generating reliable results, and should be preferred over—in this case—the excessively conservative Bonferroni correction.
Graph randomization procedure
The network graph corresponding to Figure 7 has been randomized (blue triangles in Fig. 7) with respect to the originally predicted network (red circles), such that (1) the number of vertices and edges is unchanged, (2) the degree of each of the vertices is unchanged, and (3) the graph is not allowed to contain edges (representing covariation) that connect vertices with themselves.
Search
The search stage consists of an outer loop, in which each alignment column is used as a “query” in order to find all other alignment columns that are complementary to it. For a given query column, the search consists of identifying the corresponding hash keys and iteratively performing the intersection between the hash values (that is column positions). For performance reasons, it is advantageous to first perform the intersections between the index sets with the smallest number of indices. The found alignment columns are only kept if they are part of a cluster with a user-specified minimum number of covarying alignment column pairs.
Post-processing
The internal column counting is converted back to the original counting used in the input data. Because this step can reintroduce gaps, the clustering is performed again. A text representation of the found clusters is written to the file system.
SUPPLEMENTAL MATERIAL
Supplemental material is available for this article.
ACKNOWLEDGMENTS
Computational support by the NCI Advanced Biomedical Computing Center (ABCC) as well as the NIH Helix/Biowulf facility is highly appreciated. This work has been funded in whole or in part with Federal funds from the Frederick National Laboratory for Cancer Research, National Institutes of Health, under Contract No. HHSN261200800001E. This research was supported (in part) by the Intramural Research Program of the NIH, National Cancer Institute, Center for Cancer Research. The content of this publication does not necessarily reflect the views or policies of the Department of Health and Human Services, nor does mention of trade names, commercial products, or organizations imply endorsement by the US Government.
REFERENCES
- Afonin KA, Leontis NB 2006. Generating new specific RNA interaction interfaces using C-loops. J Am Chem Soc 128: 16131–16137 [DOI] [PMC free article] [PubMed] [Google Scholar]
- Afonin KA, Cieply DJ, Leontis NB 2008a. Specific RNA self-assembly with minimal paranemic motifs. J Am Chem Soc 130: 93–102 [DOI] [PMC free article] [PubMed] [Google Scholar]
- Afonin KA, Danilov EO, Novikova IV, Leontis NB 2008b. TokenRNA: A new type of sequence-specific, label-free fluorescent biosensor for folded RNA molecules. Chembiochem 9: 1902–1905 [DOI] [PMC free article] [PubMed] [Google Scholar]
- Afonin KA, Bindewald E, Yaghoubian AJ, Voss N, Jacovetty E, Shapiro BA, Jaeger L 2010. In vitro assembly of cubic RNA-based scaffolds designed in silico. Nat Nanotechnol 5: 676–682 [DOI] [PMC free article] [PubMed] [Google Scholar]
- Afonin KA, Grabow WW, Walker FM, Bindewald E, Dobrovolskaia MA, Shapiro BA, Jaeger L 2011. Design and self-assembly of siRNA-functionalized RNA nanoparticles for use in automated nanomedicine. Nat Protoc 6: 2022–2034 [DOI] [PMC free article] [PubMed] [Google Scholar]
- Afonin KA, Kireeva M, Grabow WW, Kashlev M, Jaeger L, Shapiro BA 2012. Co-transcriptional assembly of chemically modified RNA nanoparticles functionalized with siRNAs. Nano Lett 12: 5192–5195 [DOI] [PMC free article] [PubMed] [Google Scholar]
- Ashburner M, Ball CA, Blake JA, Botstein D, Butler H, Cherry JM, Davis AP, Dolinski K, Dwight SS, Eppig JT, et al. 2000. Gene ontology: Tool for the unification of biology. The Gene Ontology Consortium. Nat Genet 25: 25–29 [DOI] [PMC free article] [PubMed] [Google Scholar]
- Benovoy D, Drouin G 2009. Ectopic gene conversions in the human genome. Genomics 93: 27–32 [DOI] [PubMed] [Google Scholar]
- Bernhart SH, Tafer H, Mückstein U, Flamm C, Stadler PF, Hofacker IL 2006. Partition function and base pairing probabilities of RNA heterodimers. Algorithms Mol Biol 1: 3. [DOI] [PMC free article] [PubMed] [Google Scholar]
- Bindewald E, Shapiro BA 2006. RNA secondary structure prediction from sequence alignments using a network of k-nearest neighbor classifiers. RNA 12: 342–352 [DOI] [PMC free article] [PubMed] [Google Scholar]
- Bindewald E, Schneider TD, Shapiro BA 2006. CorreLogo: An online server for 3D sequence logos of RNA and DNA alignments. Nucleic Acids Res 34(Web Server issue): W405–W411 [DOI] [PMC free article] [PubMed] [Google Scholar]
- Bindewald E, Afonin K, Jaeger L, Shapiro BA 2011. Multistrand RNA secondary structure prediction and nanostructure design including pseudoknots. ACS Nano 5: 9542–9551 [DOI] [PMC free article] [PubMed] [Google Scholar]
- Blanchette M, Kent WJ, Riemer C, Elnitski L, Smit AFA, Roskin KM, Baertsch R, Rosenbloom K, Clawson H, Green ED, et al. 2004. Aligning multiple genomic sequences with the threaded blockset aligner. Genome Res 14: 708–715 [DOI] [PMC free article] [PubMed] [Google Scholar]
- Celniker SE, Wheeler DA, Kronmiller B, Carlson JW, Halpern A, Patel S, Adams M, Champe M, Dugan SP, Frise E, et al. 2002. Finishing a whole-genome shotgun: Release 3 of the Drosophila melanogaster euchromatic genome sequence. Genome Biol 3: RESEARCH0079. [DOI] [PMC free article] [PubMed] [Google Scholar]
- Clark AG, Eisen MB, Smith DR, Bergman CM, Oliver B, Markow TA, Kaufman TC, Kellis M, Gelbart W, Iyer VN, et al. 2007. Evolution of genes and genomes on the Drosophila phylogeny. Nature 450: 203–218 [DOI] [PubMed] [Google Scholar]
- Csardi G, Nepusz T 2006. The igraph Software Package for Complex Network Research. InterJournal Complex Systems: 1695 [Google Scholar]
- Czech B, Malone CD, Zhou R, Stark A, Schlingeheyde C, Dus M, Perrimon N, Kellis M, Wohlschlegel JA, Sachidanandam R, et al. 2008. An endogenous small interfering RNA pathway in Drosophila. Nature 453: 798–802 [DOI] [PMC free article] [PubMed] [Google Scholar]
- Derrien T, Johnson R, Bussotti G, Tanzer A, Djebali S, Tilgner H, Guernec G, Martin D, Merkel A, Knowles DG, et al. 2012. The GENCODE v7 catalog of human long noncoding RNAs: Analysis of their gene structure, evolution, and expression. Genome Res 22: 1775–1789 [DOI] [PMC free article] [PubMed] [Google Scholar]
- Drosophila 12 Genomes Consortium Clark AG, Eisen MB, Smith DR, Bergman CM, Oliver B, Markow TA, Kaufman TC, Kellis M, Gelbert W, et al. 2007. Evolution of genes and genomes on the Drosophila phylogeny. Nature 450: 203–218 [DOI] [PubMed] [Google Scholar]
- Dunham I, Kundaje A, Aldred SF, Collins PJ, Davis CA, Doyle F, Epstein CB, Frietze S, Harrow J, Kaul R, et al. 2012. An integrated encyclopedia of DNA elements in the human genome. Nature 489: 57–74 [DOI] [PMC free article] [PubMed] [Google Scholar]
- Edgar RC 2004. MUSCLE: A multiple sequence alignment method with reduced time and space complexity. BMC Bioinformatics 5: 113. [DOI] [PMC free article] [PubMed] [Google Scholar]
- Fire A, Xu S, Montgomery MK, Kostas SA, Driver SE, Mello CC 1998. Potent and specific genetic interference by double-stranded RNA in Caenorhabditis elegans. Nature 391: 806–811 [DOI] [PubMed] [Google Scholar]
- Giardine B, Riemer C, Hardison RC, Burhans R, Elnitski L, Shah P, Zhang Y, Blankenberg D, Albert I, Taylor J, et al. 2005. Galaxy: A platform for interactive large-scale genome analysis. Genome Res 15: 1451–1455 [DOI] [PMC free article] [PubMed] [Google Scholar]
- Guo P 2010. The emerging field of RNA nanotechnology. Nat Nanotechnol 5: 833–842 [DOI] [PMC free article] [PubMed] [Google Scholar]
- Hartswood E, Brodie J, Vendra G, Davis I, Finnegan DJ 2012. RNA:RNA interaction can enhance RNA localization in Drosophila oocytes. RNA 18: 729–737 [DOI] [PMC free article] [PubMed] [Google Scholar]
- Huang da W, Sherman BT, Tan Q, Collins JR, Alvord WG, Roayaei J, Stephens R, Baseler MW, Lane HC, Lempicki RA 2007. The DAVID Gene Functional Classification Tool: A novel biological module-centric algorithm to functionally analyze large gene lists. Genome Biol 8: R183. [DOI] [PMC free article] [PubMed] [Google Scholar]
- Huang da W, Sherman BT, Lempicki RA 2009a. Bioinformatics enrichment tools: Paths toward the comprehensive functional analysis of large gene lists. Nucleic Acids Res 37: 1–13 [DOI] [PMC free article] [PubMed] [Google Scholar]
- Huang da W, Sherman BT, Lempicki RA 2009b. Systematic and integrative analysis of large gene lists using DAVID bioinformatics resources. Nat Protoc 4: 44–57 [DOI] [PubMed] [Google Scholar]
- Huang FW, Qin J, Reidys CM, Stadler PF 2009c. Partition function and base pairing probabilities for RNA–RNA interaction prediction. Bioinformatics 25: 2646–2654 [DOI] [PubMed] [Google Scholar]
- Huang FW, Qin J, Reidys CM, Stadler PF 2009d. Target prediction and a statistical sampling algorithm for RNA–RNA interaction. Bioinformatics 26: 175–181 [DOI] [PMC free article] [PubMed] [Google Scholar]
- Jambor H, Brunel C, Ephrussi A 2011. Dimerization of oskar 3′ UTRs promotes hitchhiking for RNA localization in the Drosophila oocyte. RNA 17: 2049–2057 [DOI] [PMC free article] [PubMed] [Google Scholar]
- Kato Y, Sato K, Hamada M, Watanabe Y, Asai K, Akutsu T 2010. RactIP: Fast and accurate prediction of RNA-RNA interaction using integer programming. Bioinformatics 26: i460–i466 [DOI] [PMC free article] [PubMed] [Google Scholar]
- Kent WJ, Sugnet CW, Furey TS, Roskin KM, Pringle TH, Zahler AM, Haussler D 2002. The human genome browser at UCSC. Genome Res 12: 996–1006 [DOI] [PMC free article] [PubMed] [Google Scholar]
- Krzywinski M, Schein J, Birol I, Connors J, Gascoyne R, Horsman D, Jones SJ, Marra MA 2009. Circos: An information aesthetic for comparative genomics. Genome Res 19: 1639–1645 [DOI] [PMC free article] [PubMed] [Google Scholar]
- Lieberman-Aiden E, van Berkum NL, Williams L, Imakaev M, Ragoczy T, Telling A, Amit I, Lajoie BR, Sabo PJ, Dorschner MO, et al. 2009. Comprehensive mapping of long-range interactions reveals folding principles of the human genome. Science 326: 289–293 [DOI] [PMC free article] [PubMed] [Google Scholar]
- Lozada-Chavez I, Stadler PF, Prohaska SJ 2011“Hypothesis for the modern RNA world”: A pervasive non-coding RNA-based genetic regulation is a prerequisite for the emergence of multicellular complexity. Orig Life Evol Biosph 41: 587–607 [DOI] [PubMed] [Google Scholar]
- McQuilton P, St Pierre SE, Thurmond J, FlyBase Consortium 2012. FlyBase 101—the basics of navigating FlyBase. Nucleic Acids Res 40(Database issue): D706–D714 [DOI] [PMC free article] [PubMed] [Google Scholar]
- Okamura K, Lai EC 2008. Endogenous small interfering RNAs in animals. Nat Rev Mol Cell Biol 9: 673–678 [DOI] [PMC free article] [PubMed] [Google Scholar]
- Okamura K, Balla S, Martin R, Liu N, Lai EC 2008. Two distinct mechanisms generate endogenous siRNAs from bidirectional transcription in Drosophila melanogaster. Nat Struct Mol Biol 15: 581–590 [DOI] [PMC free article] [PubMed] [Google Scholar]
- Salari R, Backofen R, Sahinalp SC 2010. Fast prediction of RNA-RNA interaction. Algorithms Mol Biol 5: 5. [DOI] [PMC free article] [PubMed] [Google Scholar]
- Seemann SE, Gorodkin J, Backofen R 2008. Unifying evolutionary and thermodynamic information for RNA folding of multiple alignments. Nucleic Acids Res 36: 6355–6362 [DOI] [PMC free article] [PubMed] [Google Scholar]
- Seemann SE, Richter AS, Gesell T, Backofen R, Gorodkin J 2010a. PETcofold: Predicting conserved interactions and structures of two multiple alignments of RNA sequences. Bioinformatics 27: 211–219 [DOI] [PMC free article] [PubMed] [Google Scholar]
- Seemann SE, Richter AS, Gorodkin J, Backofen R 2010b. Hierarchical folding of multiple sequence alignments for the prediction of structures and RNA-RNA interactions. Algorithms Mol Biol 5: 22. [DOI] [PMC free article] [PubMed] [Google Scholar]
- Sexton T, Yaffe E, Kenigsberg E, Bantignies F, Leblanc B, Hoichman M, Parrinello H, Tanay A, Cavalli G 2012. Three-dimensional folding and functional organization principles of the Drosophila genome. Cell 148: 458–472 [DOI] [PubMed] [Google Scholar]
- Simes R 1986. An improved Bonferroni procedure for multiple tests of significance. Biometrica 73: 751–754 [Google Scholar]
- Stark A, Lin MF, Kheradpour P, Pedersen JS, Parts L, Carlson JW, Crosby MA, Rasmussen MD, Roy S, Deoras AN, et al. 2007. Discovery of functional elements in 12 Drosophila genomes using evolutionary signatures. Nature 450: 219–232 [DOI] [PMC free article] [PubMed] [Google Scholar]
- Tafer H, Hofacker IL 2008. RNAplex: A fast tool for RNA–RNA interaction search. Bioinformatics 24: 2657–2663 [DOI] [PubMed] [Google Scholar]
- Taylor J, Schenck I, Blankenberg D, Nekrutenko A 2007. Using Galaxy to perform large-scale interactive data analyses. Curr Protoc Bioinformatics 10.1002/0471250953.bi1005s19 [DOI] [PMC free article] [PubMed] [Google Scholar]
- Tweedie S, Ashburner M, Falls K, Leyland P, McQuilton P, Marygold S, Millburn G, Osumi-Sutherland D, Schroeder A, Seal R, et al. 2009. FlyBase: Enhancing Drosophila gene ontology annotations. Nucleic Acids Res 37(Database issue): D555–D559 [DOI] [PMC free article] [PubMed] [Google Scholar]
- Wang JZ, Du Z, Payattakool R, Yu PS, Chen CF 2007. A new method to measure the semantic similarity of GO terms. Bioinformatics 23: 1274–1281 [DOI] [PubMed] [Google Scholar]
- Wickham H 2009. ggplot2: Elegant graphics for data analysis. Springer, Dordrecht, Heidelberg, London, New York [Google Scholar]
- Will CL, Lührmann R 2011. Spliceosome structure and function. Cold Spring Harb Perspect Biol 3: 10.110l/cshperspecta003707 [DOI] [PMC free article] [PubMed] [Google Scholar]
- Yu G, Li F, Qin Y, Bo X, Wu Y, Wang S 2010. GOSemSim: An R package for measuring semantic similarity among GO terms and gene products. Bioinformatics 26: 976–978 [DOI] [PubMed] [Google Scholar]
- Zaykin DV, Zhivotovsky LA, Westfall PH, Weir BS 2002. Truncated product method for combining P-values. Genet Epidemiol 22: 170–185 [DOI] [PubMed] [Google Scholar]
- Zhou R, Czech B, Brennecke J, Sachidanandam R, Wohlschlegel JA, Perrimon N, Hannon GJ 2009. Processing of Drosophila endo-siRNAs depends on a specific Loquacious isoform. RNA 15: 1886–1895 [DOI] [PMC free article] [PubMed] [Google Scholar]


