Abstract
Benzylsuccinate synthase (bssA) genes associated with toluene degradation were profiled across a groundwater contaminant plume under nitrate-reducing conditions and were detected in significant numbers throughout the plume. However, differences between groundwater and core sediment samples suggested that microbial transport, rather than local activity, was the underlying cause of the high copy numbers within the downgradient plume. Both gene transcript and reactant concentrations were consistent with this hypothesis. Expression of bssA genes from denitrifying toluene degraders was induced by toluene but only in the presence of nitrate, and transcript abundance dropped rapidly following the removal of either toluene or nitrate. The drop in bssA transcripts following the removal of toluene could be described by an exponential decay function with a half-life on the order of 1 h. Interestingly, bssA transcripts never disappeared completely but were always detected at some level if either inducer was present. Therefore, the detection of transcripts alone may not be sufficient evidence for contaminant degradation. To avoid mistakenly associating basal-level gene expression with actively degrading microbial populations, an integrated approach using the ratio of functional gene transcripts to gene copies is recommended. This approach minimizes the impact of microbial transport on activity assessment and allows reliable assessments of microbial activity to be obtained from water samples.
INTRODUCTION
The use of molecular biological tools has led to significant advancements in the area of in situ bioremediation. Of particulate note is the use of quantitative PCR (qPCR) for the detection and quantification of functional genes associated with the degradation of contaminants. However, as has been repeatedly demonstrated in both column and field studies, functional gene abundance is not always predictive of contaminant degradation, nor does it consistently correlate with gene expression or contaminant concentration (1, 2). Furthermore, high gene copy numbers are often sustained when there is little or no active degradation (3, 4), making such measurements difficult to interpret.
In some cases, microbial transport may provide an explanation for elevated gene copies in the absence of degradation. It has been suggested that genes recovered from groundwater samples may represent conditions upgradient of where they were sampled, because planktonic microorganisms are subjected to transport (5). As a result, organisms observed in groundwater samples may not reflect local chemical conditions; rather, their presence may be the result of transport from upstream locations where chemical conditions favored their activity and growth. The impact of microbial transport can be minimized by assessing activity with sediment sampling (6); however, the relative simplicity of groundwater sampling makes it more attractive from a practical standpoint.
Functional gene transcripts have been suggested as a more reliable indicator of local contaminant biodegradation, because they typically have half-lives of only a few hours (7) and, as a result, are too short-lived to be transported significant distances in the subsurface. Although expression of functional genes has been correlated with contaminant degradation in certain studies, the relationship between gene expression and activity varies with the particular genes examined (8, 9) and environmental stressors applied (10, 11). Furthermore, gene expression is sometimes observed in response to non-growth-supporting substrates (12, 13), consistent with the uncoupling of growth from biodegradation.
In the current study, we quantified the abundance of functional genes and gene transcripts in sediment and water samples from a large-scale model aquifer to assess the in situ activity of toluene-degrading organisms. We evaluated the effects of subsurface transport and substrate and electron acceptor concentrations on the distribution and activity of toluene degraders within the contaminant plume in order to identify metrics that would provide robust indicators of degradation activity.
MATERIALS AND METHODS
Samples were collected from a large physical model aquifer (Fig. 1) with the following dimensions: 7.3 m long by 2.4 m high by 0.5 m thick. The aquifer has been described elsewhere (6). Briefly, it was filled with medium sand of basaltic origin, and no microorganisms were added to the aquifer. Groundwater flow velocity was approximately 30 cm/day and was maintained using constant-head reservoirs at either end of the aquifer. Oxic tap water was supplied to the upgradient reservoir. A fluorescein tracer and dissolved toluene source (65 mg/liter) using helium-sparged water was continuously introduced near the upgradient end of the model, resulting in the formation of an anoxic plume. The system had been in continuous operation for over a year at the time of this study.
Fig 1.
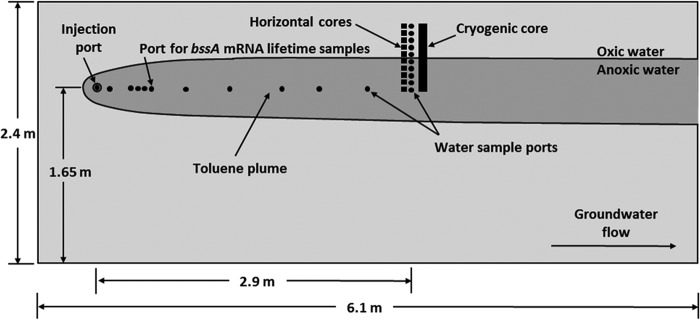
Side-view schematic drawing of the model aquifer and toluene plume. Groundwater flow in the model was from left to right. A vertical transect of groundwater sampling ports (black circles) was installed 2.9 m downgradient from the injection port. Ten additional groundwater sampling ports were installed along the centerline of the plume between the injection port and 2.9 m. A black rectangle is used to show the location of the cryogenically collected sediment core.
Initial investigations in the model aquifer involved water samples collected from an array of horizontal ports constructed on the side of the physical model and spanning the upper interface of the anoxic plume (Fig. 1). A vertical sediment core was collected cryogenically at the same downstream distance (2.9 m) using the method described by Johnson et al. (6). In subsequent experiments involving the addition and removal of nitrate from the injection source, samples were collected from ports installed along the centerline of the plume between the injection port and 2.9 m (Fig. 1).
DNA and RNA extraction and purification and cDNA conversion.
DNA extractions were performed on filtered water samples and 1-g fractions of sediment using the FastDNA spin kit for soil (MP Biomedicals, Solon, OH). Independent DNA extractions were performed on duplicate sediment subfractions from each depth. (Duplicate water samples were not possible without reducing sample resolution.) RNA was extracted from filters as described in reference 14. A similar procedure was used for sediment with the exception that 4 independent extractions were performed on replicate 1-g subfractions, and the RNA was pooled during elution. RNA was treated with Turbo DNA-free (Applied Biosystems, Carlsbad, CA) and was confirmed to be free of DNA contamination by RT-minus qPCR (a qPCR run without reverse transcriptase). Total RNA was converted to cDNA using SuperScript III and random primers (Invitrogen Corp., Carlsbad, CA) at a concentration of 300 ng in each 20-μl reaction mixture.
Primer design and construction of qPCR standards.
Experiments with the bssA qPCR primer set designed by Winderl et al. (15) to target the F1 cluster of bssA deltaproteobacterial clone sequences did not produce PCR products with DNA extracted from the model aquifer. However, the broad-specificity PCR primer set used to produce those clones (16) did yield a bssA signal with model aquifer DNA. It was concluded that F1-type organisms were not dominant in the model aquifer; therefore, a qPCR primer set was designed to target the same set of betaproteobacterial bssA sequences used to develop the broader primer set (16). Primers were designed using the CLC Genomics Workbench from conserved sequences of benzylsuccinate synthase (bssA) genes from denitrifying, toluene-degrading betaproteobacterial organisms: Thauera sp. DNT-1, Thauera aromatica K172, Thauera aromatica T1, Azoarcus sp. T, Azoarcus sp. EbN1, and Magnetospirillum sp. TS-6 (GenBank accession numbers AB066263_BAC05501.1, AJ001848_CAA05052.1, AF113168_AAC38454.1, AY032676_AAK50372.1, CR555306_c2A304, and AB167725_BAD42366.1, respectively). Primer sequences are as follows: 997F, 5′-CTG-CTG-TGG-CCS-TAY-TAC-AAG-3′; and 1230R, 5′-GAT-GGC-GTC-GGT-CAT-GTC-GKT-3′. Positions are given relative to the bssA gene of Azoarcus sp. EbN1.
Genomic DNA from the model aquifer was extracted and purified, and bssA gene sequences were PCR amplified in a MyiQ real-time qPCR detection system using iQ SYBR green Supermix (Bio-Rad Laboratories Inc., Hercules, CA) as follows. Primers were added to reactions at a final concentration of 200 nM. Cycling conditions consisted of 5 min initial denaturation at 95°C followed by 40 cycles of 45 s of denaturation at 95°C, 1 min annealing at 61.5°C, and a 1.5-min extension at 72°C. PCR products were purified using the Wizard SV gel and PCR cleanup system (Promega Corp., Madison, WI) and cloned into E. coli with the pCR2.1 vector system using a TOPO TA cloning kit (Invitrogen Corp., Carlsbad, CA) according to the manufacturers' instructions. Randomly selected clones were analyzed by PCR and gel electrophoresis to ensure the presence of the insert and sequenced with an ABI3130XL Genetic Analyzer (ABI, Foster City, CA) to confirm primer specificity.
For use as an external standard for quantification purposes, a plasmid with an insert sequence most similar to bssA from Magnetospirillum sp. TS-6 (98% sequence identity over 230 nucleotides [nt]) was linearized by digestion with restriction exonuclease XbaI (New England BioLabs, Ipswitch, MA) in a 200-μl reaction mixture. The products were purified using a plasmid purification kit (Qiagen, Valencia, CA), and concentrations of linearized plasmids were determined fluorometrically using PicoGreen (Invitrogen Corp., Carlsbad, CA) and a NanoDrop fluorometer (Thermo Scientific, Wilmington, DE) and were used to determine gene copy number based on the molecular weight of the plasmid. Specifically, a serial dilution of the linearized plasmid stock was quantified using the PicoGreen assay to ensure that the measurements were within the linear range of the instrument. A dilution from within the linear range was then selected as the starting point for the dilutions in the standard curve and remeasured in an independent assay as confirmation. Dilutions of linearized plasmids, each tested in duplicate, spanning 5 orders of magnitude were used as standard curves for the determination of gene copy numbers. Standard curves were linear over this range (1.7 × 101 to 1.7 × 10⁶ copies per reaction), with amplification efficiencies greater than 96%.
Quantification of bssA genes and gene transcripts.
Quantitative PCR was performed in an MyiQ real-time qPCR detection system using iQ SYBR green Supermix (Bio-Rad Laboratories Inc., Hercules, CA) as described above. qPCR data were analyzed using LinReg PCR (17), and gene copy numbers were determined by comparison to standard curves. Negative controls showed no signs of contamination through 40 cycles, as evidenced by analysis of amplification and melt curves.
Lifetime of bssA transcripts following removal of toluene.
A total of 800 ml of pore water was collected from a port along the plume centerline located 0.5 m downgradient of the injection port (Fig. 1). Toluene in the sample was removed by sparging with helium gas, which was also used to keep the sample anoxic, and the sample was incubated at room temperature. Subsamples (100 ml) for RNA analysis were collected at the beginning of the experiment (t = 0) and at 2, 4, 8, 12, 20, and 30 h. Samples for DNA analysis (25 ml) were also collected at the beginning and end of the experiment. Samples for both DNA and RNA analyses were filtered as described, frozen in liquid nitrogen, and stored at −80°C until extraction of nucleic acids. Additionally, 15-ml samples were collected periodically in gas-tight syringes for analysis of toluene and nitrate concentrations.
Geochemical analyses of water samples.
Water samples collected from the model aquifer ports and from the bssA lifetime experiment were analyzed for fluorescein, toluene, dissolved oxygen, and nitrate using methods described by Johnson et al. (6). Briefly, 15-ml water samples were collected in gas-tight syringes. Toluene concentrations were measured by headspace gas chromatography, dissolved oxygen (DO) with a flowthrough electrode, nitrate by ion chromatography, and fluorescein with a flowthrough fluorometer.
RESULTS
Prebiostimulation.
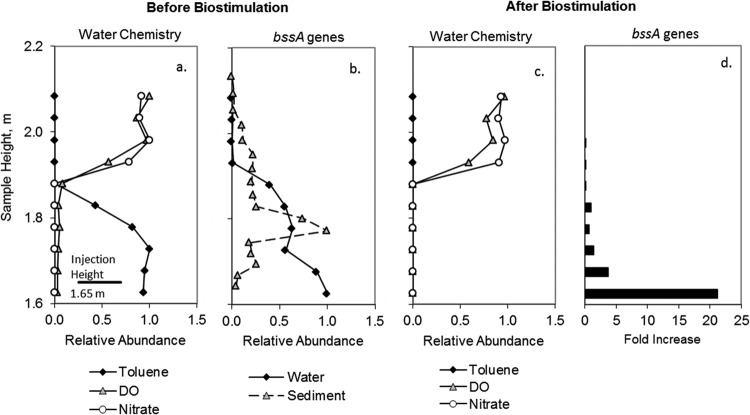
The introduction of toluene to the model aquifer resulted in the formation of an anoxic toluene plume within an otherwise oxic aquifer. This can be seen in Fig. 2a, which profiles the pore water concentrations of toluene, dissolved oxygen, and nitrate in a vertical transect extending from above the plume to the plume center. Prior to biostimulation with nitrate (i.e., at background nitrate levels of ∼2 mg/liter), the abundance of bssA genes from organisms that couple denitrification to toluene degradation was quantified in water samples and the core sample collected from this transect (Fig. 2b). The bssA gene encodes benzylsuccinate synthase, the key enzyme involved in anaerobic toluene degradation, and has been found in all microbial isolates capable of anaerobic toluene degradation to date (16).
Fig 2.
Vertical chemical profiles (a and c) and bssA gene abundance (b) in samples collected in a vertical transect 2.9 m downgradient of the injection port. Data are displayed as values relative to the sample of greatest concentration (in panel a, 82% saturation for DO, 1.7 mg/liter for nitrate, and 61 mg/liter for toluene; in panel b, 9.08 × 10⁶ copies/g for water and 5.23 × 10⁷ copies/g for sediment; in panel c, 83% saturation for DO, 2.3 mg/liter for nitrate, and 0 mg/liter for toluene). Panel d shows the fold increase in bssA gene abundance in pore water following biostimulation with nitrate.
Maximum bssA recovery was greater from sediment than from an equivalent mass of water (∼600% greater). This is consistent with sediment-attached organisms dominating the subsurface population, which has been repeatedly shown in both column experiments and in the field (18, 19). More importantly, the vertical distributions of bssA genes in sediment and water were distinctly different. Maximum bssA abundance in the sediment was largely confined to a narrow peak near the plume interface, where electron acceptor availability would be more favorable. The groundwater distribution of bssA genes showed the highest abundance near the center of the plume where there was no available nitrate and where toluene degradation was insignificant.
During and after biostimulation.
Nitrate was added to the injection solution at a concentration of 80 mg/liter to stimulate anaerobic biodegradation under denitrifying conditions. This resulted in the removal of >97% of the toluene within 0.5 m of the injection port, with no toluene detectable at any downgradient location (data not shown). Nitrate was also consumed within 0.5 m of the source. This is illustrated in Fig. 2c, which depicts the toluene, DO, and nitrate profiles 2.9 m downgradient of the injection port during biostimulation.
Abundance of the bssA gene in pore water at 2.9 m increased as much as 21-fold within the plume (Fig. 2d) during biostimulation. The increased recovery of bssA genes from nitrate and toluene-depleted pore water further supports the idea that the organisms harboring these genes originated upgradient, where biostimulation resulted in toluene degradation activity. In this case, gene expression activity should be much lower at 2.9 m than that at upgradient locations. However, under these conditions, it was not possible to assess the relationship between gene expression and chemical conditions, since none of the plume samples contained nitrate or toluene. To address this, the concentration of nitrate injected was reduced to 52 mg/liter, and water sampling ports were installed along the centerline of the plume between the injection port and the transect at 2.9 m (Fig. 1), in an attempt to capture the leading edge of the plume.
As shown in Fig. 3a, the concentrations of toluene and nitrate within the plume decreased to 4 and 0% of their influent concentrations, respectively, over 2.9 m. Over this distance, the abundance of bssA genes in pore water samples remained fairly constant along the length of the plume (Fig. 3b), showing no apparent relationship to either toluene or nitrate concentrations. In contrast, the abundance of bssA gene transcripts peaked (5.7 × 10⁶ ± 6.7 × 10⁵ copies per ml) at 0.5 m, where toluene and nitrate were present at 40 and 24% of their influent concentrations, respectively, and then decreased more than 300 times at 2.9 m. This supports the hypothesis that bssA genes detected downgradient in the plume were not highly expressed and likely originated nearer to the source zone of the plume. However, even at 2.9 m in our experiments (where no biodegradation was occurring), bssA transcripts were still detectable on the order of 104 to 105 copies/ml. Two possible explanations for this are that (i) a slow and potentially incomplete downregulation of bssA transcription occurred or (ii) bssA genes were constitutively transcribed at a basal level, even in the absence of inducers.
Fig 3.
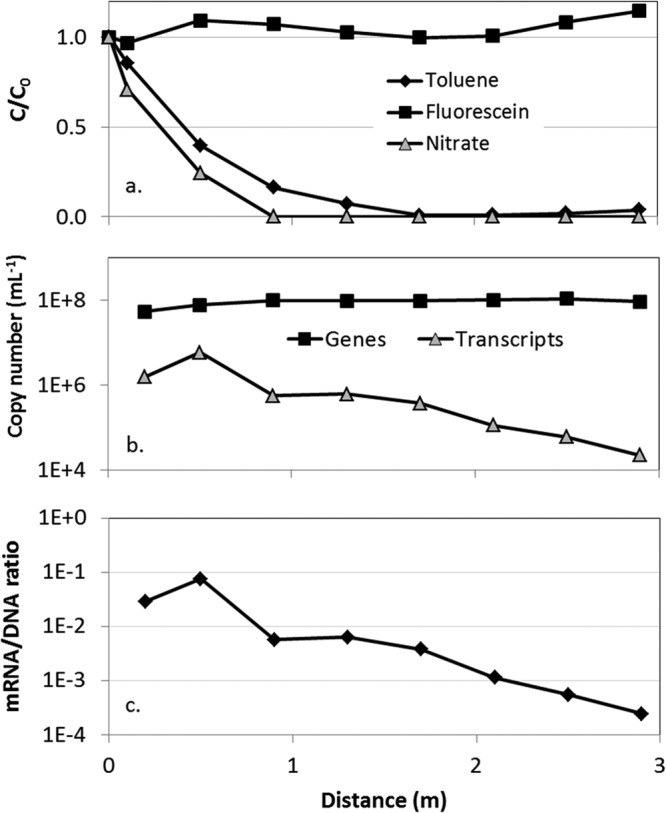
(a) Relative abundance of toluene, nitrate, and fluorescein in pore water collected along the centerline of the plume downgradient of the injection port. Also shown are the abundances of bssA genes and gene transcripts (b) and the ratio of bssA transcripts to bssA genes (c). Error bars (in panel b) representing the standard deviation of 2 independent PCRs are smaller than the width of the symbols and therefore not visible. Toluene and nitrate concentrations used for normalization were 65 and 42 mg/liter, respectively.
Toluene regulation of bssA gene expression.
To distinguish between incomplete downregulation and basal-level expression, we assessed the lifetime of bssA gene transcripts following the removal of toluene. An 800-ml sample of pore water was collected from the plume centerline port at 0.5 m, which had shown peak abundance of bssA transcripts (Fig. 3b). Toluene was removed from the sample by sparging with helium gas, and bssA gene expression was monitored over the next 30 h. The concentration of toluene fell to 3 and 1% of its initial value within 1 and 2 h, respectively, after which toluene was undetectable (detection limit of 50 μg/liter toluene) (Fig. 4a). Within the same 2 h, the abundance of bssA transcripts fell 92% (from a starting value of ∼2 × 10⁶ down to ∼1.6 × 10⁵) (Fig. 4b). Transcript abundance after this point remained fairly constant at ∼105 copies per ml.
Fig 4.
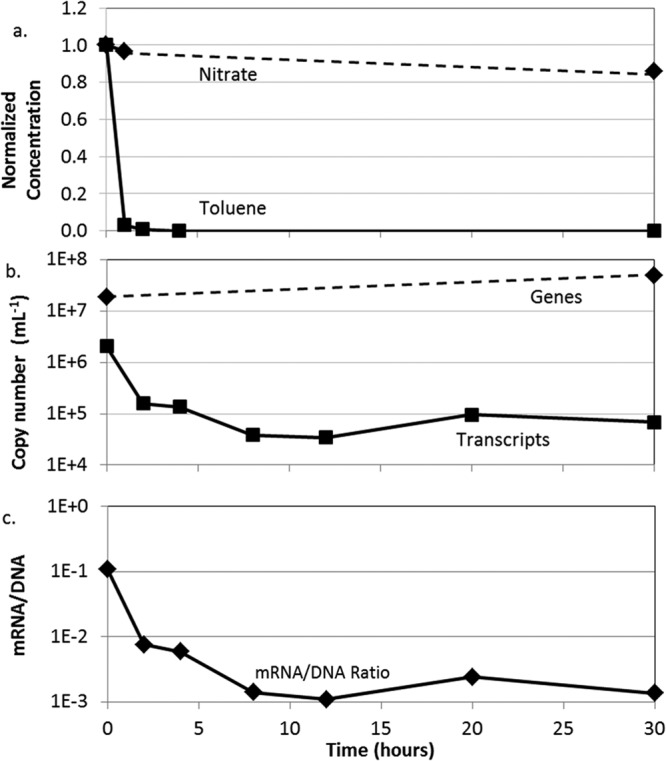
bssA mRNA lifetime following removal of toluene by sparging with helium gas. (a) Concentrations of nitrate and toluene over time, relative to their initial concentrations; (b) abundance of bssA gene and transcript copies/ml; and (c) bssA gene transcript/gene copy ratios. Initial toluene and nitrate concentrations were 11.2 and 15.5 mg/liter, respectively.
Nitrate regulation of bssA expression.
Results from both the model aquifer and the bssA lifetime experiment suggested that bssA gene expression was upregulated in response to toluene but only in the presence of the electron acceptor, nitrate. Therefore, we subsequently assessed whether availability of nitrate regulated bssA gene expression. Unlike toluene, nitrate cannot be sparged from a sample. To evaluate how quickly bssA gene expression was downregulated in response to the depletion of nitrate, biostimulation in the model aquifer was ceased, and bssA gene abundance and expression were monitored at 0.5 m downgradient of the injection location.
Toluene degradation ceased rapidly following the termination of biostimulation, and the toluene plume evolved down the length of the model aquifer (Fig. 5). Within 3 weeks, the toluene plume had reached its prebiostimulation state. Note that the toluene concentration went up in response to the loss of degradation (Fig. 6a). Changes in groundwater chemistry were accompanied by significant changes in the abundance and expression of bssA genes at 0.5 m in the plume. By day 3, the transcript copies had dropped more than an order of magnitude (from a starting value of ∼1.5 × 10⁷ down to ∼6 × 10⁵) (Fig. 6b). This coincided with the complete disappearance of nitrate from the system, as well as the first observed movement of the leading edge of the toluene plume (Fig. 5; 3 days).
Fig 5.
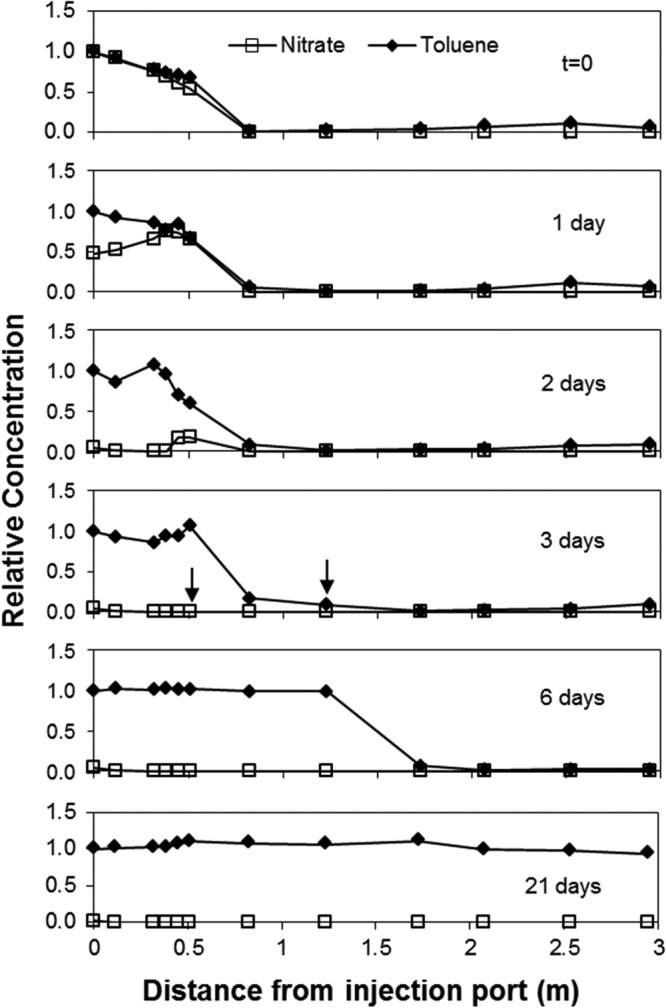
Profiles of toluene and nitrate in the model aquifer following the termination of biostimulation with nitrate. Toluene data are presented relative to injection concentration. Nitrate data presented relative to injection concentration prior to termination. Arrows are present to indicate the points at which nitrate was no longer detectable and the leading edge of the toluene plume began to move. Toluene and nitrate concentrations used for normalization were 29.7 and 43.8 mg/liter, respectively.
Fig 6.
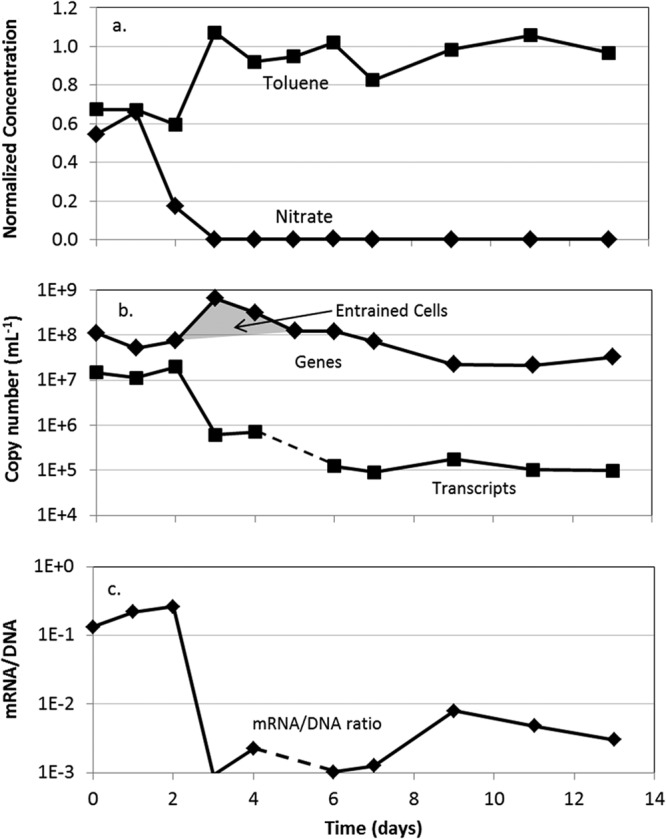
Time series data at 0.5 m downgradient from the injection point in the days following cessation of nitrate biostimulation. Shown are toluene and nitrate concentrations (a) corresponding to abundance of bssA genes and gene transcripts in pore water from along the centerline of the plume (b) and ratios of bssA gene transcripts to gene copies (c). Toluene and nitrate concentrations used for normalization were 29.7 and 43.8 mg/liter, respectively.
DISCUSSION
Quantification of functional gene copies.
Prebiostimulation profiling of bssA genes in sediment and pore water from the model aquifer revealed distinct differences in distribution related to potential transport artifacts. Sediment concentrations reached a maximum in the “plume fringe,” where overlapping countergradients of electron donors and acceptors existed (15, 20). The high abundance of bssA genes in nitrate-depleted water, however, suggested the possibility that genes detected there did not represent actively degrading populations but were instead associated with organisms that originated upgradient, where chemical conditions favored their growth. These results were similar to those from a recent report involving the same model aquifer and tmoA, a gene involved in the aerobic degradation of toluene via a monooxygenase pathway (6). The data showed that tmoA gene copy numbers in water samples peaked within the anoxic plume core, while in the sediment they were most abundant at the oxic/anoxic interface. Given the long distances a microorganism can travel in the subsurface (21, 22), this limits the likelihood of developing useful correlations between gene abundance and contaminant concentration, gene expression, or degradation activity.
Quantification of functional gene transcripts.
Biostimulation with nitrate led to a 21-fold increase in abundance of bssA genes in pore water at 2.9 m within the plume (Fig. 2d). Transcripts were quantified to determine whether the genes were being actively expressed. The peak abundance of bssA gene transcripts at 0.5 m coincided with significant quantities of toluene and nitrate (measured at 40 and 24% of their influent concentrations, respectively) and toluene degradation activity (Fig. 3b). At 2.9 m, where toluene and nitrate were depleted, transcript copy numbers had decreased more than 300 times. These results suggested that gene expression was a better indicator of both geochemical conditions within the plume and actively degrading populations than genes themselves. Given the short-lived nature of bacterial mRNA (23), this is not surprising. However, taking into consideration the fact that bssA transcripts were still detectable at 2.9 m on the order of 104 to 105 copies per ml, this suggests that the detection of functional gene transcripts is not sufficient to demonstrate biodegradation activity.
Effects of toluene and nitrate on transcript copy number.
Toluene has been shown to induce expression of bssA under both aerobic and anaerobic conditions in Thauera sp. strain DNT-1 (24) and of a suite of genes (including bssA) and gene products involved in anaerobic toluene degradation in Azoarcus sp. strains T and EbN1 (25, 26). Note that in each case, induction took place in the presence of nitrate. The removal of toluene from pore water resulted in an order-of-magnitude decrease in bssA transcript copy number within ∼2 h (Fig. 4a and b). This indicates that bssA gene expression was downregulated quickly in the absence of toluene. However, the persistence of transcripts at about 105 copies/ml, extending at least 30 h after the removal of toluene, indicates that bssA transcription may occur at a basal level even in the absence of toluene. This further supports the idea that detection of bssA gene transcripts alone is not sufficient to indicate toluene degradation activity.
Termination of biostimulation resulted in an increase in toluene (because it was no longer being degraded) and a decrease in nitrate in the model aquifer. Coincident with these changes, bssA transcript copies decreased by more than an order of magnitude (Fig. 6a and b). This result suggests that bssA gene expression was also regulated by the availability of nitrate.
Transport effects.
After termination of biostimulation, the increase of more than an order of magnitude in bssA gene abundance observed at 0.5 m on day three (Fig. 6b) is evidence of increased microbial transport due to the change in geochemical conditions and is consistent with observations made during other periods of change in the aquifer. We believe this result was due to reentrainment of attached cells following the reduction in pore water ionic strength caused by the removal of nitrate. Reentrainment upon decreases in ionic strength results from expansion of the electrical double layer surrounding particles and sediment surfaces. As a result, the effective distance of electrostatic repulsion increases, causing the release of particles reversibly held in secondary energy minima (27). This phenomenon has been well documented for both biological (28) and nonbiological colloids (29) in saturated porous media.
Integrated mRNA/DNA approach.
The bssA transcripts continued to be detected at >104 copies/ml even 3 weeks after nitrate depletion (Fig. 6b). From these results, it is evident that a simple presence-versus-absence approach to interpreting gene expression data is inadequate for assessing the in situ physiological state of the toluene degraders in this system. In fact, 104 to 105 bssA transcripts/ml could be detected in all plume samples depleted in both nitrate and toluene, as well as those from the bssA lifetime experiments. This suggests that bssA genes were expressed at low levels, even in the absence of inducers. (However, the steady decline in transcripts over distance when both inducers were depleted [Fig. 3b] does suggest that one or the other inducer must be present for sustained basal-level transcription.)
Constitutive expression of catabolic genes is thought to confer a selective advantage for organisms inhabiting oligotrophic environments. In carbon- and energy-limited environments, constitutive expression increases an organism's capacity to react quickly to transiently available nutrients (30). For example, in what they termed “catabolic preparedness,” Trautwein et al. (31) recently demonstrated that Azoarcus sp. EbN1 expressed a large number of proteins involved in anaerobic hydrocarbon degradation despite the absence of their respective substrates from the growth medium. Given the oligotrophic nature of most groundwater systems, it is possible that many of the catabolic genes associated with contaminant degradation also exhibit some degree of constitutive expression, thus making a presence/absence approach to interpreting gene expression data insufficient. This is, in fact, likely to be the case for studies in most natural systems, in which microorganisms are generally believed to be limited by nutrients for growth (32).
To differentiate between constitutive expression and gene expression associated with actively degrading populations of organisms, it was necessary to take an integrated approach. For example, model aquifer samples containing both toluene and nitrate consistently had higher bssA gene transcript/gene copy number ratios than those samples lacking either nitrate or both toluene and nitrate (Fig. 3c, 4c, and 6c). Ratios on the order of 10−1 were consistently associated with samples in which toluene degradation coupled to nitrate reduction was actively taking place, while ratios 1 to 2 orders of magnitude lower were observed in areas where no active toluene degradation was occurring. A comparable relationship was seen in samples from the bssA lifetime experiment, in which the transcript-to-gene ratio was reduced from 0.12 to 0.001 following the removal of toluene.
The recovery of lower numbers of transcript to corresponding gene copies has been reported in other studies examining functional gene expression in the environment (8, 10, 33–35). This may be the result of partially active populations due to physiological differences among members, differential extraction efficiencies, incomplete conversion of mRNA into cDNA during the reverse transcription reaction, or other factors (33–36).
In the likelihood that many genes involved in contaminant degradation may also be constitutively expressed, an integrated mRNA/DNA approach could provide more-robust evidence for active degradation than quantification of either gene copies or transcripts alone. An appropriate “activity threshold” (mRNA/DNA ratio) would need to be determined experimentally for each gene in question, but in doing so, accurate assessments of in situ degradation could be made from water samples, without concern for transport artifacts. Molecular analysis of sediment samples has been shown to better reflect solution chemistry and degradation activity when using a DNA-only approach (6). However, sediment sampling presents a unique set of challenges that make groundwater sampling more practical, particularly when repetitive sampling is necessary, as is the case for monitored natural attenuation. Therefore, an integrated mRNA/DNA approach improves our ability to use pore water sampling to assess microbial degradation of contaminants.
ACKNOWLEDGMENTS
This work was supported by the U.S. Department of Defense's Strategic Environmental Research and Development Program (SERDP) under Project ER-1559, National Science Foundation (NSF) grant number MCB-0644468, and an Achievement Rewards for College Scientists (ARCS) Foundation Scholarship (CNB).
This report has not been subjected to review by SERDP, NSF, or the ARCS Foundation and, therefore, does not necessarily reflect their views, and no official endorsement should be inferred.
Footnotes
Published ahead of print 28 June 2013
REFERENCES
- 1.Lovley DR. 2003. Cleaning up with genomics: applying molecular biology to bioremediation. Nat. Rev. Microbiol. 1:35–44 [DOI] [PubMed] [Google Scholar]
- 2.van der Zaan B, Hannes F, Hoekstra N, Rijnaarts H, de Vos WM, Smidt H, Gerritse J. 2010. Correlation of Dehalococcoides 16S rRNA and chloroethene-reductive dehalogenase genes with geochemical conditions in chloroethene-contaminated groundwater. Appl. Environ. Microbiol. 76:843–850 [DOI] [PMC free article] [PubMed] [Google Scholar]
- 3.Scheutz C, Durant ND, Dennis P, Hansen MH, Jorgensen T, Jakobsen R, Cox EE, Bjerg PL. 2008. Concurrent ethene generation and growth of Dehalococcoides containing vinyl chloride reductive dehalogenase genes during an enhanced reductive dechlorination field demonstration. Environ. Sci. Technol. 42:9302–9309 [DOI] [PubMed] [Google Scholar]
- 4.Kazy SK, Monier AL, Alvarez PJJ. 2010. Assessing the correlation between anaerobic toluene degradation activity and bssA concentrations in hydrocarbon-contaminated aquifer material. Biodegradation 21:793–800 [DOI] [PubMed] [Google Scholar]
- 5.Ginn TR, Wood BD, Nelson KE, Scheibe TD, Murphy EM, Prabhakar Clement T. 2002. Processes in microbial transport in the natural subsurface. Adv. Water Res. 25:1017–1042 [Google Scholar]
- 6.Johnson RL, Brow CN, O'Brien Johnson R, Simon HM. 2012. Cryogenic core collection and preservation of subsurface samples for biomolecular analysis. Ground Water Monitor. Remed. 33:38–43 [Google Scholar]
- 7.Lee PK, Johnson DR, Holmes VF, He J, Alvarez-Cohen L. 2006. Reductive dehalogenase gene expression as a biomarker for physiological activity of Dehalococcoides spp. Appl. Environ. Microbiol. 72:6161–6168 [DOI] [PMC free article] [PubMed] [Google Scholar]
- 8.Lee PK, Macbeth TW, Sorenson KS, Jr, Deeb RA, Alvarez-Cohen L. 2008. Quantifying genes and transcripts to assess the in situ physiology of “Dehalococcoides” spp. in a trichloroethene-contaminated groundwater site. Appl. Environ. Microbiol. 74:2728–2739 [DOI] [PMC free article] [PubMed] [Google Scholar]
- 9.Rahm BG, Richardson RE. 2008. Correlation of respiratory gene expression levels and pseudosteady-state PCE respiration rates in Dehalococcoides ethenogenes. Environ. Sci. Technol. 42:416–421 [DOI] [PubMed] [Google Scholar]
- 10.Amos BK, Ritalahti KM, Cruz-Garcia C, Padilla-Crespo E, Loffler FE. 2008. Oxygen effect on Dehalococcoides viability and biomarker quantification. Environ. Sci. Technol. 42:5718–5726 [DOI] [PubMed] [Google Scholar]
- 11.Fletcher KE, Costanza J, Cruz-Garcia C, Ramaswamy NS, Pennell KD, Loffler FE. 2011. Effects of elevated temperature on Dehalococcoides dechlorination performance and DNA and RNA biomarker abundance. Environ. Sci. Technol. 45:712–718 [DOI] [PubMed] [Google Scholar]
- 12.Maymo-Gatell X, Chien Y, Gossett JM, Zinder SH. 1997. Isolation of a bacterium that reductively dechlorinates tetrachloroethene to ethene. Science 276:1568–1571 [DOI] [PubMed] [Google Scholar]
- 13.Johnson DR, Lee PK, Holmes VF, Fortin AC, Alvarez-Cohen L. 2005. Transcriptional expression of the tceA gene in a Dehalococcoides-containing microbial enrichment. Appl. Environ. Microbiol. 71:7145–7151 [DOI] [PMC free article] [PubMed] [Google Scholar]
- 14.Smith M, Herfort L, Tyrol K, Suciu D, Campbell V, Crump BC, Peterson TD, Zuber P, Baptista AM, Simon HM. 2010. Seasonal changes in bacterial and archaeal gene expression patterns across salinity gradients of the Columbia River coastal margin. PLoS One 5:e13312. 10.1371/journal.pone.0013312 [DOI] [PMC free article] [PubMed] [Google Scholar]
- 15.Winderl C, Anneser B, Griebler C, Meckenstock RU, Lueders T. 2008. Depth-resolved quantification of anaerobic toluene degraders and aquifer microbial community patterns in distinct redox zones of a tar oil contaminant plume. Appl. Environ. Microbiol. 74:792–801 [DOI] [PMC free article] [PubMed] [Google Scholar]
- 16.Winderl C, Schaefer S, Lueders T. 2007. Detection of anaerobic toluene and hydrocarbon degraders in contaminated aquifers using benzylsuccinate synthase (bssA) genes as a functional marker. Environ. Microbiol. 9:1035–1046 [DOI] [PubMed] [Google Scholar]
- 17.Ruijter JM, Ramakers C, Hoogaars WM, Karlen Y, Bakker O, van den Hoff MJ, Moorman AF. 2009. Amplification efficiency: linking baseline and bias in the analysis of quantitative PCR data. Nucleic Acids Res. 37:e45. [DOI] [PMC free article] [PubMed] [Google Scholar]
- 18.Doong RA, Chang SM. 2000. Relationship between electron donor and microorganism on the dechlorination of carbon tetrachloride by an anaerobic enrichment culture. Chemosphere 40:1427–1433 [DOI] [PubMed] [Google Scholar]
- 19.Brad T, van Breukelen BM, Braster M, van Straalen NM, Roling WF. 2008. Spatial heterogeneity in sediment-associated bacterial and eukaryotic communities in a landfill leachate-contaminated aquifer. FEMS Microbiol. Ecol. 65:534–543 [DOI] [PubMed] [Google Scholar]
- 20.Wilson RD, Thornton SF, Mackay DM. 2004. Challenges in monitoring the natural attenuation of spatially variable plumes. Biodegradation 15:359–369 [DOI] [PubMed] [Google Scholar]
- 21.Laskin AI. 1988. Advances in applied microbiology, p 378 Academic Press, New York, NY [Google Scholar]
- 22.Johnson WP, Zhang P, Fuller ME, Scheibe TD, Mailloux BJ, Onstott TC, Deflaun MF, Hubbard SS, Radtke J, Kovacik WP, Holben W. 2001. Ferrographic tracking of bacterial transport in the field at the narrow channel focus area, Oyster, VA. Environ. Sci. Technol. 35:182–191 [DOI] [PubMed] [Google Scholar]
- 23.Kushner SR. 2004. mRNA decay in prokaryotes and eukaryotes: different approaches to a similar problem. IUBMB Life 56:585–594 [DOI] [PubMed] [Google Scholar]
- 24.Shinoda Y, Sakai Y, Uenishi H, Uchihashi Y, Hiraishi A, Yukawa H, Yurimoto H, Kato N. 2004. Aerobic and anaerobic toluene degradation by a newly isolated denitrifying bacterium, Thauera sp. DNT-1. Appl. Environ. Microbiol. 70:1385–1392 [DOI] [PMC free article] [PubMed] [Google Scholar]
- 25.Achong G, Rodriguez A, Spormann A. 2001Cloning, sequencing, transcriptional organization, and its role in anaerobic toluene and m-xylene mineralization. J. Bacteriol. 183:6763–6770 [DOI] [PMC free article] [PubMed] [Google Scholar]
- 26.Kühner S, Wöhlbrand L, Fritz I, Wruck W, Hultschig C, Hufnagel P, Kube M, Reinhardt R, Rabus R. 2005. Substrate-dependent regulation of anaerobic degradation pathways for toluene and ethylbenzene in a denitrifying bacterium, strain EbN1. J. Bacteriol. 187:1493–1503 [DOI] [PMC free article] [PubMed] [Google Scholar]
- 27.Tong M, Li X, Brow CN, Johnson WP. 2005. Detachment-influenced transport of an adhesion-deficient bacterial strain within water-reactive porous media. Environ. Sci. Technol. 39:2500–2508 [DOI] [PubMed] [Google Scholar]
- 28.Lee CG, Park SJ, Han YU, Park JA, Kim SB. 2010. Bacterial attachment and detachment in aluminum-coated quartz sand in response to ionic strength change. Water Environ. Res. 82:499–505 [DOI] [PubMed] [Google Scholar]
- 29.Tong M, Johnson WP. 2007. Colloid population heterogeneity drives hyperexponential deviation from classic filtration theory. Environ. Sci. Technol. 41:493–499 [DOI] [PubMed] [Google Scholar]
- 30.Ihssen J, Egli T. 2005. Global physiological analysis of carbon- and energy-limited growing Escherichia coli confirms a high degree of catabolic flexibility and preparedness for mixed substrate utilization. Environ. Microbiol. 7:1568–1581 [DOI] [PubMed] [Google Scholar]
- 31.Trautwein K, Lahme S, Wöhlbrand L, Feenders C, Mangelsdorf K, Harder J, Steinbüchel A, Blasius B, Reinhardt R, Rabus R. 2012. Physiological and proteomic adaptation of “Aromatoleum aromaticum” EbN1 to low growth rates in benzoate-limited, anoxic chemostats. J. Bacteriol. 194:2165–2180 [DOI] [PMC free article] [PubMed] [Google Scholar]
- 32.Roszak DB, Colwell RR. 1987. Survival strategies of bacteria in the natural environment. Microbiol. Rev. 51:365–379 [DOI] [PMC free article] [PubMed] [Google Scholar]
- 33.Nicol G, Leininger S, Schleper C, Prosser J. 2008. The influence of soil pH on the diversity, abundance and transcriptional activity of ammonia oxidising archaea and bacteria. Environ. Microbiol. 10:2966–2978 [DOI] [PubMed] [Google Scholar]
- 34.Nicolaisen MH, Bælum J, Jacobsen CS, Sørensen J. 2008. Transcription dynamics of the functional tfdA gene during MCPA herbicide degradation by Cupriavidus necator AEO106 (pRO101) in agricultural soil. Environ. Microbiol. 10:571–579 [DOI] [PubMed] [Google Scholar]
- 35.Freitag TE, Prosser JI. 2009. Correlation of methane production and functional gene transcriptional activity in a peat soil. Appl. Environ. Microbiol. 75:6679–6687 [DOI] [PMC free article] [PubMed] [Google Scholar]
- 36.Freeman WM, Walker SJ, Vrana KE. 1999. Quantitative RT-PCR: pitfalls and potential. Biotechniques 26:112–125 [DOI] [PubMed] [Google Scholar]


