

Abstract
The hemagglutination inhibition (HAI) assay is the primary measurement used for identifying antigenically novel influenza virus strains. HAI assays measure the amount of reference sera required to prevent virus binding to red blood cells. Receptor binding avidities of viral strains are not usually taken into account when interpreting these assays. Here, we created antigenic maps of human H3N2 viruses that computationally account for variation in viral receptor binding avidities. These new antigenic maps differ qualitatively from conventional antigenic maps based on HAI measurements alone. We experimentally focused on an antigenic cluster associated with a single N145K hemagglutinin (HA) substitution that occurred between 1992 and 1995. Reverse-genetics experiments demonstrated that the N145K HA mutation increases viral receptor binding avidity. Enzyme-linked immunosorbent assays (ELISA) revealed that the N145K HA mutation does not prevent antibody binding; rather, viruses possessing this mutation escape antisera in HAI assays simply by attaching to cells more efficiently. Unexpectedly, we found an asymmetric antigenic effect of the N145K HA mutation. Once H3N2 viruses acquired K145, an epitope involving amino acid 145 became antigenically dominant. Antisera raised against an H3N2 strain possessing K145 had reduced reactivity to H3N2 strains possessing N145. Thus, individual mutations in HA can influence antigenic groupings of strains by altering receptor binding avidity and by changing the dominance of antibody responses. Our results indicate that it will be important to account for variation in viral receptor binding avidity when performing antigenic analyses in order to identify genuine antigenic differences among influenza virus variants.
INTRODUCTION
Influenza viruses infect 5 to 20% of the U.S. population on an annual basis, causing up to 49,000 deaths every year (1). Antibodies (Abs) directed against influenza viruses' glycoproteins, hemagglutinin (HA) and neuraminidase (NA), are very effective in preventing infection. Conventional vaccines are designed to elicit these types of antibodies; however, influenza viruses constantly accumulate mutations in antibody binding sites on HA and NA, a process termed antigenic drift. Vaccines currently licensed by the FDA include only 3 or 4 viral strains (one H1N1 influenza A, one H3N2 influenza A, and one or two influenza B viruses). Devastating consequences occur when vaccine strains are antigenically mismatched to circulating strains, as was the case during the 2003-2004 season (2).
The WHO established the Global Influenza Surveillance Network in 1952 to monitor the spread of antigenically distinct viral strains. This surveillance team, consisting of over 135 National Influenza Centers in 105 countries, extensively characterizes thousands of viral isolates every year (3). The antigenic profile of each viral isolate is determined through hemagglutination inhibition (HAI) assays using reference sera generated in ferrets. The 70-year-old HAI assay measures reference sera's ability to prevent binding (agglutination) of influenza viruses to red blood cells (RBCs) (4). This assay is powerful, since it can be completed in a high-throughput, inexpensive manner in laboratories across the world. The HAI assay, however, is not perfect; viral isolates that bind to red blood cells with high avidities can be falsely defined as antigenically novel, and viral isolates that bind to cells with low avidities can be falsely defined as antigenically neutral, even if they are truly antigenically distinct (5–7).
Influenza virus isolates have a wide range of different receptor binding avidities (5–11), and viruses with high receptor binding avidity can escape antibody responses in HAI assays by attaching to cells more efficiently (5–7, 9). However, vaccines should not necessarily be updated when viruses acquire mutations that increase viral receptor binding avidity, because many times these mutations result in limited antigenic changes (5–7, 9). In the 1940s and 1950s, it was quickly noted that changes in viral receptor binding avidity can impact HAI assays (12, 13). However, the WHO still does not systematically account for this when interpreting HAI data and making vaccine strain recommendations. Recent thermodynamic models have proposed how viral receptor avidity influences HAI data (14), but to our knowledge, no method to correct HAI data for receptor variation has been systematically tested in experimental systems.
Smith et al. created antigenic maps using HAI data generated with 273 human H3N2 viral isolates and 79 postinfection ferret antisera (15). This study showed that viruses can be grouped into distinct antigenic clusters over time, and that large antigenic changes occur every few years. Importantly, this analysis identified specific HA amino acid substitutions that are responsible for transitions to new antigenic clusters. Many antigenic cluster transitions are caused by amino acid substitutions in several antigenic sites. For example, a new antigenic cluster appearing in 1977 was caused by 13 amino acid substitutions in all 5 HA antigenic sites, and a new antigenic cluster in 1997 resulted from 6 mutations in 4 HA antigenic sites (15). However, some antigenic cluster transitions are caused by amino acid substitutions that have disproportionately large antigenic effects. A new cluster that appeared in 1979 was caused by mutations in only 2 antigenic sites, and even more striking, antigenic cluster transitions in 1987 and 1992 were caused by a single HA amino acid substitution (N145K). Notably, the Smith et al. analysis did not directly account for variations in viral receptor binding avidities.
We hypothesize that disproportionately large HAI antigenic effects can be caused by single HA mutations that alter viral receptor binding avidity. In the current study, we test this hypothesis by creating antigenic maps of human H3N2 viruses that computationally account for variation in receptor binding avidities. We then use reverse-genetics approaches to mechanistically determine how a single HA mutation affects antigenic clustering of human H3N2 viruses.
MATERIALS AND METHODS
Viruses.
Viruses possessing the HA of A/Nanchang/933/95 or A/New York/774/93 were rescued via reverse genetics using NA and internal genes of A/Nanchang/933/95. A/Nanchang/933/95 (GenBank accession number AFG72625) has a lysine at position 145, and A/New York/774/93 (GenBank accession number ABI21310) has an asparagine at position 145. We cloned the HA of A/New York/774/93 into the pHW2000 plasmid, and A/Nanchang/933/95 plasmids were provided by Jesse Bloom (Fred Hutchinson Cancer Center). Single-amino-acid changes to the HA genes were made using the QuikChange site-directed mutagenesis kit (Stratagene, La Jolla, CA). All viruses were propagated in MDCK cells, and the supernatant was harvested through a 0.45-μm filter (Millipore, Billerica, MA). The HA genes of viruses were sequenced to verify that additional mutations did not arise during propagation.
Antisera.
Ferret antisera were prepared at the AAALAC-accredited company, Spring Valley Laboratories (Woodbine, MD), using protocols approved by the Spring Valley Laboratories Animal Care and Use Committee. Ferrets were intranasally infected with 1 × 10⁵ 50% tissue culture infectious doses (TCID50) of each virus in 0.5 ml and bled 14 days later. All serum samples were pretreated with receptor-destroying enzyme (RDE; cholera filtrate; Sigma, St. Louis, MO) overnight at 37°C.
HAI assay.
As previously described (6), HAI titrations were performed in 96-well round plates (BD, Franklin Lakes, NJ). Sera were treated overnight with RDE to remove nonspecific inhibitors. Sera were serially diluted 2-fold and added to 4 agglutinating doses of virus in a total volume of 100 μl, after which 12.5 μl of a 2% (vol/vol) solution of turkey red blood cells (Lampire Biological Laboratories, Pipersville, PA) was added. The sera, virus, and red blood cells were mixed, and the assay was read out after incubating for 1 h at room temperature. HAI titers were recorded as the inverse of the highest dilution that inhibited hemagglutination of turkey red blood cells.
Receptor binding assay.
Turkey red blood cells were pretreated with different amounts (0.5 to 80 μg/ml) of RDE (a neuraminidase) for 1 h at 37°C. The red blood cells were then washed once with phosphate-buffered saline (PBS), and then 2% (vol/vol) red blood cell solutions were made using PBS. Aliquots (12.5 μl) of each 2% solution were added to 4 agglutinating doses of influenza A virus (as determined on non-RDE-treated red blood cells) in a total volume of 62.5 μl. Virus- and RDE-treated red blood cells were allowed to incubate for 1 h at room temperature, and then agglutination was measured. Data are expressed as the maximal concentration of RDE that still allowed for full agglutination.
Enzyme-linked immunosorbent assays (ELISAs).
Sucrose gradient-purified viruses were diluted in PBS and added to 96-well flat-bottom microtiter plates (Thermo Fisher Scientific, Waltham, MA) at 15 hemagglutinating units (HAU) per well. An H3-specific mouse monoclonal antibody generated in our laboratory (clone K1-4C10) was used to verify that equal amounts of each virus were used in these studies. After incubation for >15 h at 4°C, wells were blocked with PBS-bovine serum albumin (BSA). Ferret sera then were added (serial 2-fold dilutions) and allowed to incubate for 2 h at room temperature. After washing, goat anti-ferret horseradish peroxidase (HRP) antibody (Abcam, Cambridge, MA) was added and allowed to incubate for 1 h at room temperature. After washing, TMB substrate (KPL Biomedical, Gaithersburg, MD) was added and the reaction was stopped by adding HCl, and the amount of HRP product was determined using a plate reader.
Antigenic map analysis.
Using a biophysical model of HAI, one may decompose any given measured HAI titer, denoted HXY, between virus X and antiserum raised against virus Y, into three basic components (14):
| (1) |
where AY denotes the concentration of Abs found in serum Y, KXY denotes the average affinity of those Abs for virus X, and JX is a factor to account for nonantigenic properties of virus X that influence the HAI titer. The primary such nonantigenic factor, provided the assay has controlled the concentration of red blood cells and virus, is the avidity of the virus for red blood cells.
Most existing antigenic maps of viral strains do not control for viral receptor binding avidity, either implicitly or explicitly. Such maps are constructed based on the standard antigenic distance between virus X and virus Y after normalizing HXY by the homologous titer, HYY (16, 17):
| (2) |
An alternative normalization used in the original studies of Smith et al. is the maximum titer raised against antiserum Y in a panel of trial strains (15). Both of these approaches have the virtue of controlling for the concentrations of Abs in serum Y, which would confound estimates of antigenic differences between X and Y. However, according to equation 1, this commonly used metric does not control for variation in viral receptor binding avidities, because
| (3) |
depends on the difference in viral receptor binding avidity between virus X and virus Y (namely, the JY/JX ratio).
To control for receptor binding avidity variation between viral strains without measuring viral receptor binding avidity directly, we used the Archetti-Horsfall antigenic distance metric, which requires homologous and heterologous HAI titers for viruses X and Y and the following equation (12, 18):
| (4) |
This measure is approximately independent of the viral receptor binding avidities of viruses X and Y (equation 4). We used this simple mathematical fact to estimate antigenic distances among the large number of strains that have already been subjected to HAI assays, controlling for avidity variation.
For the purpose of comparing results from the above-described antigenic distance metrics (d from equation 2 and dAH from equation 4), antigenic maps were generated using the subset of antigens from Smith et al. (15), for which both HXY and HYX are known (Fig. 1). In the case of the standard antigenic map (Fig. 1A, utilizing d), the configuration of antigenic positions was taken from previous work (15). Further minimizing the cost function starting from this configuration did not affect the conclusions drawn from the map. The map controlling for variation in viral receptor binding avidity (Fig. 1B, utilizing dAH) was generated by minimizing (using the method of conjugate gradients) the map error function (15), where the target distance between each pair of antigens, X and Y, was defined using equation 4. To illustrate the robustness of the maps, we follow previous work by presenting the “rigidity confidence area” (15) for each individual antigen in the maps. Thus, for each antigen, all other antigens (and sera, in the case of Fig. 1A) were held fixed, and the sensitivity of the map error function to displacement of the target antigen was determined. The outline of each antigen's map location indicates an increase of 0.5 of the map error function. Colored contours illustrate the rate of error increase for each antigen, from black (zero error) to the base color of the antigenic cluster (0.5 error) at the periphery (Fig. 1).
Fig 1.
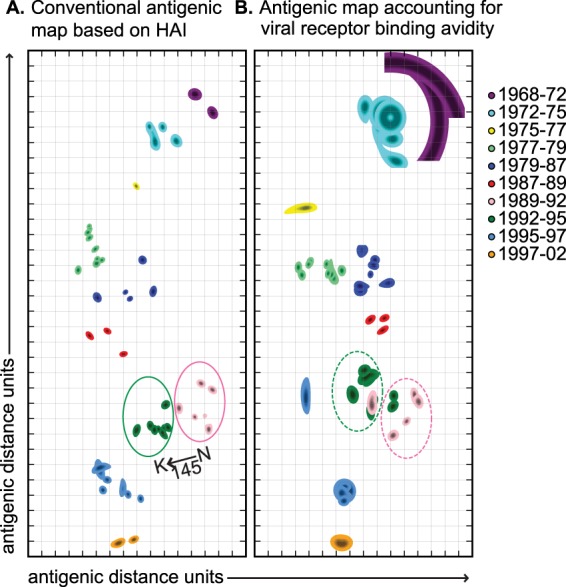
Conventional and receptor binding avidity-adjusted antigenic maps. (A) Conventional antigenic maps of H3N2 viruses circulating from 1968 to 2002 were created using HAI data from Smith et al. (15). Pink and green circles are drawn around the isolates belonging to the 1989-1992 and 1992-1995 clusters, respectively, as defined by Smith et al. (15). Variation in viral receptor binding avidity was accounted for by using the Archetti-Horsfall equation (see Materials and Methods). (B) New antigenic maps were created using the Smith et al. HAI data after adjusting for inferred receptor binding avidities. Pink and green circles are drawn around new (k-means) clusters for which the majority of isolates correspond to the Smith et al. 1989-1992 and 1992-1995 clusters, respectively. The x and y axes represent antigenic distance, and the spacing between grid lines corresponds to 2-fold dilutions of antisera in HAI assays. Rigidity confidence areas are shown for each cluster.
Figure 1 shows that although the traditional antigenic map (Fig. 1A) shares many similarities with the antigenic map controlling for viral receptor binding avidity (Fig. 1B), there are also notable qualitative differences. To formally quantify these differences, we followed the clustering analysis of Smith et al. (Fig. 1A) by identifying and comparing the antigenic clusters in the map of Fig. 1B using k-means clustering with k = 10 (15). For an objective analysis, the strains that were placed into antigenic clusters manually in the previous work of Smith et al. (BI/628/76, BI/2271/76, TE/1/77, VI/7/87, OK/5/88, and VI/1/88) were excluded from our analysis. Of particular interest, our comparison identified key members of the 1989-1992 and 1992-1995 clusters that, when viral receptor binding avidity is accounted for, are formally reclassified. Specifically, when accounting for viral receptor binding avidity (Fig. 1B), the 1989-1992 cluster gains two members (FI/338/95 and GE/A9509/95) from the 1992-1995 cluster, and the 1992-1995 cluster gains one member (NL/18/94) from the 1989-1992 cluster. These changes in clustering were robust with respect to the confidence areas around the antigenic positions on the map.
RESULTS
Generation of antigenic maps that account for changes in viral receptor binding avidity.
Classical antigenic maps are constructed by finding a two-dimensional embedding of viral isolates and antisera that respects the antigenic distances among them as determined from HAI measurements. To address whether variation in viral receptor binding avidities can affect antigenic cluster transitions, we used the Archetti-Horsfall antigenic distance metric (12, 18) to computationally account for variation in viral receptor binding avidities of the viruses used in the Smith et al. study (15). This metric requires both homologous and heterologous titers for all isolates being compared (see Materials and Methods), and it provides a computational correction for variation in receptor binding avidities. Upon generating a new antigenic map using the Archetti-Horsfall metric (Fig. 1), we observed that a previously identified antigenic cluster that was triggered in the 1992-1995 period by the single N145K HA mutation splits into two, such that some isolates previously identified in one cluster move to the other cluster and vice versa. This qualitative observation was verified in a formal k-means clustering analysis (see Materials and Methods). The interdigitation of strains previously characterized as antigenically distinct suggests that variation in viral receptor binding avidity, as opposed to genuine antigenic change, influenced these antigenic groupings in the original map by Smith et al. (15). Although the most dramatic differences between the two different types of map involved the 1992-1995 clusters, there were other notable differences in the receptor binding avidity-adjusted antigenic map (Fig. 1A and B). For example, the 1987-1989, 1979-1987, and 1997-2002 clusters became more compact, and the 1995-1997 cluster became more dispersed after adjusting for variation in viral receptor binding avidities. Some antigenic clusters (such as the 1968-1972 cluster) contained relatively limited amounts of data, which introduced large confidence regions in their two-dimensional embeddings. These data strongly support the hypothesis that antigenic positioning of viral isolates is influenced, at least in part, by changes in viral receptor binding avidity.
N145K HA mutation increases receptor binding avidity of H3N2 strains.
We experimentally focused on the N145K HA mutation that is associated with an antigenic cluster transition between 1992 and 1995 in conventional antigenic maps. Amino acid position 145 is located in antigenic site A of H3, adjacent to the sialic acid binding domain (Fig. 2). The N145K HA mutation is not predicted to result in a loss of a glycosylation site. To address if HA amino acid position 145 alters receptor binding avidity, we used reverse genetics to introduce an N145K mutation into the HA of A/New York/774/93 and a K145N mutation into the HA of A/Nanchang/933/95. On both genetic backgrounds, viruses possessing K145 HA bound to red blood cells more avidly than viruses containing N145 HA (Fig. 3). The A/New York/774/93 virus possessing K145 HA bound to red blood cells treated with 16-fold higher RDE concentrations than the same virus possessing N145 HA, and the A/Nanchang/933/95 virus possessing K145 HA bound to red blood cells treated with 4-fold higher RDE concentrations than the same virus possessing N145 HA (Fig. 3).
Fig 2.

Location of HA mutations associated with the 1992-1995 antigenic cluster transition. Amino acids 145 (gold) and 226 (purple) are highlighted on the X-31 H3 structure (Protein Data Bank entry 1HGG). The glycan receptor is shown in black.
Fig 3.
N145K HA mutation increases receptor binding avidity of H3N2 viruses. Viruses expressing A/New York/774/93 (A) or A/Nanchang/933/95 (B) HA with either asparagine (N) or lysine (K) at amino acid 145 were generated by reverse genetics. A secondary I226V HA mutation was also introduced into A/Nanchang/933/95 viruses that possessed K145 (B). Relative viral receptor binding avidities were determined by hemagglutination of red blood cells pretreated with increasing amounts of neuraminidase (RDE). Data are expressed as the maximal amount of neuraminidase that allowed full agglutination. Means and standard errors of the means from triplicate samples are shown. The data are representative of three independent experiments.
N145K HA mutation does not physically prevent antibody binding.
HAI titers are dependent on interactions between antibodies and virus and interactions between virus and receptors on red blood cell surfaces. Therefore, HAI titers can be decreased by HA mutations that reduce antibody binding to virus and/or increase virus binding to red blood cells (5–7, 9). Consistent with data generated by Smith et al. (15), virus possessing K145 HA escaped ferret antisera generated against virus possessing N145 HA 2-fold in HAI assays (Table 1). To differentiate how the N145K HA mutation promotes viral escape in HAI assays, we introduced a secondary I226V HA mutation which has previously been shown to influence receptor binding properties (19–21). Introduction of the I226V HA mutation decreased receptor binding avidity of A/Nanchang/933/95 virus possessing K145 HA (Fig. 3B). We used this double mutant virus to determine if the N145K mutation promotes HAI escape through increasing receptor binding avidity or through significant antigenic change. If the N145K HA mutation causes a significant antigenic change, the double mutant virus would be expected to escape sera in HAI assays despite having lower receptor binding avidity. However, A/Nanchang/933/1995 possessing both K145 and the I226V HA mutation failed to escape ferret antisera generated against virus possessing N145 HA in HAI assays (Table 1).
Table 1.
HAI titers using A/Nanchang/933/95 variants
| A/Nanchang/933/95 variant | Receptor binding avidityb | HAI titersa using ferret antisera againstanti-A/Nanchang/933/95 variant: |
|
|---|---|---|---|
| N145 | K145 | ||
| N145 | + | 640 | 320 |
| K145 | +++ | 320 | 1,920 |
| K145 plus I226V | + | 640 | 2,560 |
HAI assays were performed using turkey RBCs. HAI titers are expressed as the inverse of the highest serum dilution that inhibited hemagglutination. Data are representative of 4 independent experiments. Boldface indicates homologous titers.
Receptor avidity values are shown in Fig. 3.
Direct antibody binding ELISAs confirmed that N145K does not result in a significant antigenic change; sera generated against a virus possessing N145 HA bound similarly to viruses possessing either N145 or K145 HA (Fig. 4A). As expected based on the buried location of amino acid 226 (Fig. 2), sera generated against a virus possessing N145 HA also bound efficiently to a virus possessing both the N145K and I226V mutations (Fig. 4A). Taken together, these data indicate that the N145K mutation promotes HAI escape by increasing viral receptor binding avidity and not by preventing antibody binding.
Fig 4.
N145K HA mutation leads to an asymmetric antigenic change. Direct antibody binding to different viruses was determined by ELISA using sera isolated from ferrets infected with A/Nanchang/933/95 possessing N145 HA (A) or K145 (B). Means and SEM from triplicate samples are shown. The data are representative of three independent experiments. O.D., optical density.
N145K HA mutation causes an asymmetric antigenic change.
We anticipated that viruses possessing the N145K HA mutation would escape homologous antisera (sera generated against viruses possessing K145), since the N145K mutation promotes escape of heterologous antisera (sera generated against viruses possessing N145) by increasing receptor binding avidity. However, despite having lower receptor binding avidity (Fig. 3B), viruses possessing N145 HA escaped antisera generated against virus possessing K145 HA in HAI assays (Table 1). Viruses possessing both K145 and V226 HA actually had slightly higher HAI titers than viruses possessing only K145 HA (Table 1), consistent with the observation that the I226V HA mutation decreases receptor binding avidity (Fig. 3B). Direct antibody binding ELISAs confirmed that antisera generated against viruses possessing K145 HA binds poorly to viruses possessing N145 HA (Fig. 4B).
Collectively, these data suggest that the N145K HA mutation leads to an asymmetric antigenic change. Antibody responses generated against viruses possessing N145 HA are directed against regions other than amino acid 145, and viruses possessing the N145K HA mutation escape these antibodies by binding to cells with a greater avidity. Conversely, a large portion of antibodies generated against viruses possessing K145 HA are directed against an epitope involving amino acid 145, and viruses possessing N145 HA escape these antibodies by physically altering this epitope.
DISCUSSION
The choice of seasonal vaccine composition is naturally a complicated decision involving many factors, scientific and practical alike; e.g., the ability of strains to grow in eggs, the production readiness of various vaccine manufacturers, and recent epidemiological data on spatial spread. This decision is heavily influenced by antigenicity studies using HAI assays. Recent advances in antigenic cartography (15, 22, 23) have greatly improved our interpretation of HAI data. However, even though the outcome of the HAI assay for a given viral isolate and serum clearly depends on a dynamic competition of virus-antibody interactions with virus-cell interactions, there is a tendency to tacitly assume that standard notions of antigenic distance relate solely to virus-antibody binding affinity (24–26). Variation in viral receptor binding avidity has not been taken into account when creating antigenic maps, and the WHO does not systematically account for virus-red blood cell receptor binding avidities when interpreting HAI data and making vaccine strain recommendations.
It has been commonly thought that influenza viruses escape antibody responses primarily by acquiring mutations that physically abrogate antibody binding. Indeed, when grown in the presence of a single anti-HA monoclonal antibody in ovo, influenza viruses readily acquire a single HA mutation that physically prevents binding of the selecting monoclonal antibody (27). However, recent mechanistic studies suggest that antigenic drift of influenza viruses is heavily dependent on mutations that alter both antigenicity and receptor binding avidity (6). In these studies, single HA mutations that increase receptor binding avidity quickly emerged when virus was passaged in vivo in vaccinated mice. Therefore, influenza neutralization efficiency is dependent on antibody binding affinity to HA and HA binding avidity to cellular receptors. Since receptor-altering mutations are located on exposed regions of HA, many of these mutations simultaneously alter antigenic sites (6).
It is important to note that these previous receptor binding avidity studies were completed in a mouse model (6). It is unknown how changes in receptor binding avidity affect antigenic drift of human influenza viruses, but it is very interesting that H3N2 viruses possessing the N145K HA mutation (which increases receptor binding avidity) accumulated the secondary I226V HA mutation (which decreases receptor binding avidity) before widely circulating in the state of New York (28, 29). High-avidity viruses can escape antibodies by efficiently entering cells; however, there is a fitness cost associated with increased avidity. This fitness cost is likely due to imbalances between viral entry and viral release, since high-avidity virions are not efficiently released from cells at later stages of the viral life cycle. Consistent with this, high-avidity viruses quickly accumulate secondary mutations that decrease receptor binding avidity when passaged in naive mice (6). Computational studies have recently identified pairs of epistatic HA mutations (30), and it remains to be determined if these mutations alter receptor binding avidity.
Asymmetric HAI assays have been reported (5, 31), but to our knowledge, our study is the first to document that a single HA mutation can substantially change the immunodominance of anti-influenza antibody responses. The addition of the positively charged lysine at amino acid 145 might dramatically change the structure of antigenic site A of H3. It is unusual that position 145 has alternated between asparagine and lysine four times since 1975. We speculate that viruses possessing K145 HA have only appeared transiently in the human population due to heightened immunodominance of antigenic site A in these viruses.
Regardless of the mechanism(s) that promotes antigenic drift of influenza viruses, it is clear that there is variation in receptor binding avidity among influenza strains (5–11). Therefore, we believe that it is imperative to consider receptor binding avidity measurements when constructing and interpreting antigenic maps based on HAI data. Our new antigenic maps that account for variation in viral receptor binding avidities strongly support the hypothesis that antigenic clustering is influenced by changes in receptor binding avidity, and we have used experimental approaches to validate that the 1992-1995 cluster transition is impacted by a single amino acid substitution that alters receptor binding avidity.
ACKNOWLEDGMENTS
S.E.H. is supported by the NIH (NIAID K22AI091651), the Wistar Institute Cancer Center Core grant, the Pennsylvania CURE funds, and a University of Pennsylvania Institute for Translational Medicine and Therapeutics grant. J.B.P. and D.L.B. are supported by the Burroughs Wellcome Fund, the David and Lucile Packard Foundation, the James S. McDonnell Foundation, the Alfred P. Sloan Foundation, grant D12AP00025 from the U.S. Department of the Interior, grant W911NF-12-1-0552 from the U.S. Army Research Office, grant RFP-12-16 from the Foundational Questions in Evolutionary Biology Fund, and a University of Pennsylvania Institute for Translational Medicine and Therapeutics grant. Y.L. and D.L.B. are supported by the NIH T32A1055400 training grant.
Footnotes
Published ahead of print 3 July 2013
REFERENCES
- 1.Anonymous 2010. Estimates of deaths associated with seasonal influenza–United States, 1976–2007. MMWR Morb. Mortal. Wkly. Rep. 59:1057–1062 [PubMed] [Google Scholar]
- 2.Anonymous 2004. Update: influenza activity–United States, 2003-04 season. MMWR Morb. Mortal. Wkly. Rep. 53:284–287 [PubMed] [Google Scholar]
- 3.Barr IG, McCauley J, Cox N, Daniels R, Engelhardt OG, Fukuda K, Grohmann G, Hay A, Kelso A, Klimov A, Odagiri T, Smith D, Russell C, Tashiro M, Webby R, Wood J, Ye Z, Zhang W. 2010. Epidemiological, antigenic and genetic characteristics of seasonal influenza A(H1N1), A(H3N2) and B influenza viruses: basis for the WHO recommendation on the composition of influenza vaccines for use in the 2009–2010 northern hemisphere season. Vaccine 28:1156–1167 [DOI] [PubMed] [Google Scholar]
- 4.Hirst GK. 1942. The quantitative determination of influenza virus and antibodies by means of red cell agglutination. J. Exp. Med. 75:49–64 [DOI] [PMC free article] [PubMed] [Google Scholar]
- 5.Fazekas de St Groth S, Donnelley M. 1950. Studies in experimental immunology of influenza. III. The antibody response. Aust. J. Exp. Biol. Med. Sci. 28:45–60 [DOI] [PubMed] [Google Scholar]
- 6.Hensley SE, Das SR, Bailey AL, Schmidt LM, Hickman HD, Jayaraman A, Viswanathan K, Raman R, Sasisekharan R, Bennink JR, Yewdell JW. 2009. Hemagglutinin receptor binding avidity drives influenza A virus antigenic drift. Science 326:734–736 [DOI] [PMC free article] [PubMed] [Google Scholar]
- 7.Yewdell JW, Caton AJ, Gerhard W. 1986. Selection of influenza A virus adsorptive mutants by growth in the presence of a mixture of monoclonal antihemagglutinin antibodies. J. Virol. 57:623–628 [DOI] [PMC free article] [PubMed] [Google Scholar]
- 8.Nicholls JM, Chan RW, Russell RJ, Air GM, Peiris JS. 2008. Evolving complexities of influenza virus and its receptors. Trends Microbiol. 16:149–157 [DOI] [PubMed] [Google Scholar]
- 9.Underwood PA, Skehel JJ, Wiley DC. 1987. Receptor-binding characteristics of monoclonal antibody-selected antigenic variants of influenza virus. J. Virol. 61:206–208 [DOI] [PMC free article] [PubMed] [Google Scholar]
- 10.Wang W, Lu B, Zhou H, Suguitan AL, Jr, Cheng X, Subbarao K, Kemble G, Jin H. 2010. Glycosylation at 158N of the hemagglutinin protein and receptor binding specificity synergistically affect the antigenicity and immunogenicity of a live attenuated H5N1 A/Vietnam/1203/2004 vaccine virus in ferrets. J. Virol. 84:6570–6577 [DOI] [PMC free article] [PubMed] [Google Scholar]
- 11.Xu Q, Wang W, Cheng X, Zengel J, Jin H. 2010. Influenza H1N1 A/Solomon Island/3/06 virus receptor binding specificity correlates with virus pathogenicity, antigenicity, and immunogenicity in ferrets. J. Virol. 84:4936–4945 [DOI] [PMC free article] [PubMed] [Google Scholar]
- 12.Archetti I, Horsfall FL., Jr 1950. Persistent antigenic variation of influenza A viruses after incomplete neutralization in ovo with heterologous immune serum. J. Exp. Med. 92:441–462 [DOI] [PMC free article] [PubMed] [Google Scholar]
- 13.Hirst GK. 1943. Studies of antigenic differences among strains of influenza a by means of red cell agglutination. J. Exp. Med. 78:407–423 [DOI] [PMC free article] [PubMed] [Google Scholar]
- 14.Ndifon W. 2011. New methods for analyzing serological data with applications to influenza surveillance. Influenza Other Resp. Viruses 5:206–212 [DOI] [PMC free article] [PubMed] [Google Scholar]
- 15.Smith DJ, Lapedes AS, de Jong JC, Bestebroer TM, Rimmelzwaan GF, Osterhaus AD, Fouchier RA. 2004. Mapping the antigenic and genetic evolution of influenza virus. Science 305:371–376 [DOI] [PubMed] [Google Scholar]
- 16.Layne SP. 2006. Human influenza surveillance: the demand to expand. Emerg. Infect. Dis. 12:562–568 [DOI] [PMC free article] [PubMed] [Google Scholar]
- 17.WHO 2011. Manual for the laboratory diagnosis and virological surveillance of influenza. WHO, Geneva, Switzerland [Google Scholar]
- 18.Ndifon W, Dushoff J, Levin SA. 2009. On the use of hemagglutination-inhibition for influenza surveillance: surveillance data are predictive of influenza vaccine effectiveness. Vaccine 27:2447–2452 [DOI] [PubMed] [Google Scholar]
- 19.Chen Z, Zhou H, Jin H. 2010. The impact of key amino acid substitutions in the hemagglutinin of influenza A (H3N2) viruses on vaccine production and antibody response. Vaccine 28:4079–4085 [DOI] [PubMed] [Google Scholar]
- 20.Rogers GN, Paulson JC, Daniels RS, Skehel JJ, Wilson IA, Wiley DC. 1983. Single amino acid substitutions in influenza haemagglutinin change receptor binding specificity. Nature 304:76–78 [DOI] [PubMed] [Google Scholar]
- 21.Vines A, Wells K, Matrosovich M, Castrucci MR, Ito T, Kawaoka Y. 1998. The role of influenza A virus hemagglutinin residues 226 and 228 in receptor specificity and host range restriction. J. Virol. 72:7626–7631 [DOI] [PMC free article] [PubMed] [Google Scholar]
- 22.Cai Z, Zhang T, Wan XF. 2012. Antigenic distance measurements for seasonal influenza vaccine selection. Vaccine 30:448–453 [DOI] [PMC free article] [PubMed] [Google Scholar]
- 23.Cai Z, Zhang T, Wan XF. 2010. A computational framework for influenza antigenic cartography. PLoS Comput. Biol. 6:e1000949. 10.1371/journal.pcbi.1000949 [DOI] [PMC free article] [PubMed] [Google Scholar]
- 24.Lapedes A, Farber R. 2001. The geometry of shape space: application to influenza. J. Theor. Biol. 212:57–69 [DOI] [PubMed] [Google Scholar]
- 25.Smith DJ, Lapedes AS, Forrest S, de Jong JC, Osterhaus ADME, Fouchier RAM, Cox NJ, Perelson AS. 2001. Modeling the effects of updating the influenza vaccine on the efficacy of repeated vaccination. Int. Congr. Ser. 1219:655–660 [Google Scholar]
- 26.Wu JT, Wein LM, Perelson AS. 2005. Optimization of influenza vaccine selection. Operations Res. 53:456–476 [Google Scholar]
- 27.Caton AJ, Brownlee GG, Yewdell JW, Gerhard W. 1982. The antigenic structure of the influenza virus A/PR/8/34 hemagglutinin (H1 subtype). Cell 31:417–427 [DOI] [PubMed] [Google Scholar]
- 28.Ghedin E, Sengamalay NA, Shumway M, Zaborsky J, Feldblyum T, Subbu V, Spiro DJ, Sitz J, Koo H, Bolotov P, Dernovoy D, Tatusova T, Bao Y, St George K, Taylor J, Lipman DJ, Fraser CM, Taubenberger JK, Salzberg SL. 2005. Large-scale sequencing of human influenza reveals the dynamic nature of viral genome evolution. Nature 437:1162–1166 [DOI] [PubMed] [Google Scholar]
- 29.Holmes EC, Ghedin E, Miller N, Taylor J, Bao Y, St George K, Grenfell BT, Salzberg SL, Fraser CM, Lipman DJ, Taubenberger JK. 2005. Whole-genome analysis of human influenza A virus reveals multiple persistent lineages and reassortment among recent H3N2 viruses. PLoS Biol. 3:e300. 10.1371/journal.pbio.0030300 [DOI] [PMC free article] [PubMed] [Google Scholar]
- 30.Kryazhimskiy S, Dushoff J, Bazykin GA, Plotkin JB. 2011. Prevalence of epistasis in the evolution of influenza a surface proteins. PLoS Genet. 7:e1001301. 10.1371/journal.pgen.1001301 [DOI] [PMC free article] [PubMed] [Google Scholar]
- 31.Underwood PA. 1980. Serology and energetics of cross-reactions among the H3 antigens of influenza viruses. Infect. Immun. 27:397–404 [DOI] [PMC free article] [PubMed] [Google Scholar]