

Abstract
The Shiga toxin-producing Escherichia coli (STEC) strains, including those of O157:H7 and the “big six” serogroups (i.e., serogroups O26, O45, O103, O111, O121, and O145), are a group of pathogens designated food adulterants in the United States. The relatively conserved nature of clustered regularly interspaced short palindromic repeats (CRISPRs) in phylogenetically related E. coli strains makes them potential subtyping markers for STEC detection, and a quantitative PCR (qPCR)-based assay was previously developed for O26:H11, O45:H2, O103:H2, O111:H8, O121:H19, O145:H28, and O157:H7 isolates. To better evaluate the sensitivity and specificity of this qPCR method, the CRISPR loci of 252 O157 and big-six STEC isolates were sequenced and analyzed along with 563 CRISPR1 and 624 CRISPR2 sequences available in GenBank. General conservation of spacer content and order was observed within each O157 and big-six serogroup, validating the qPCR method. Meanwhile, it was found that spacer deletion, the presence of an insertion sequence, and distinct alleles within a serogroup are sources of false-negative reactions. Conservation of CRISPR arrays among isolates expressing the same flagellar antigen, specifically, H7, H2, and H11, suggested that these isolates share an ancestor and provided an explanation for the false positives previously observed in the qPCR results. An analysis of spacer distribution across E. coli strains provided limited evidence for temporal spacer acquisition. Conversely, comparison of CRISPR sequences between strains along the stepwise evolution of O157:H7 from its O55:H7 ancestor revealed that, over this ∼7,000-year span, spacer deletion was the primary force generating CRISPR diversity.
INTRODUCTION
Shiga toxin-producing Escherichia coli (STEC) strains are a group of pathogenic E. coli strains transmitted to humans through food, water, and animals (1). The diseases caused by STEC strains vary in severity and include mild diarrhea, bloody diarrhea (hemorrhagic colitis [HC]), and hemolytic uremic syndrome (HUS) (2). STEC infections are nationally notifiable infectious diseases that are estimated to cause ∼265,000 illnesses, with consequences including more than 3,600 hospitalizations and 30 deaths per year in the United States (3). Raw beef products are considered the main source of human STEC infections (4). Although more than 200 serotypes of STEC have been identified, not all of them are equally pathogenic (5). One of the most well-known and studied STEC strains is E. coli O157:H7. This serotype evolved from an O55:H7 ancestor, and a stepwise evolutionary model was proposed and updated in several studies (6–10). The non-O157 STEC strains, on the other hand, are underreported due to limitations in laboratory isolation and detection methods. For example, the β-glucuronidase (GUD)-negative and sorbitol (SOR)-negative phenotypes common to E. coli O157:H7 are used for distinguishing this serotype from other E. coli isolates, while most non-O157 STEC isolates and other E. coli isolates are GUD positive (GUD+) and SOR+. Among the non-O157 isolates, O26:H11 or NM, O45:H2 or NM, O103:H2, H11, H25, or NM, O111:H8 or NM, O121:H19 or H7, and O145:NM are the most frequently isolated serotypes in United States (11). These 6 serogroups (i.e., O26, O45, O103, O111, O121, and O145) accounted for 71% of STEC isolates recovered from 1983 to 2002 in the United States and are therefore referred to as the “big six.” The increasing number of cases of disease caused by these organisms in the United States has driven recent policy changes declaring them adulterants in beef products.
Clustered regularly interspaced short palindromic repeats (CRISPRs), along with the CRISPR-associated (cas) genes, serve as an adaptive immune system against foreign nucleic acids in prokaryotes (12, 13). About 50% of sequenced bacteria and 85% of sequenced archaea have CRISPR arrays in their genomes (14). The CRISPR arrays consist of partially palindromic direct DNA repeats separated by spacers, which is the term used for the unique DNA sequences between repeats that are derived from foreign nucleic acids (15). Often adjacent to the CRISPR arrays are cas genes, which encode the proteins for CRISPR functionality (16, 17). Two CRISPR loci with associated cas genes (CRISPR-Cas) have been identified in E. coli strains (18, 19). These systems are classified as type I-E and type I-F (17). In proximity to each CRISPR-Cas system are one or two additional CRISPR loci that lack associated cas genes. In general, only 1 CRISPR-Cas system is observed in each strain, and type I-E is the predominant subtype (18, 19). The hypervariable nature of CRISPR loci makes them attractive subtyping markers for both evolutionary studies and epidemiological investigations (20). CRISPRs were first used for this purpose in a method for differentiating Mycobacterium tuberculosis called spoligotyping (21). Subsequently, CRISPR-based subtyping methods have been applied to multiple species (22–34). The subtyping resolution of a given CRISPR locus largely depends on its rate of spacer acquisition; active CRISPR loci could be used to differentiate strains within a clonal population for the purpose of epidemiological investigation, such as outbreak tracking (28, 35, 36), while the CRISPR loci that are less active may be used as markers for clonal population detection. The E. coli CRISPR loci fall into the latter category (18, 19, 37), and Delannoy et al. (38, 39) recently leveraged this to develop CRISPR-based quantitative PCR (qPCR) protocols for the detection of O104:H4, O26:H11, O45:H2, O103:H2, O111:H8, O121:H19, O145:H28, and O157:H7 STEC isolates that were 95.7% to 100% sensitive and 97.5% to 100% specific (38, 39). Previous observations with E. coli (37) and related organisms, such as Salmonella enterica (18, 33, 34, 40), suggest that CRISPR loci within phylogenetically related isolates diversify primarily through spacer deletion. We hypothesized that such events are the reason behind the small number of false negatives observed in the previous study (38).
In this study, the CRISPR1 and CRISPR2 loci from 252 STEC isolates were sequenced. In addition, 563 CRISPR1 and 624 CRISPR2 loci in GenBank were analyzed. Our objectives were 3-fold: (i) to more completely understand CRISPR diversity within clinically relevant STEC serogroups, (ii) to understand the reason(s) for the false-negative and false-positive reactions observed by Delannoy et al. (38), and (iii) to gain insights into the temporal evolution of CRISPRs in E. coli, using the stepwise progression from O55:H7 to O157:H7 strains as a model.
MATERIALS AND METHODS
Bacterial isolates.
The 252 STEC strains sequenced in this study were obtained from the Pennsylvania Department of Health, the E. coli Reference Center at the Pennsylvania State University, the STEC Center at Michigan State University, Andrew Benson from the Food Science and Technology Department at University of Nebraska, Robert Mandrell from the Produce Safety and Microbiology Research Unit at the United States Department of Agriculture, and Peter Feng from the Center for Food Safety and Nutrition at the Food and Drug Administration (Table 1). The bacterial isolates were stored at −80°C in 10% glycerol. When needed, isolates were grown in lysogeny broth (LB) overnight at 37°C.
Table 1.
O types, sources, and culture collections of the 252 Shiga toxin-producing E. coli isolates analyzed in the present study
| O type | Source | No. of isolates | Culture collection |
|---|---|---|---|
| 157 | Human | 25 | PA Department of Health,a STEC Center at MSUb |
| 157 | Cattle | 1 | Andrew Bensonc |
| 157 | Other | 1 | Peter Fengd |
| 26 | Human | 19 | PA Department of Health |
| 26 | Cattle | 20 | Chitrita DebRoye |
| 26 | Other | 3 | Chitrita DebRoy |
| 103 | Human | 20 | PA Department of Health |
| 103 | Cattle | 18 | Chitrita DebRoy |
| 103 | Other | 8 | Chitrita DebRoy, Robert Mandrellf |
| 111 | Human | 20 | PA Department of Health, Robert Mandrell |
| 111 | Cattle | 20 | Chitrita DebRoy, Robert Mandrell |
| 111 | Other | 3 | Chitrita DebRoy, Robert Mandrell |
| 45 | Human | 20 | PA Department of Health, Robert Mandrell |
| 45 | Cattle | 1 | Robert Mandrell |
| 121 | Human | 13 | PA Department of Health |
| 121 | Cattle | 1 | Robert Mandrell |
| 121 | Other | 3 | Chitrita DebRoy, Robert Mandrell |
| 145 | Human | 9 | PA Department of Health |
| 145 | Cattle | 4 | Chitrita DebRoy, Robert Mandrell |
| Other | Human, cattle, other | 43 | Chitrita DebRoy |
PA Department of Health, Bureau of Laboratories, The Pennsylvania Department of Health, Exton, PA.
STEC Center, reference center to facilitate the study of Shiga toxin-producing Escherichia coli, Michigan State University, East Lansing, MI.
Andrew Benson, Food Science and Technology Department, University of Nebraska, Lincoln, NE.
Peter Feng, Center for Food Safety and Nutrition, Food and Drug Administration, College Park, MD.
Chitrita DebRoy, E. coli Reference Center, The Pennsylvania State University, University Park, PA.
Robert Mandrell, Produce Safety and Microbiology Research Unit, WRRC, ARS, USDA, Albany, CA.
PCRs.
The PCR primers and cycling conditions for amplifying the CRISPR loci were adapted from the method of Díez-Villaseñor et al. (see Table S1 in the supplemental material) (19). The C1R1 primer was designed to obtain better sequencing results at the terminal end of CRISPR1. CRISPR2a and -2b arrays were sequenced separately to avoid sequencing the unnecessary 0.5-kb AT-rich region between the arrays (Fig. 1). When only CRISPR2a was present, primers C2aF1 and C2bR1 were used. PCRs were set up as follows: 0.5 μl of overnight bacterial culture, 0.1 μl Taq (1 unit; New England BioLabs, Ipswich, MA), 0.2 μl 10 mM deoxynucleoside triphosphates (dNTPs), 1 μl 10 mM forward and reverse primers, 2.5 μl 10× Taq buffer, and 19.7 μl water to make a total volume of 25 μl.
Fig 1.
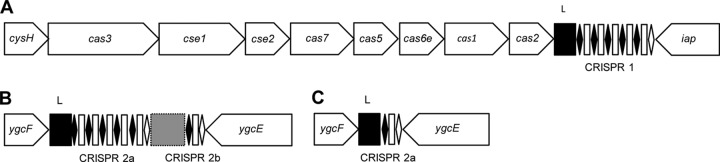
Schematic view of CRISPR1 (A), CRISPR2 with insert (B), and CRISPR2 (C) without insert in E. coli. Black diamonds and white rectangles represent direct repeats and spacers, respectively. Terminal repeats are represented by white diamonds. Black squares marked with “L” represent leader sequences. The gray rectangle represents the 0.5-kb AT-rich sequence between CRISPR2a and -2b arrays. All schematics are not drawn to scale.
Sequencing reactions.
The PCR products were digested with 1 unit of either shrimp alkaline phosphatase (USB Corp., Cleveland, OH) or Antarctic alkaline phosphatase (New England BioLabs) and 10 units of exonuclease (USB Corp.) for 45 min at 37°C, followed by 85°C for 15 min to inactivate the enzymes. Sequencing reactions were performed by either the Genomics Core Facility at The Pennsylvania State University or Genewiz (South Plainfield, NJ). All loci were sequenced in both the forward and reverse directions. For certain isolates that have larger CRISPR arrays, internal primers were designed to ensure sequencing of the complete locus (see Table S1 in the supplemental material).
Sequence analysis.
Sequences were assembled and aligned using SeqMan (Lasergene 10; DNAStar, Madison, WI). An R script developed in-house (available upon request) was used to analyze the CRISPR sequences. Briefly, the script first checks the completeness of the CRISPR locus by identifying the conserved sequences that are upstream and downstream from the first and last repeat, respectively. Next, it extracts the repeats and spacers and assigns letter and number designations to unique repeats and spacers, respectively. CRISPR arrays were represented by codes with alternating letters (repeat) and numbers (spacer). An allele number was then assigned for each unique spacer combination within a CRISPR locus. The CRISPR1 and CRISPR2 locus numbering systems were distinct. Each unique CRISPR1 and -2a combination was assigned a sequence type (ST) number. BLAST analyses for each unique spacer were performed against the nonredundant nucleotide database in GenBank.
Serotyping.
All isolates that had CRISPR sequences distinctly different from those of the majority of the isolates within the same serogroup were verified by serotyping at the E. coli Reference Center at the Pennsylvania State University.
Genome data analysis.
CRISPR sequences were extracted by BLAST using a combination of conserved repeat sequences and/or known leader and trailer sequences against the publicly available E. coli genome or whole-genome shotgun contigs (WGS) in GenBank (see Table S2 in the supplemental material). Once the existence of a CRISPR site was established, 4 kb of sequence was extracted (CRISPR site ± 2 kb) and spacer and repeat data were extracted.
Nucleotide sequences accession numbers.
The nucleotide sequences of CRISPR alleles identified in this study were submitted to GenBank with accession numbers KC765163 to KC765914.
RESULTS
Proposal for a new CRISPR nomenclature for E. coli.
Previous reports describing E. coli CRISPRs have used two different nomenclatures. Touchon et al. (18) identified four loci within a collection of E. coli strains and designated the CRISPR downstream of iap CRISPR1 and a second locus that was between ygcE and ygcF CRISPR2. Of note, these two loci are separated by approximately 20 kb and share common repeat sequences, while only CRISPR1 has associated cas genes (type I-E). A 0.5-kb highly conserved AT-rich sequence was noted by Touchon et al. (18) within the CRISPR2 locus of some strains. Díez-Villaseñor et al. (19) noted the same sequence and designated the two CRISPRs separately. They suggested the nomenclature CRISPR2.1 (instead of CRISPR1) and CRISPR 2.2 and 2.3 for the distinct spacer arrays when the 0.5-kb sequence was present or CRISPR2.2-3 when the insert was absent and only one CRISPR was observed between ygcE and ygcF. Here, we propose a nomenclature that combines the strengths of the designations of both Touchon et al. and Díez-Villaseñor et al., keeping CRISPR1 and CRISPR2 (Fig. 1) while using CRISPR2a when referring to the array present between ygcE and ygcF independent of the 0.5-kb AT-rich sequence and CRISPR2b for the ygcE-proximal array observed when this insert is present. This nomenclature is consistent with that used for Salmonella enterica (18, 29, 30), where CRISPR1 and CRISPR2 are accepted designations for the iap- and the ygcE-F-associated CRISPR, respectively.
While two other CRISPR loci have been described for E. coli, designated CRISPR3 and -4 by Touchon et al. (18) and CRISPR4.1 and -4.2 by Díez-Villaseñor et al. (or CRISPR4.1-2 when combined) (19), these do not appear to be as diverse as CRISPR1 and -2 (19, 37), and therefore, we did not investigate these loci here.
CRISPR diversity in O157:H7 and O157:H− STEC isolates.
To more comprehensively characterize the diversity of CRISPR sequences in serotype O157:H7 isolates, a collection of 24 isolates were selected, including those from all 9 previously defined clade types (41), and their CRISPR1 and -2 loci were sequenced (see Table S3 in the supplemental material). In addition, CRISPRs from 30 publicly available O157:H7 genomes were analyzed (see Table S2). In this article, we will refer to the combination of CRISPR1 and -2a alleles as a sequence type (ST). CRISPR2b arrays were not included since they were conserved among all isolates sequenced and genomes studied except for O145 isolates, which lacked spacers at this locus (see Table S4 in the supplemental material). Fifty-three of 54 strains had the same CRISPR1 and CRISPR2 alleles, which we defined as ST1 (Fig. 2). The one outlier was a strain previously designated PA48 (42) (ST2) that is phenotypically GUD+ SOR−. GUD+ E. coli O157:H7 strains are evolutionary predecessors to GUD− SOR− strains, which is the phenotype of the remaining 53 strains screened. Therefore, we suspected that additional GUD+ strains would also have CRISPR1 and -2 alleles that were different from those observed in GUD− strains.
Fig 2.

CRISPR1 and CRISPR2a alleles of O157 and big-six isolates. The source and CRISPR sequence type (ST) frequency of isolates are shown in the source column. “Other” designates isolates from sources other than human and cattle (e.g., water, food, rabbit). “Genome” indicates data from publicly available genome sequences where the isolation source was not available. The CRISPR STs that were only observed in genome sequences are indicated by italicized strain names. CRISPR ST designations are shown in the ST column. CRISPR1 and -2a alleles are shown in their respective columns, with the allele numbers to the right of the CRISPR arrays. Each unique spacer is represented by a unique color combination of the center shape and background. The shape in the center indicates the spacer length ( = 32 bp,
  = 33 bp, ⧫ = 30 bp, ■ = 31 bp). Gaps were introduced to improve the alignment of similar CRISPR arrays. “IS” represents an insertion sequence. Asterisks represent the breaking of one array into two rows. The dagger symbol indicates that the last spacer of CRISPR2a allele 2 is 1 base different from the last spacer of CRISPR2a allele 1.
To test this, the CRISPR1 and -2 loci of two O157:H− strains in our collection and the publically available genome sequence of one strain (see Table S2 in the supplemental material) were analyzed. All three O157:H− strains were defined as ST3 (Fig. 2). Notably, although different in sequence, the arrays of all O157 serogroup isolates shared spacers that were arranged in similar order. Given the similarity of the CRISPRs of O157:H7 and O157:H− strains, we next speculated that STEC isolates of serogroups associated with the big six would also be related to one another.
CRISPR diversity in big-six STEC human isolates.
To elucidate the CRISPR diversity within each big-six STEC serogroup, (O26, O45, O103, O111, O121, and O145), 101 human isolates (see Table S4 in the supplemental material) and 19 publicly available STEC genome sequences (see Table S2) were analyzed. For the 120 O26, O45, O103, O111, O121, and O145 human isolates and genome sequences analyzed, 10, 5, 10, 8, 3, and 6 STs were found, respectively (Fig. 2). Similar to the observation with O157 isolates, the STs observed within serogroups O26, O45, O111, and O121 shared common ancestral spacers and the spacer orders were conserved. Spacer deletion was the primary contributor of CRISPR1 and -2a allelic variants within these serogroups. In some instances, possible spacer acquisition on the leader end was observed (for example, for serogroup O103, compare CRISPR1 alleles 5 and 10). Distinct CRISPRs were also observed among isolates belonging to the same serogroup. As one example, 9 STs from human O103 isolates and genome sequences (ST31 to -37, -39, and -43) were related to each other, but these were distinct from ST44, which was different by 13 out of 14 and 3 out of 4 spacers in CRISPR1 and -2a, respectively. Similar observations were made with serogroup O145 isolates; 5 of the STs were similar (ST54, -55, -56, -58, and -59), while strain 4.0967 (ST60) had CRISPRs more similar to those observed in serogroup O103. Comparing between serogroups, the sequence types identified in O26 and O111 isolates were similar in terms of spacer content, with 9 out of 10 and 9 out of 13 spacers in CRISPR1 and -2a, respectively, being shared. Shared CRISPR alleles (i.e., CRISPR1 allele 11 and CRISPR2a allele 4) were observed between these two serogroups as well. For O45 and O103 isolates, 4 of 12 spacers in CRISPR1 and 7 of 8 spacers in CRISPR2a were shared.
CRISPR alleles in big-six STEC nonhuman isolates.
In other bacterial systems, such as that of Streptococcus thermophilus, CRISPRs evolve in response to foreign DNA, such as phages and plasmids (12). We hypothesized that STEC isolates from humans would carry different spacers within CRISPRs than would nonhuman isolates due to niche-specific differences in foreign DNA pools. To investigate this, CRISPR1 and CRISPR2 from 64 big-six cattle STEC isolates were sequenced (see Table S5 in the supplemental material). For the cattle STEC isolates, 6, 1, 5, 4, 1, and 3 STs were observed, and among these 3, 0, 2, 1, 1, and 2 STs were observed previously for human STEC isolates from serogroups O26, O45, O103, O111, O121, and O145, respectively (Fig. 2). The STs that were only associated with cattle had spacers and spacer arrangements similar to those of human STs in the same serogroup, except for ST30, which was observed in a single O45 cattle isolate.
Given the shared alleles between human and cattle STEC isolates within each serogroup, we next extended the investigation to big-six STEC isolates from other environmental sources. A total of 15 isolates (i.e., 3 O26, 6 O103, 3 O111, and 3 O121 isolates) from sources other than human and cattle (e.g., pig, bird, horse, and water) were obtained (see Table S6 in the supplemental material). Additionally, 2 O103 isolates of unknown source were included. For these O26, O103, O111, and O121 STEC isolates, 2, 7, 1, and 3 STs were found, respectively, and 2, 1, 1, and 1 STs were shared with human STEC STs, respectively (Fig. 2). Five STs from O103 isolates obtained from undefined environmental sources (ST32, -39, -40, -41, and -42) were similar or identical to STs observed from O103 human isolates. Two additional O103 isolates of ST47 and -48 had a spacer composition distinct from those previously identified. The 2 STs in O121 isolated from pigs (ST52 and -53) were distinct from the remaining STs in O121. Therefore, while the spacer composition and arrangement of CRISPR1 and -2a were mostly similar in isolates of a common serogroup, regardless of the isolation source, a few distinct alleles were observed.
In comparing the CRISPR1 and -2 loci in all the isolates analyzed, although an almost equal number of unique spacers were found at each locus, a universal ancestral spacer was seen in almost all CRISPR1 arrays but not in CRISPR2 arrays (Fig. 2). Also, for the 432 spacers identified in STEC isolates, only one single-nucleotide polymorphism (SNP) was observed between 2 spacers (CRISPR2 spacers 1 and 4; see Table S10 in the supplemental material).
In silico analysis of qPCR primers targeting CRISPR arrays.
With a larger picture of CRISPR array diversity before us, we wanted to determine if our data could provide insights into the small number of false-negative reactions observed by the previously described qPCR method (38). By overlaying the qPCR primers designed by Delannoy et al. (Fig. 3) onto typical CRISPR arrays observed in isolates of each big-six serogroup, we found that this method would detect the most commonly observed CRISPR STs of O121 (ST49), O45 (ST25), O103 (ST31), O145 (ST54), O26 (ST4), and O111 (ST17) strains, as well as most variants of these sequence types that differed by small spacer deletions. Notably, however, these primer sets would not detect O26 ST14, O45 ST27, O111 ST6, -18, -19, -21, -23, or -24, O121 ST51, the isolates with the more-divergent CRISPR alleles, such as O103 ST44, -45, or -46, or isolates from noncattle, nonhuman sources.
Fig 3.

Positions of O157 and big-six qPCR primers within CRISPR arrays. The positions of qPCR primers (blue arrows) and the TaqMan probe (red line, only shown for O111) designed by Delannoy et al. (38) are shown. Black diamonds and white diamonds represent direct and terminal repeats, respectively. Each unique spacer is represented by a unique color combination of the center shape and background. The shape in the center defines the spacer length ( = 32 bp, ■ = 31 bp). Primer pair names (i.e., O157A, O157B, O157C, O121, O45 and O103, O145, O26C, O26D, and O111) were adopted from Delannoy et al. (38). Of note, O157A, O157B, and O157C are three separate primer pairs used for detecting E. coli O157:H7, and O26C and O26D are two separate primer pairs for the detection of E. coli O26 STEC. The primer pair O45 and O103 targets spacers conserved in both serogroups.
CRISPR alleles in genome data and grouping by H-type clusters.
We also noted in the published qPCR protocol (38) that cross-reactivity was reported among strains with different O types but the same H type. Therefore, we hypothesized that isolates sharing only the H type would carry similar CRISPRs or share spacers, indicating a common origin. To test this hypothesis, the CRISPR1 and -2 sequences of 13 H7, 20 H2, and 25 H11 strains with different O types, obtained from publicly available genome sequences (see Table S2 in the supplemental material), were analyzed. Additionally, 2 GUD+ O157:H− strains were included. Strong conservation was observed within CRISPR1 and -2a loci within isolates of the same H type in terms of spacer content and arrangement (Fig. 4). We were also able to explain some of the false-positive reactions reported previously for the qPCR detection method. For example, primers designed to detect O45:H2 and O103:H2 (Fig. 3) target regions also found two of four O128:H2 isolates (Fig. 4). Additionally, primers for detecting O26:H11 (Fig. 3) annealed to regions found in a single O15:H11 and all five O111:H11 isolates screened (Fig. 4). Not all isolates expressing the same H type had conserved CRISPR sequences, however. One exception was an Stx1+ Stx2+ O128:H2 (ST81) strain, which had 10 distinct spacers at the leader-proximal end of both CRISPR1 and -2a. Additionally, strains DEC5A (ST72) and DEC5B (ST73) in the H7 group had 5 and 8 unique spacers, respectively, when compared to the rest of the H7 group.
Fig 4.

CRISPR1 and CRISPR2a alleles of E. coli H7, H2, and H11 strains. Strain name, O type, H type, and ST are shown in their respective columns. stx1A and stx2A types are indicated if the information was available. CRISPR1 and -2a alleles are presented in their respective columns, with the allele numbers to the right. Each unique spacer is represented by a unique color combination of the center shape and background. The shape in the center indicates the spacer length ( = 32 bp, = 33 bp, ⧫ = 30 bp,  = 28 bp,
  = 26 bp). “IS” represents an insertion sequence.
Model of evolution of O157:H7 from O55:H7.
The stepwise evolution of GUD− SOR− O157:H7 strains from an O55:H7 ancestor has been described in great detail (6–10). At least one genome sequence from each proposed evolutionary node (except for 9.1a and 9.2e) is available, permitting for the first time the ordered reconstruction of CRISPR dynamics in E. coli over a several-thousand-year span (10). CRISPR1 and, when available, CRISPR2a sequences were assembled using WGS reads from 12 strains comprising 10 nodes from the common ancestor (O55:H7; clade 9.3a) as it evolved into GUD− SOR− O157:H7 (Fig. 4 and 5). Surprisingly, CRISPR1 does not show strong evidence of temporal acquisition of spacers on the leader-proximal end. On the contrary, it appears that during the initial steps radiating from clade 9.3a, significant spacer loss occurred. With the exception of one spacer found within CRISPR1 from strain LSU-61 (clade 9.2a) and one spacer in strain G5101 (clade 9.1b), all spacers observed in offspring of clade 9.3a were found in the strain DEC5A and DEC5B spacer arrays. It is also noteworthy that, in the two nodes for which two strains were available for analysis (clade 9.3a and 9.1b), the CRISPR1 alleles differed slightly from one another. All strains analyzed shared the same anchor spacer, and the adjacent spacer was conserved in all but two strains. The lack of the third spacer from the leader distal end in the CRISPR1 allele of strain LSU-61 indicated this strain may not be the direct ancestor of strains on the following nodes. A similar trend of spacer deletion was observed in CRISPR2, where the GUD− SOR− O157:H7 strain has only 1 spacer (Fig. 4). Therefore, CRISPR evolution in E. coli appears more complex than simple spacer acquisition and, similar to what was observed with big-six isolates, the main driver of CRISPR diversity appears to be spacer deletion.
Fig 5.
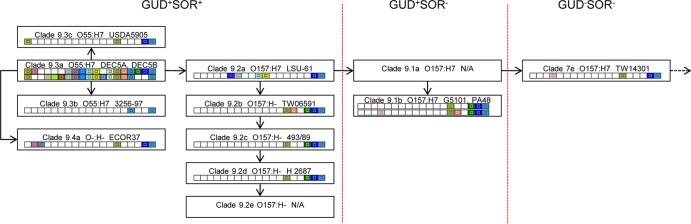
Expanded stepwise evolution model of E. coli O157:H7 with CRISPR1 alleles of representative strains. Evolution nodes are represented by rectangles with CRISPR alleles inside. The β-glucuronidase (GUD) activity and sorbitol (SOR) fermentation activity are shown at the top of each section that is separated by a red dashed line. For clade 9.1a, no known strain fits in this clade. For clade 9.2e, no representative strain was sequenced.
Spacer frequency distribution.
A similar analysis cannot be done for big-six STEC isolates, as we lack detailed phylogenetic analysis for these serogroups. However, if CRISPRs evolved in these strains by the acquisition of new spacers on the leader-proximal end, we would expect that these spacers are less well conserved than leader-distal spacers among a collection of E. coli isolates. In order to analyze the frequency of each spacer, 563 and CRISPR1 and 624 CRISPR2a sequences available in GenBank (see Table S2 in the supplemental material) were analyzed, and two nonredundant E. coli CRISPR array databases were constructed for CRISPR1 (276 arrays) and CRISPR2a (264 arrays) separately (databases available upon request). For O157 and the big-six serogroups, representative CRISPR1 and -2a sequences were chosen and the frequency of each spacer within the database was determined. Two CRISPR1 and -2a arrays from O103 strains were chosen for analysis, reflecting two distinct patterns of spacers observed in CRISPR1 and -2a within this serogroup (designated “dominant allele” and “less-common allele” in Fig. 6). For CRISPR1 arrays, the ancestral spacer was more conserved than the leader-proximal spacer within the nonredundant database for all serotypes analyzed (Fig. 6A). Removal of the anchor spacer, which is highly conserved within CRISPR sequences contained within our database, still showed the expected stepwise decrease in spacer frequency from the leader-distal to the proximal end for serotypes O157:H7, O45:H2, and O111:NM; however, this trend was less obvious for other serotypes. For the CRISPR2a arrays, the stepwise trend was only seen for O157:H− serotypes, and except for the penultimate leader-proximal spacer, for O45:H2 and O103:H2 (dominant CRISPR allele) serotypes as well (Fig. 6B). Unexpectedly, the less-common O103:H2 CRISPR1 allele had a leader-proximal spacer that was more common than those of the other three, and this spacer was the penultimate leader-distal spacer in O103:H2 (dominant allele) isolates. Interestingly, none of the CRISPR1 spacers within serotype O121:H19 strains were commonly found in other strains, and most O145:NM CRISPR1 spacers were uncommon as well.
Fig 6.

Spacer frequency distribution of alleles characteristic of STEC isolates for CRISPR1 (A) and CRISPR2a (B). Shiga toxin-producing E. coli (STEC) spacer arrays are drawn on the x axis, and frequency is labeled on the y axis. The darker the color of the bar, the more frequently the spacer occurs within the 9 alleles, with black representing 9 times.
Spacer BLAST results.
Another indication that CRISPRs might function as an active immune system is whether sequence homology is found between spacers and horizontally acquired DNA, such as plasmids and bacteriophages. Therefore, we used BLAST to analyze all 432 unique spacers from the CRISPR1 and -2 loci we sequenced. Forty-four CRISPR1 and 56 CRISPR2 spacers were unique in the database (i.e., did not match plasmids, phages, or other E. coli CRISPR spacers). Allowing for a 2-nucleotide mismatch, 27 CRISPR1 (12%) and 8 CRISPR2 (4%) spacers matched known phages, plasmids, or putative phage regions (see Tables S8 and S10 in the supplemental material). Interestingly, 6 of 25 spacers of CRISPR1 allele 63 (O6 human isolates) matched the same putative phage region found in E. coli strains E24377A and SE11, and 3 of these spacers were at the leader-proximal end. In addition, 4 of those phage-matching spacers in CRISPR1 allele 63 were also found at the leader-proximal end of CRISPR1 allele 56 (O174 human isolate). Another interesting observation was that the leader-proximal spacer of strain LSU-61 (O157:H7) is likely self-targeting, as it matches the virulence plasmid (pO157) that this strain is known to carry.
DISCUSSION
Although CRISPR sequences were first identified in bacteria in 1987 (43), it took 20 years to demonstrate that these elements constitute an adaptive immune system against foreign DNA (12). Subsequently, numerous research papers have elegantly described many details of CRISPR function (17, 44), and several groups have also developed CRISPR-based applications, including molecular subtyping and detection methods (22–34). These methods are made possible because CRISPR spacer arrays are highly diverse between strains of bacteria, including E. coli and S. enterica; however, they do not evolve as dynamically in these organisms as in organisms such as S. thermophilus. Previous studies suggested that CRISPR loci in E. coli strains are conserved among phylogenetically related strains (18, 19, 37), making CRISPRs potential markers for rapid identification of O157 and big-six STEC strains in mixed cultures. This knowledge was leveraged recently by Delannoy et al. (38), who proposed a highly sensitive and specific qPCR method for such an application, designing primers and probes based upon a limited number of genome and CRISPR sequences available for O26:H11, O45:H2, O103:H2, O111:H8, O121:H19, O145:H28, and O157:H7 strains. Therefore, one major impact of our work is to provide a detailed insight into the CRISPR sequences found within a larger strain collection of STEC and other closely related E. coli strains, in order to better understand the strengths and weaknesses of using CRISPRs as subtyping markers. Additionally, we combined our extensive analysis here with the known evolutionary model of E. coli O157:H7 to gain better insight into CRISPR evolution in this lineage.
Although CRISPR arrays in large collections of E. coli isolates have been characterized before (18, 19, 37), an in-depth study of CRISPR arrays from STEC isolates was lacking. In this article, we showed that CRISPR alleles within isolates from each of the big-six serogroups were similar in terms of spacer content and order, reflecting their close phylogenetic relationship. This finding validated the qPCR primers from the method of Delannoy et al. and suggested that most human and cattle STEC isolates would be detected, as expected. While spacer deletions or, in the case of ST14 from serogroup O26, the presence of an insertion sequence (Fig. 2) were the main causes of false negatives, these were limited to single human isolates (O45 ST27, O111 ST21 and -18, and O121 ST51 isolates) (Fig. 2), less-common STs from cattle isolates (O26 ST14 and O111 ST6, -19, and -23) (Fig. 2), or genome sequences deposited within GenBank (O111 ST24) (Fig. 2). While some of the CRISPR sequences observed were distinct from others found within the same serogroup (O45 ST30, O103 ST47 and -48, O121 ST52 and -53, and O145 ST60), these were again STs that were uncommon, not observed in human isolates, or both. Given our suggestion that being H type may at times be a better indicator of phylogenetic relatedness than being O type (Fig. 4), it is possible that isolates from the same serogroup that have distinct CRISPR sequences express different flagellar antigens. One point to highlight concerning the use of CRISPRs as detection markers is our observation that the related O103 STs ST44, -45, and -46 were found in both cattle and human isolates, but the published qPCR primers are not predicted to anneal to regions within the CRISPR sequences. How common these ST variants are among human and cattle O103 STEC strains would be interesting to know in order to decide whether qPCR primers and probes targeting these strains should be used by laboratories that adopt the method of Delannoy et al. (38).
Another issue seen with the Delannoy et al. qPCR method (38) was cross-reactivity when evaluating strains expressing the same H antigen. For example, the O157:H7 CRISPR-targeting reaction detected O55:H7 strains, and the O45:H2 and O103:H2 primers cross-reacted with O145:H2 and O128:H2 strains. Our data provide explanations for these observations by demonstrating that, in certain cases, isolates sharing a common H antigen also carry similar CRISPR sequences (Fig. 4). This observation is not surprising in retrospect, as it is concordant with a previous publication that used 20-enzyme-based multilocus enzyme electrophoresis (MLEE) to study the clonal relationship among E. coli strains and found that isolates of serotypes O111:H2 and O128:H2 and isolates of serotypes O55:H7 and O157:H7 were phylogenetically related (45). This same study also reported that O26:H11 and O111:H8 serotypes are related, which is also reflected in our CRISPR sequences (Fig. 2). These facts further reinforce previous suggestions that CRISPR sequences and spacer order are conserved among E. coli strains of phylogenetically related serotypes (18, 37).
Our data also provide insights into the temporal evolution of CRISPRs in E. coli, which to date has only been demonstrated in genetically manipulated systems (46, 47). Our results suggest that internal deletion of spacers drives much of the evolution of CRISPRs in E. coli, consistent with previous results (37), while also providing indirect evidence of novel spacer acquisition. For example, our analysis of spacer frequency distribution indicated that most unique E. coli spacers are more localized toward the leader end than are well-distributed spacers (Fig. 6), which is concordant with the results from Touchon et al. (37). There are also a few instances in our sequences, as noted above, where the CRISPR sequences of two strains only differ by one leader-proximal spacer. Our best insight takes advantage of the stepwise progression from E. coli O55:H7 to O157:H7, which is arguably the best-defined process of temporal evolution for E. coli. The most recent refinement of this model (10) proposes that E. coli O55:H7 strains defined as clade 9.3a are the last common ancestor of E. coli O157:H7 (Fig. 5) and that clades 9.2a and 9.1a represent two direct nodes toward clade 7e, the most ancient node containing GUD− SOR− O157:H7. Our analysis does not provide evidence for spacer acquisition along this pathway except for one new spacer in strain LSU-61 and another one in strain G5101. Quite to the contrary, our data suggest that, as evolution radiated from clade 9.3a, massive spacer deletions occurred. It has been suggested that the evolution of O157:H7 from a common ancestor occurred over 7,000 years (7), which suggests that CRISPR changes may occur more rapidly than suggested by Touchon et al. (37). Another way we can indirectly look for CRISPR function is to screen for spacers that match extrachromosomal elements. For the 432 unique spacers identified in the current study, only 8% matched known phages or plasmids, compared to 34% in Streptococcus thermophilus (48) and 24% in Pseudomonas aeruginosa (24); however, our results are consistent with previous E. coli CRISPR studies (18, 37). Nevertheless, spacer matches were observed at the leader end in some O157, O6, and O174 isolates (see Fig. S1 and Tables S8 and S10 in the supplemental material). The observation of adjacent spacers putatively targeting the same prophage is intriguing, given Swarts's experiment demonstrating that 2 or more spacers are commonly acquired in response to plasmid challenge (46). However, while our study does not provide convincing evidence for CRISPRs functioning as an adaptive immune system in E. coli, we certainly cannot discount their role in other cellular processes that would explain the maintenance of these loci within a large number of diverse E. coli isolates. Given the large number of prophages often found in the genomes of these organisms (49–51), we also cannot discount the possibility that CRISPRs are active but their expression is repressed by prophage-encoded anti-CRISPR proteins (52).
In conclusion, for O157 and the big six serotypes, the CRISPR alleles within strains of each serogroup were generally similar in their spacer content and order regardless of the isolation source. Our study confirms that the CRISPR-based qPCR method described previously (38) is an effective way of screening for STEC, while also demonstrating that spacer deletion and conservation of sequences between isolates of a common H antigen are sources of the small number of false positives and negatives observed. Knowing the correlation between phylogeny and CRISPRs, we mapped the CRISPR1 alleles on the evolution model of O157:H7 from O55:H7, and we suggest that spacer deletion is the main driving force of CRISPR evolution in this serotype. Our analysis of the distribution of spacers across the known E. coli genomic landscape (Fig. 6) will provide a reference for a more in-depth analysis of the mechanism of CRISPR evolution within this species.
Supplementary Material
ACKNOWLEDGMENTS
This work was funded by USDA-NIFA grant 2009-03611, by start-up funds through the Penn State University Department of Food Science and College of Agricultural Sciences, and by the Casida Development Professorship to E.G.D.
We thank the Penn State Genomics Core Facility (University Park, PA) for generating DNA sequence information. We thank Carol Sandt from the Pennsylvania Department of Health, Andrew Benson from the Food Science and Technology Department at the University of Nebraska, Peter Feng from the Center for Food Safety and Nutrition at the Food and Drug Administration, Robert Mandrell from the Produce Safety and Microbiology Research Unit at USDA, and Shannon Manning and Beth Whittam from the STEC Center at Michigan State University for providing strains.
Footnotes
Published ahead of print 12 July 2013
Supplemental material for this article may be found at http://dx.doi.org/10.1128/AEM.00950-13.
REFERENCES
- 1.Gyles CL. 2007. Shiga toxin-producing Escherichia coli: an overview. J. Anim. Sci. 85:E45–E62 [DOI] [PubMed] [Google Scholar]
- 2.Ruggenenti P, Noris M, Remuzzi G. 2001. Thrombotic microangiopathy, hemolytic uremic syndrome, and thrombotic thrombocytopenic purpura. Kidney Int. 60:831–846 [DOI] [PubMed] [Google Scholar]
- 3.Scallan E. 2011. Foodborne illness acquired in the United States—major pathogens. Emerg. Infect. Dis. 17:7–15 [DOI] [PMC free article] [PubMed] [Google Scholar]
- 4.Nataro JP, Kaper JB. 1998. Diarrheagenic Escherichia coli. Clin. Microbiol. Rev. 11:142–201 [DOI] [PMC free article] [PubMed] [Google Scholar]
- 5.Centers for Disease Control and Prevention 2012. National Shiga toxin-producing Escherichia coli (STEC) surveillance overview. CDC, Atlanta, GA [Google Scholar]
- 6.Feng P, Lampel KA, Karch H, Whittam TS. 1998. Genotypic and phenotypic changes in the emergence of Escherichia coli O157:H7. J. Infect. Dis. 177:1750–1753 [DOI] [PubMed] [Google Scholar]
- 7.Wick LM, Qi W, Lacher DW, Whittam TS. 2005. Evolution of genomic content in the stepwise emergence of Escherichia coli O157: H7. J. Bacteriol. 187:1783–1791 [DOI] [PMC free article] [PubMed] [Google Scholar]
- 8.Leopold SR, Magrini V, Holt NJ, Shaikh N, Mardis ER, Cagno J, Ogura Y, Iguchi A, Hayashi T, Mellmann A, Karch H, Besser TE, Sawyer SA, Whittam TS, Tarr PI. 2009. A precise reconstruction of the emergence and constrained radiations of Escherichia coli O157 portrayed by backbone concatenomic analysis. Proc. Natl. Acad. Sci. U. S. A. 106:8713–8718 [DOI] [PMC free article] [PubMed] [Google Scholar]
- 9.Kyle JL, Cummings CA, Parker CT, Quiñones B, Vatta P, Newton E, Huynh S, Swimley M, Degoricija L, Barker M, Fontanoz S, Nguyen K, Patel R, Fang R, Tebbs R, Petrauskene O, Furtado M, Mandrell RE. 2012. Escherichia coli serotype O55:H7 diversity supports parallel acquisition of bacteriophage at Shiga toxin phage insertion sites during evolution of the O157:H7 lineage. J. Bacteriol. 194:1885–1896 [DOI] [PMC free article] [PubMed] [Google Scholar]
- 10.Lacher DW. 2011. The evolutionary model of Escherichia coli O157:H7, p 227–239 In Walk ST, Feng PCH. (ed), Population genetics of bacteria: a tribute to Thomas S. Whittam, 1st ed. ASM Press, Washington, DC [Google Scholar]
- 11.Brooks JT, Sowers EG, Wells JG, Greene KD, Griffin PM, Hoekstra RM, Strockbine NA. 2005. Non-O157 Shiga toxin-producing Escherichia coli infections in the United States, 1983-2002. J. Infect. Dis. 192:1422–1429 [DOI] [PubMed] [Google Scholar]
- 12.Barrangou R, Fremaux C, Deveau H, Richards M, Boyaval P, Moineau S, Romero DA, Horvath P. 2007. CRISPR provides acquired resistance against viruses in prokaryotes. Science 315:1709–1712 [DOI] [PubMed] [Google Scholar]
- 13.Bhaya D, Davison M, Barrangou R. 2011. CRISPR-Cas systems in bacteria and archaea: versatile small RNAs for adaptive defense and regulation. Annu. Rev. Genet. 45:273–297 [DOI] [PubMed] [Google Scholar]
- 14.Grissa I, Vergnaud G, Pourcel C. 2007. The CRISPRdb database and tools to display CRISPRs and to generate dictionaries of spacers and repeats. BMC Bioinformatics 8:172. 10.1186/1471-2105-8-172 [DOI] [PMC free article] [PubMed] [Google Scholar]
- 15.Deveau H, Garneau JE, Moineau S. 2010. CRISPR/Cas system and its role in phage-bacteria interactions. Annu. Rev. Microbiol. 64:475–493 [DOI] [PubMed] [Google Scholar]
- 16.Makarova KS, Grishin NV, Shabalina Sa, Wolf YI, Koonin EV. 2006. A putative RNA-interference-based immune system in prokaryotes: computational analysis of the predicted enzymatic machinery, functional analogies with eukaryotic RNAi, and hypothetical mechanisms of action. Biol. Direct 1:7. 10.1186/1745-6150-1-7 [DOI] [PMC free article] [PubMed] [Google Scholar]
- 17.Makarova KS, Haft DH, Barrangou R, Brouns SJJ, Charpentier E, Horvath P, Moineau S, Mojica FJM, Wolf YI, Yakunin AF, Van der Oost J, Koonin EV. 2011. Evolution and classification of the CRISPR-Cas systems. Nat. Rev. Microbiol. 9:467–477 [DOI] [PMC free article] [PubMed] [Google Scholar]
- 18.Touchon M, Rocha EPC. 2010. The small, slow and specialized CRISPR and anti-CRISPR of Escherichia and Salmonella. PLoS One 5:e11126. 10.1371/journal.pone.0011126 [DOI] [PMC free article] [PubMed] [Google Scholar]
- 19.Díez-Villaseñor C, Almendros C, García-Martínez J, Mojica FJM. 2010. Diversity of CRISPR loci in Escherichia coli. Microbiology 156:1351–1361 [DOI] [PubMed] [Google Scholar]
- 20.Barrangou R, Horvath P. 2012. CRISPR: new horizons in phage resistance and strain identification. Annu. Rev. Food Sci. 3:143–162 [DOI] [PubMed] [Google Scholar]
- 21.Groenen PM, Bunschoten AE, Van Soolingen D, Van Embden JD. 1993. Nature of DNA polymorphism in the direct repeat cluster of Mycobacterium tuberculosis; application for strain differentiation by a novel typing method. Mol. Microbiol. 10:1057–1065 [DOI] [PubMed] [Google Scholar]
- 22.Cui Y, Li Y, Gorgé O, Platonov ME, Yan Y, Guo Z, Pourcel C, Dentovskaya SV, Balakhonov SV, Wang X, Song Y, Anisimov AP, Vergnaud G, Yang R. 2008. Insight into microevolution of Yersinia Pestis by clustered regularly interspaced short palindromic repeats. PLoS One 3:e2652. 10.1371/journal.pone.0002652 [DOI] [PMC free article] [PubMed] [Google Scholar]
- 23.Mokrousov I, Limeschenko E, Vyazovaya A, Narvskaya O. 2007. Corynebacterium diphtheriae spoligotyping based on combined use of two CRISPR loci. Biotechnol. J. 2:901–906 [DOI] [PubMed] [Google Scholar]
- 24.Cady KC, White AS, Hammond JH, Abendroth MD, Karthikeyan RSG, Lalitha P, Zegans ME, O'Toole GA. 2011. Prevalence, conservation and functional analysis of Yersinia and Escherichia CRISPR regions in clinical Pseudomonas aeruginosa isolates. Microbiology 157:430–437 [DOI] [PubMed] [Google Scholar]
- 25.D'Auria G, Jiménez-Hernández N, Peris-Bondia F, Moya A, Latorre A. 2010. Legionella pneumophila pangenome reveals strain-specific virulence factors. BMC Genomics 11:181. 10.1186/1471-2164-11-181 [DOI] [PMC free article] [PubMed] [Google Scholar]
- 26.Hoe N, Nakashima K, Grigsby D, Pan X, Dou SJ, Naidich S, Garcia M, Kahn E, Bergmire-Sweat D, Musser JM. 1999. Rapid molecular genetic subtyping of serotype M1 group A Streptococcus strains. Emerg. Infect. Dis. 5:254–263 [DOI] [PMC free article] [PubMed] [Google Scholar]
- 27.McShan WM, Ferretti JJ, Karasawa T, Suvorov AN, Lin S, Qin B, Jia H, Kenton S, Najar F, Wu H, Scott J, Roe BA, Savic DJ. 2008. Genome sequence of a nephritogenic and highly transformable M49 strain of Streptococcus pyogenes. J. Bacteriol. 190:7773–7785 [DOI] [PMC free article] [PubMed] [Google Scholar]
- 28.Fricke WF, Mammel MK, McDermott PF, Tartera C, White DG, Leclerc JE, Ravel J, Cebula TA. 2011. Comparative genomics of 28 Salmonella enterica isolates: evidence for CRISPR-mediated adaptive sublineage evolution. J. Bacteriol. 193:3556–3568 [DOI] [PMC free article] [PubMed] [Google Scholar]
- 29.Liu F, Barrangou R, Gerner-Smidt P, Ribot EM, Knabel SJ, Dudley EG. 2011. Novel virulence gene and clustered regularly interspaced short palindromic repeat (CRISPR) multilocus sequence typing scheme for subtyping of the major serovars of Salmonella enterica subsp. enterica. Appl. Environ. Microbiol. 77:1946–1956 [DOI] [PMC free article] [PubMed] [Google Scholar]
- 30.Liu F, Kariyawasam S, Jayarao BM, Barrangou R, Gerner-Smidt P, Ribot EM, Knabel SJ, Dudley EG. 2011. Subtyping Salmonella enterica serovar enteritidis isolates from different sources by using sequence typing based on virulence genes and clustered regularly interspaced short palindromic repeats (CRISPRs). Appl. Environ. Microbiol. 77:4520–4526 [DOI] [PMC free article] [PubMed] [Google Scholar]
- 31.Horvath P, Romero DA, Coûté-Monvoisin A-C, Richards M, Deveau H, Moineau S, Boyaval P, Fremaux C, Barrangou R. 2008. Diversity, activity, and evolution of CRISPR loci in Streptococcus thermophilus. J. Bacteriol. 190:1401–1412 [DOI] [PMC free article] [PubMed] [Google Scholar]
- 32.Guinane CM, Kent RM, Norberg S, Hill C, Fitzgerald GF, Stanton C, Ross RP. 2011. Host specific diversity in Lactobacillus johnsonii as evidenced by a major chromosomal inversion and phage resistance mechanisms. PLoS One 6:e18740. 10.1371/journal.pone.0018740 [DOI] [PMC free article] [PubMed] [Google Scholar]
- 33.Shariat N, Kirchner MK, Sandt CH, Trees E, Barrangou R, Dudley EG. 2013. Subtyping of Salmonella enterica serovar Newport outbreak isolates by CRISPR-MVLST and determination of the relationship between CRISPR-MVLST and PFGE Results. J. Clin. Microbiol. 51:2328–2336 [DOI] [PMC free article] [PubMed] [Google Scholar]
- 34.Shariat N, DiMarzio MJ, Yin S, Dettinger L, Sandt CH, Lute JR, Barrangou R, Dudley EG. 2013. The combination of CRISPR-MVLST and PFGE provides increased discriminatory power for differentiating human clinical isolates of Salmonella enterica subsp. enterica serovar Enteritidis. Food Microbiol. 34:164–173 [DOI] [PubMed] [Google Scholar]
- 35.Deveau H, Barrangou R, Garneau JE, Labonté J, Fremaux C, Boyaval P, Romero DA, Horvath P, Moineau S. 2008. Phage response to CRISPR-encoded resistance in Streptococcus thermophilus. J. Bacteriol. 190:1390–1400 [DOI] [PMC free article] [PubMed] [Google Scholar]
- 36.Andersson AF, Banfield JF. 2008. Virus population dynamics and acquired virus resistance in natural microbial communities. Science 320:1047–1050 [DOI] [PubMed] [Google Scholar]
- 37.Touchon M, Charpentier S, Clermont O, Rocha EPC, Denamur E, Branger C. 2011. CRISPR distribution within the Escherichia coli species is not suggestive of immunity-associated diversifying selection. J. Bacteriol. 193:2460–2467 [DOI] [PMC free article] [PubMed] [Google Scholar]
- 38.Delannoy S, Beutin L, Fach P. 2012. Use of clustered regularly interspaced short palindromic repeat sequence polymorphisms for specific detection of enterohemorrhagic Escherichia coli strains of serotypes O26:H11, O45:H2, O103:H2, O111:H8, O121:H19, O145:H28, and O157:H7 by real-time PCR. J. Clin. Microbiol. 50:4035–4040 [DOI] [PMC free article] [PubMed] [Google Scholar]
- 39.Delannoy S, Beutin L, Burgos Y, Fach P. 2012. Specific detection of enteroaggregative hemorrhagic Escherichia coli O104:H4 strains by use of the CRISPR locus as a target for a diagnostic real-time PCR. J. Clin. Microbiol. 50:3485–3492 [DOI] [PMC free article] [PubMed] [Google Scholar]
- 40.Fabre L, Zhang J, Guigon G, Le Hello S, Guibert V, Accou-Demartin M, De Romans S, Lim C, Roux C, Passet V, Diancourt L, Guibourdenche M, Issenhuth-Jeanjean S, Achtman M, Brisse S, Sola C, Weill F-X. 2012. CRISPR typing and subtyping for improved laboratory surveillance of Salmonella infections. PLoS One 7:e36995. 10.1371/journal.pone.0036995 [DOI] [PMC free article] [PubMed] [Google Scholar]
- 41.Manning SD, Motiwala AS, Springman AC, Qi W, Lacher DW, Ouellette LM, Mladonicky JM, Somsel P, Rudrik JT, Dietrich SE. 2008. Variation in virulence among clades of Escherichia coli O157: H7 associated with disease outbreaks. Proc. Natl. Acad. Sci. U. S. A. 105:4868–4873 [DOI] [PMC free article] [PubMed] [Google Scholar]
- 42.Hartzell A, Chen C, Lewis C, Liu K, Reynolds S, Dudley EG. 2011. Escherichia coli O157:H7 of genotype lineage-specific polymorphism assay 211111 and clade 8 are common clinical isolates within Pennsylvania. Foodborne Pathog. Dis. 8:763–768 [DOI] [PubMed] [Google Scholar]
- 43.Ishino Y, Shinagawa H, Makino K, Amemura M, Nakata A. 1987. Nucleotide sequence of the iap gene, responsible for alkaline phosphatase isozyme conversion in Escherichia coli, and identification of the gene product. J. Bacteriol. 169:5429–5433 [DOI] [PMC free article] [PubMed] [Google Scholar]
- 44.Barrangou R. 2013. CRISPR-Cas systems and RNA-guided interference. Wiley Interdiscip. Rev. RNA 4:267–278 [DOI] [PubMed] [Google Scholar]
- 45.Whittam TS, Wolfe ML, Wachsmuth IK, Orskov F, Orskov I, Wilson RA. 1993. Clonal relationships among Escherichia coli strains that cause hemorrhagic colitis and infantile diarrhea. Infect. Immun. 61:1619–1629 [DOI] [PMC free article] [PubMed] [Google Scholar]
- 46.Swarts DC, Mosterd C, Van Passel MWJ, Brouns SJJ. 2012. CRISPR interference directs strand specific spacer acquisition. PLoS One 7:e35888. 10.1371/journal.pone.0035888 [DOI] [PMC free article] [PubMed] [Google Scholar]
- 47.Datsenko KA, Pougach K, Tikhonov A, Wanner BL, Severinov K, Semenova E. 2012. Molecular memory of prior infections activates the CRISPR/Cas adaptive bacterial immunity system. Nat. Commun. 3:945. 10.1038/ncomms1937 [DOI] [PubMed] [Google Scholar]
- 48.Bolotin A, Quinquis B, Sorokin A, Ehrlich SD. 2005. Clustered regularly interspaced short palindrome repeats (CRISPRs) have spacers of extrachromosomal origin. Microbiology 151:2551–2561 [DOI] [PubMed] [Google Scholar]
- 49.Ogura Y, Ooka T, Iguchi A, Toh H, Asadulghani M, Oshima K, Kodama T, Abe H, Nakayama K, Kurokawa K. 2009. Comparative genomics reveal the mechanism of the parallel evolution of O157 and non-O157 enterohemorrhagic Escherichia coli. Proc. Natl. Acad. Sci. U. S. A. 106:17939–17944 [DOI] [PMC free article] [PubMed] [Google Scholar]
- 50.Perna NT, Plunkett G, Burland V, Mau B, Glasner JD, Rose DJ, Mayhew GF, Evans PS, Gregor J, Kirkpatrick HA, Pósfai G, Hackett J, Klink S, Boutin A, Shao Y, Miller L, Grotbeck EJ, Davis NW, Lim A, Dimalanta ET, Potamousis KD, Apodaca J, Anantharaman TS, Lin J, Yen G, Schwartz DC, Welch RA, Blattner FR. 2001. Genome sequence of enterohaemorrhagic Escherichia coli O157:H7. Nature 409:529–533 [DOI] [PubMed] [Google Scholar]
- 51.Hayashi T, Makino K, Ohnishi M, Kurokawa K, Ishii K, Yokoyama K, Han CG, Ohtsubo E, Nakayama K, Murata T, Tanaka M, Tobe T, Iida T, Takami H, Honda T, Sasakawa C, Ogasawara N, Yasunaga T, Kuhara S, Shiba T, Hattori M, Shinagawa H. 2001. Complete genome sequence of enterohemorrhagic Escherichia coli O157:H7 and genomic comparison with a laboratory strain K-12. DNA Res. 8:11–22 [DOI] [PubMed] [Google Scholar]
- 52.Bondy-Denomy J, Pawluk A, Maxwell KL, Davidson AR. 2013. Bacteriophage genes that inactivate the CRISPR/Cas bacterial immune system. Nature 493:429–432 [DOI] [PMC free article] [PubMed] [Google Scholar]
Associated Data
This section collects any data citations, data availability statements, or supplementary materials included in this article.