

Abstract
Nonpigmented and late-pigmenting rapidly growing mycobacteria (RGM) have been reported to commonly colonize water production and distribution systems. However, there is little information about the nature and distribution of RGM species within the different parts of such complex networks or about their clustering into specific RGM species communities. We conducted a large-scale survey between 2007 and 2009 in the Parisian urban tap water production and distribution system. We analyzed 1,418 water samples from 36 sites, covering all production units, water storage tanks, and distribution units; RGM isolates were identified by using rpoB gene sequencing. We detected 18 RGM species and putative new species, with most isolates being Mycobacterium chelonae and Mycobacterium llatzerense. Using hierarchical clustering and principal-component analysis, we found that RGM were organized into various communities correlating with water origin (groundwater or surface water) and location within the distribution network. Water treatment plants were more specifically associated with species of the Mycobacterium septicum group. On average, M. chelonae dominated network sites fed by surface water, and M. llatzerense dominated those fed by groundwater. Overall, the M. chelonae prevalence index increased along the distribution network and was associated with a correlative decrease in the prevalence index of M. llatzerense, suggesting competitive or niche exclusion between these two dominant species. Our data describe the great diversity and complexity of RGM species living in the interconnected environments that constitute the water production and distribution system of a large city and highlight the prevalence index of the potentially pathogenic species M. chelonae in the distribution network.
INTRODUCTION
Nonpigmented and late-pigmenting rapidly growing mycobacteria (RGM) are ubiquitous in soil and water environments (1–6). Most are harmless saprophytes, but some, such as Mycobacterium chelonae and Mycobacterium abscessus, are opportunistic pathogens that are causing increasing concern (7–9). Potentially pathogenic RGM are associated with a wide spectrum of diseases in humans, including pulmonary tract, skin, soft tissue, and disseminated infections (10–14), mostly in patients with predisposing conditions (e.g., lung diseases, chronic obstructive pulmonary disease, cystic fibrosis, genetic predisposition, or immunosuppressive therapy). Contamination and hypersensitive reactions are often due to environmental exposure (associated with, for example, hot tubs, metalworking fluids, or contaminated dust) (15–19), and many outbreaks following invasive medical procedures have been reported over the last decade (20–25). Tap water may be an important source of contamination in urban environments (13, 18, 26–30).
RGM are commonly recovered from water treatment and distribution systems (31–38), probably because they can form biofilms (2, 39–41) and resist chlorination and oligotrophic conditions (42, 43). Mycobacterium chelonae and Mycobacterium fortuitum were the species most frequently detected in previous studies (31, 34, 35, 40, 44). However, those previous studies involved only a small number of samples collected from a limited part of the water system considered and provided only qualitative information. Most of these studies addressed specifically RGM, and few used molecular methods allowing an accurate identification of isolates to the species level (e.g., rpoB or hsp65 gene sequencing) (31, 34, 40, 44). Thus, although there are many reports of RGM detection in water treatment and distribution systems, there are no rigorous and quantitative descriptions of the diversity and spatial distribution of RGM species within these complex systems and no robust information about their clustering into communities.
Le Dantec et al. (44) reported a survey conducted in 2000 to 2001 and analyzed the occurrence of nontuberculous mycobacteria (NTM) in the southern part of the Paris urban water system. NTM detection rates were found to differ between two water treatment plants and to increase along the distribution network. However, nearly 55% of the NTM isolates were not identified to the species level, and only three RGM species were detected: M. chelonae, M. fortuitum, and Mycobacterium peregrinum. This study included only one-third of the distribution units and did not include a data set representative of proximal parts of the Parisian distribution network. Also, the small number of samples prevented statistical analysis.
We report a large-scale systematic survey of RGM in the Parisian water treatment and distribution system, using an rpoB-based identification method (45, 46).
We specifically addressed the following questions. (i) What is the prevalence index of RGM in different parts of the network? (ii) What RGM species are present within the network, and what is the prevalence index of each? (iii) Do some RGM species accumulate in particular parts of the network, and is there a significant link between these groups of species and the origin of the water (groundwater or surface water)?
We also tested the validity of hypotheses and results from previous small-sample studies by using an extensive sampling procedure to calculate a statistical index of RGM prevalence, allowing reliable comparisons.
MATERIALS AND METHODS
The Parisian drinking water supply system.
Both surface water and groundwater feed the Parisian water treatment and distribution system (Fig. 1). Two of the three surface water treatment plants are fed by the Seine river (plants W and Y), and one is fed by the Marne river (plant X). The treatment process differs between plants: (i) plant W uses preozonation, coagulation flocculation settling, rapid sand filtration, ozonation, filtration through granular activated carbon, and chlorination, and (ii) plants X and Y use preozonation, contact coagulation on biolite, rapid sand filtration, slow sand filtration, ozonation, filtration through granular activated carbon, and chlorination. The groundwater, carried by three aqueducts, comes from several springs in catchment areas 150 km south of Paris (aqueducts A and B) and 175 km west of Paris (aqueduct C). It is filtered through granular activated carbon and then chlorinated (aqueducts A and B) or treated with powdered activated carbon and then chlorinated and subjected to ultrafiltration (aqueduct C).
Fig 1.

Paris water production system and distribution network. D, distribution unit.
The treated water is stored in tanks with a storage capacity of 90,000 to 200,000 m3. The water generally remains in these tanks for about 2 to 3 days. There are nine storage tanks (tanks T1 to T9), which are supplied with either groundwater (tanks T1 and T4), surface water (tanks T5 to T9), or both (tanks T2 and T3) (see Fig. SA1 in the supplemental material for the detailed network topology).
Upon release from storage, the water flows into the water distribution system (∼1,600 km of cast-iron pipelines), where the average residence time is 6 h. This network is divided into 16 areas of homogeneous water origins, known as “distribution units” (Fig. 1). We studied 15 distribution units (units D1 to D15) for which the water origin is clearly known.
Sampling protocol and locations.
Water samples were collected monthly from 36 points in the production (plants W, X, and Y and aqueducts A, B, and C), storage (tanks T1 to T9), and distribution (units D1 to D15) systems (see Table SA1 and Fig. SA1 in the supplemental material). At plants, samples were collected immediately following each of the following treatment steps: ozonation, granular activated carbon filtration, and chlorination. Samples from aqueducts were collected after chlorination. Water from storage tanks was collected at the tank exits. Water from the distribution system (2 to 4 sampling sites per distribution unit) was sampled from the drinking network pipes. In total, 1,418 water samples were collected during the 3-year study period: 325 samples from the production system (plants and aqueducts), 246 samples from the storage system (tanks), and 847 samples from the distribution system, corresponding to an average of 39 samples for each sampling site (i.e., 1 sample per month on average).
RGM culture and isolation from water samples.
Water samples were collected into sterile bottles and processed within 12 h of collection. Samples were treated as previously described (44). A 1-liter volume of collected water was filtered through a 0.45-μm-pore-size cellulose membrane (Millipore). The membrane was immersed in 10 ml of the same water sample, sonicated for 10 min, and then decontaminated by the addition of sodium lauryl sulfate to 3% and NaOH to 1%. After neutralization, bacteria were concentrated by centrifugation, and equal volumes were used to inoculate each of six Löwenstein-Jensen and Coletsos agar slants. Cultures were incubated at 30°C and 37°C and examined three times during the first week and then weekly for 2 months. Suspected RGM colonies were streaked for isolation on agar slants and then stained by the Kinyoun-modified Ziehl-Neelsen method. Acid-fast bacteria yielding nonpigmented colonies in <7 days were subjected to rpoB sequencing (see below).
rpoB-based identification.
Partial rpoB sequencing was performed as described previously (47). A total of 98% of tested isolates could be amplified by PCR, and every amplified DNA could be analyzed by sequencing. BLAST was used to compare sequences with a local bank of NTM rpoB sequences extracted from GenBank. RGM species identification was based on an identity threshold of 97%, as described by Adekambi et al. (48–50). Sequences displaying <97% identity with any known RGM sequence were considered to be new rpoB RGM sequence types (labeled ParisRGMnew with a specific code number).
Alignments and phylogenetic analysis.
The website http://www.phylogeny.fr/ was used for phylogenetic analyses (51). MUSCLE (http://www.drive5.com/muscle/) was used to align rpoB sequences, and a conserved stretch of 567 bp was selected with Gblocks (52). A representative set of RGM rpoB sequences was chosen for alignment and tree construction (Table 1). A distance tree was constructed by the neighbor-joining method with 1,000 bootstrap replicates and the Kimura 2-substitution model. Similar results were obtained with the maximum likelihood method.
Table 1.
GI numbers of rpoB sequences used for alignment and distance tree construction
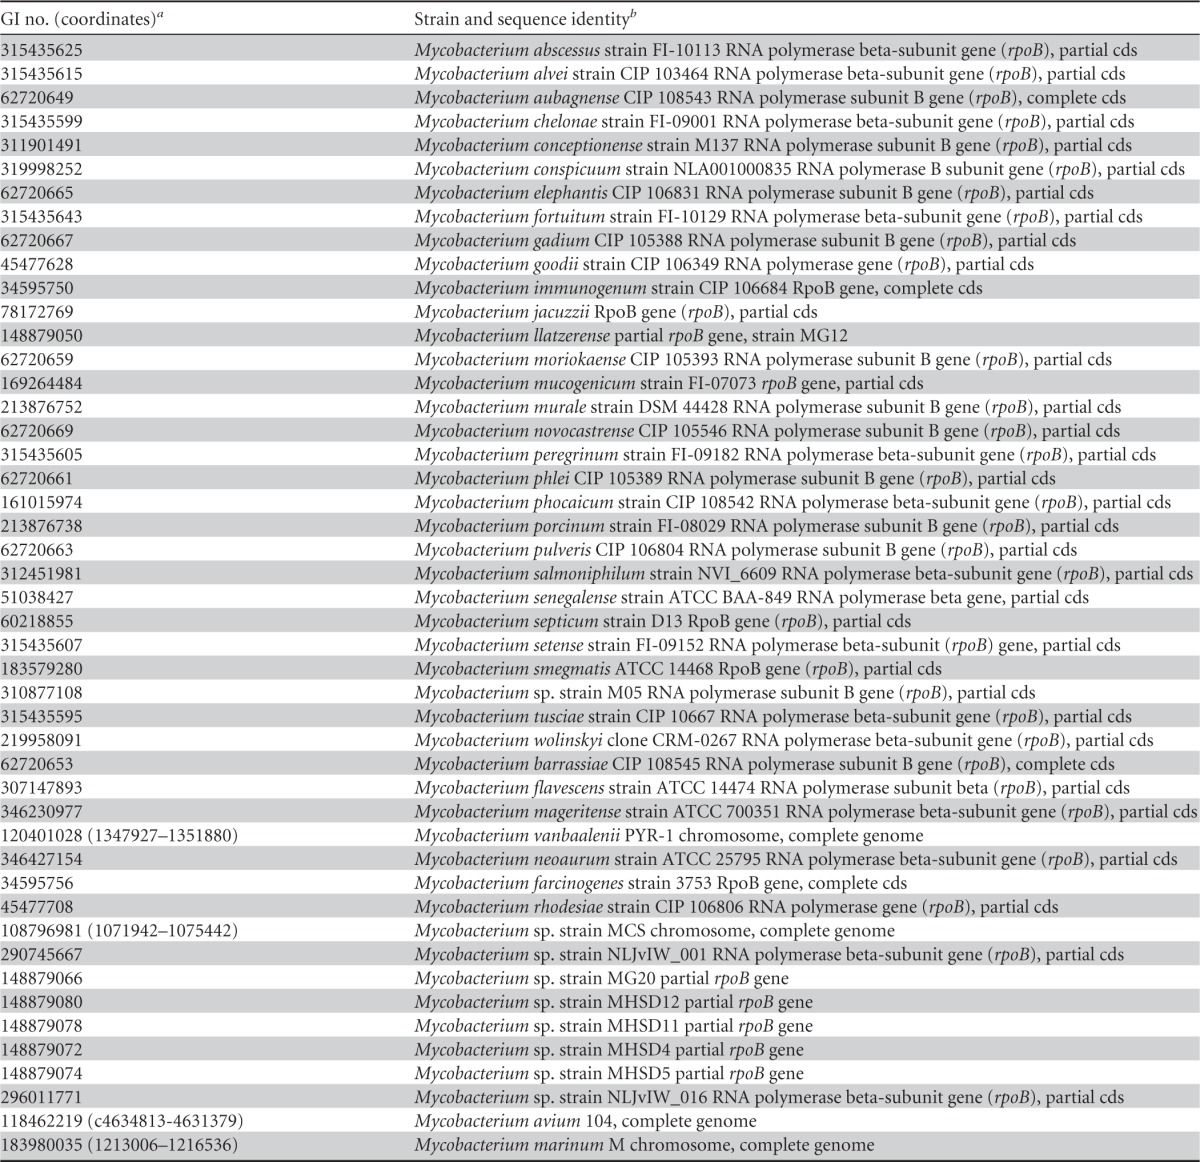
For complete genomes, sequence coordinates on the chromosome are indicated.
cds, partial coding sequence.
Prevalence index.
For each 1-liter sample collected from the network, the RGM culture and isolation method (see above) provided a binomial response for all RGM species grouped together (or for each species individually): 0 when no RGM was detected and 1 when RGM were detected. These binomial variables were analyzed with generalized linear models (GLMs) to estimate the RGM detection probability: the estimated probability (0 to 1) of detecting RGM (or a particular RGM species) in a 1-liter sample of water. This estimation method was used rather than directly computing the proportion of positive samples (the number of positive samples divided by the total number of samples studied) for the following two reasons. (i) It provides unbiased estimators of the detection probabilities, which is not always the case if the proportion of positive samples is used, especially when the samples are not all independent. In such a situation, generalized linear mixed models (GLMMs) should be applied to provide unbiased estimators by taking into account the nonindependence of the samples, for example, those collected at the same sampling location. (ii) GLM and GLMM both provide reliable estimators of the RGM detection probability and their associated 95% confidence intervals (CIs); such confidence intervals are required for a statistically valid comparison of the prevalence index between sampling locations (8, 53). The prevalence index was calculated from the results of the isolation and identification of RGM at each site. Each individual RGM isolation is not in itself quantitative, but repeated isolation analyses at each sampling site can be considered repeated random sampling, allowing statistical estimation of the RGM detection probability (here called the “prevalence index”). This prevalence index is not the same as a proportion, usually measured as the number of positive samples divided by the total number of samples studied and expressed as a percentage.
Prevalence indexes were estimated by using generalized linear models (GLM function of R [54], link = logit) (Fig. 2A) or generalized mixed linear models (GLMM PQL function of the MASS library [55], link = logit) (Fig. 2B) fitted to the binomial data for the presence or absence of RGM in 1-liter samples. We used mixed models to estimate the mean prevalence index in the whole network. Location in the network (production, plant, storage, or distribution) was used as the random effect (56). These models provide unbiased estimates of prevalence values with their 95% CIs for the network as a whole or for each position in the network, depending on the analysis. This approach was applied to all RGM species considered together or to each RGM species independently. Two prevalence values were considered to differ significantly from each other if their 95% CIs did not overlap. The estimated detection probabilities are referred to as prevalence indexes.
Fig 2.

RGM prevalence index in the Parisian water network. (A) Estimated mean RGM prevalence (detection of at least one RGM isolate in 1 liter) in production units (white, before chlorination; light gray, after chlorination), storage tanks (dark gray), and sites of distribution (black). The 95% CI values are reported where their calculation was possible. Squares indicate the estimated means for all points of the same color. The arrows connect the three treatment steps within each production plant. Abbreviations: Aq, aqueduct; Oz, ozonation; Ca, granular activated charcoal; Cl, chlorination; T, water storage tank; D, distribution unit. (B) Mean prevalences (95% CIs) of the 18 RGM species and putative new species isolated from the network. Only one isolate each was recovered for M. fortuitum, ParisRGMnew2, and ParisRGMnew5 to ParisRGMnew8.
Hierarchical clustering.
We identified putative groups of RGM species and estimated the distances between them at the different collection sites by applying hierarchical clustering to a distance matrix built as follows. We estimated the prevalence index of each species at each of the 36 collection sites with a binomial linear model, as described above. We included the 12 most prevalent species for the cluster analysis and excluded sampling points with fewer than six identified isolates (four sampling points, all at water treatment plants, were thus excluded). This prevalence index matrix was then used for the cluster analysis (pvclust function, with the average method and correlation distance) (57). This generated a distance tree, which was used to identify groups of different RGM species assemblages. RGM groups were determined (bootstrap value of >99%). The hypothesis of overrepresentation of sampling points of surface water or groundwater origin was tested. A binomial test allowed determination of associated P values.
Principal-component analysis.
We performed a principal-component analysis (PCA) of the prevalence index matrix (FactoMineR package, PCA function) (58). Only species occurring more than three times were considered. Correlation coefficients were determined (dimdesc function) with P values of <5%. Confidence ellipses for each RGM group were calculated (ellipse function) with P values of <5%.
RESULTS
RGM prevalence.
The overall RGM prevalence index at sampling sites was 3.5 to 100% (Fig. 2A), with an overall mean value of 72% (95% CI, 40 to 92%) across the whole network. Of the water treatment units, plant W had the lowest RGM prevalence index for all steps of the water treatment process. In each plant, the RGM prevalence was highest after filtration through granular activated carbon. On average, the RGM prevalence index increased from the production unit exits (54% [95% CI, 46 to 62%]) to the tanks (75% [95% CI, 69 to 80%]) and distribution units (96% [95% CI, 94 to 97%]) (Fig. 2). The RGM prevalence index was significantly lower after the terminal chlorination step for plant W (3.5% [95% CI, 0.2 to 15%]) and plant X (48% [95% CI, 30 to 66%]) (Fig. 2A). However, the RGM prevalence indexes in chlorinated water from aqueducts A and B were quite high (90% and 100%, respectively). The RGM prevalence index at three water storage tanks was significantly lower than average (tanks T1, T3, and T4), whereas at two tanks, it was higher (tanks T5 and T6). The mean RGM prevalence index was above 80% for all distribution units (Fig. 2A; see also Table SA1 in the supplemental material).
RGM species diversity and prevalence.
A total of 643 RGM isolates were recovered from the network; rpoB amplification and sequencing were successful for 630 of them (98%). Eighteen RGM “species” (i.e., displaying an rpoB sequence type differing by at least 3% from any other rpoB sequence) were identified: nine previously described RGM species, one recently described rpoB sequence type (rpoB sequence type NLJvIW_016 [59]), and eight new RGM rpoB sequence types (ParisRGMnew1 to ParisRGMnew8) (Fig. 2B and 3). ParisRGMnew1, ParisRGMnew3, and ParisRGMnew4 were recovered several times from independent water samples. ParisRGMnew1 and ParisRGMnew3 constitute a new group with NLJvIW_016 and ParisRGMnew7 (Fig. 3). ParisRGMnew4 is close in the rpoB tree to species of the M. fortuitum group (including M. alvei, M. septicum, and M. peregrinum) (Fig. 3).
Fig 3.

Positions of the 18 RGM species and putative new species isolated from the Parisian water network within the RGM distance tree based on rpoB sequence alignment. The tree was constructed by the neighbor-joining method with 1,000 bootstrap replicates and the Kimura 2-substitution model. Branches with bootstrap values below 75% were collapsed. Black boxes highlight RGM species and putative new species isolated from the Parisian network. Values in parentheses are the total numbers of isolates recovered.
M. chelonae and M. llatzerense were by far the most frequently recovered species (average prevalences of 25% and 20%, respectively) (Fig. 2B). Six other RGM had mean prevalence index values of between 1.5 and 5.3%: M. setense, M. salmoniphilum, M. peregrinum, M. septicum, ParisRGMnew4, and ParisRGMnew1. The other RGM were found at very low frequencies (<1%) (Fig. 2B).
RGM species composition groups.
Hierarchical cluster analysis identified four groups with specific RGM species compositions within the network (RGM groups 1 to 4) (Fig. 4A and B). Group 1 clustered away from the others and comprised all sites at water treatment plants (upstream of the exit). The three other groups included all distribution network sampling sites (production exits and storage and distribution units). The sampling sites for water of groundwater origin were overrepresented in group 2 (P = 0.01), sampling sites for water of mixed origin were overrepresented in group 3 (P = 0.1), and those for surface water were overrepresented in group 4 (P = 0.03). Almost all sampling sites for water of groundwater origin were in group 2, whereas almost all sampling sites for surface water and water of mixed origin were in groups 3 and 4. Thus, RGM species composition allows the description of a limited number of groups that correlate with the origin of the water (groundwater versus surface water) and location in the network (water treatment plants versus distribution units).
Fig 4.

RGM species community groups. (A) Relative occurrence of the main RGM species and heat map diagram. Only species detected more than once are shown. The greyscale intensity of each rectangle is proportional to the normalized frequency of the RGM species at each sampling point. (B) Hierarchical clustering of RGM species composition found at each sampling point, based on average distance and the correlation calculation method. Bootstrap value calculations were based on 1,000 samplings (all >99% for the identified RGM groups). Black circles, surface water origin; white circles, groundwater origin; gray circles, mixed origin. Note that four groups are individualized (excluding a single branch representing the aqueduct B production site exit).
Structure of RGM species composition.
The RGM species forming the four groups identified by hierarchical clustering analysis and their relationships with RGM species content were further studied by principal-component analysis (PCA) with the same data set. The four groups were clearly distinct (Fig. 5A). Group 1 was located in the upper right quadrant of Fig. 5A and was associated with sampling sites at water treatment plants. This direction was defined by a specific RGM species group associating M. peregrinum, ParisRGMnew4, and, to a lesser extent, M. septicum (correlation coefficients on the first dimension of 0.59, 0.62, and 0.43, respectively) (Fig. 5B).
Fig 5.

Principal-component analysis of RGM content at the points of the production system and distribution network. Only species detected in at least three independent samples were considered. (A) Individual-factor map. RGM species community groups revealed by clustering analysis are indicated with probability ellipses (95% CIs). (B) Variable-factor map.
Group 2 was located in the upper left quadrant of Fig. 5A and included all sampling sites in the water distribution network of groundwater origin. This direction was characterized by another group of species: M. llatzerense, M. salmoniphilum, and ParisRGMnew3 (correlation coefficients on the first dimension of −0.69, −0.54, and −0.5, respectively) (Fig. 5B).
Group 3 was located in the center of the map (Fig. 5A) (mainly sampling sites for water of mixed origin) and thus was not characterized by an RGM species composition differing from that found on average in the water system.
Group 4 was in the lower right quadrant of Fig. 5A (mainly sampling sites for water of surface origin). In the first dimension, this direction was defined by the same species as group 1 (i.e., M. peregrinum, ParisRGMnew4, and M. septicum); in the second dimension, this direction was defined by M. chelonae (correlation coefficient, −0.76) and, to a lesser extent, NLJvIW_016 (correlation coefficient, −0.4). Interestingly, all but one of the sampling sites of the water distribution network for water of surface origin were located in the lower quadrants (right and left) and were defined by a greater occurrence of M. chelonae and NLJvIW_016.
Thus, M. chelonae and NLJvIW_016 are associated with sampling sites fed by surface water, and M. llatzerense, M. salmoniphilum, and ParisRGMnew3 are associated with sampling sites fed by groundwater. This was confirmed by a PCA including only sampling sites in the distribution network (data not shown).
Variations of M. chelonae and M. llatzerense prevalences along the water distribution network.
We compared the prevalence values for M. chelonae and M. llatzerense at different levels of the distribution network (water production plants, water production exits, storage tanks, and distribution units) according to water origin (Fig. 6). At every level of the distribution network, the prevalence index of M. chelonae was higher for sampling sites for water of surface origin than for those for water of groundwater origin; consistently, sampling sites with mixed water origins had an intermediate prevalence. Irrespective of the water origin, the M. chelonae prevalence index increased along the water distribution network, with mean values of between 40 and 45% for distribution units fed by surface water and mixed water, respectively, and around 25% for those fed by groundwater. In contrast, the prevalence index of M. llatzerense was higher for parts fed by groundwater at both the production and storage levels but decreased substantially between the storage and distribution levels to about 25%, a value very similar to that found for parts fed by surface water or mixed water.
Fig 6.

Variation of M. chelonae and M. llatzerense prevalences along the Parisian water production and distribution system. The estimated mean prevalence values (95% CIs) at the production, storage, and distribution unit sites according to the origin of water are shown.
To determine if there was a relationship between the presence of M. chelonae and that of M. llatzerense, we plotted variations of their prevalence index estimates for each point which could be univocally linked to an upstream point in the network (Fig. 7). As expected, the prevalence index of M. chelonae significantly increased with distance along the network (M. chelonae variations significantly higher than 0 on the x axis; P < 0.05), and this increase was linearly correlated with the decrease of the M. llatzerense prevalence index (Pearson's product-moment correlation [R] = −0.76 [95% confidence interval, −0.91, −0.44]; t15 = −4.54; P < 0.001) (Fig. 7). Thus, the increase of the M. chelonae prevalence index with progression along the water distribution network was associated with a decline in the M. llatzerense prevalence index, indicating RGM community species rearrangements along the water distribution network.
Fig 7.

Relative variation of M. chelonae and M. llatzerense from each point of the water distribution network compared with the upper point to which it is connected. Only points connected with a single point of origin were studied. Overall mean (squares) and 95% CI values are indicated for each species. The Pearson correlation coefficient is indicated.
DISCUSSION
This is the first large-scale survey describing RGM diversity, prevalence, and species composition in an entire water treatment and distribution system. We report the first extensive sampling procedure in the water network of a large city, in this case Paris. This large-scale sampling strategy enabled us to estimate mean RGM detection probabilities and their associated confidence intervals both locally (at each tested location of the water system) and for the entire system. This was done for each species independently and for all RGM grouped together. The resulting estimated RGM prevalence indexes were suitable for reliable comparisons between species and between sampling sites. RGM were ubiquitous (overall prevalence index of >70%), with a continuous increase along the network to prevalence index values exceeding 95% in the distribution units. The presence of RGM within water production and distribution networks and their increases in the terminal ends of the networks have been reported by studies on NTM as a whole (40, 60). However, our study specifically focusing on RGM shows that the prevalence index and species diversity are much higher than reported in previous studies. For example, the 2000-2001 study on NTM in the Parisian water network reported only 16% of samples to be RGM positive and the isolation of only three different RGM species (44). Other studies on NTM in drinking water networks similarly reported no more than three or four RGM species. We detected nine RGM species and possibly eight putative new RGM species on the basis of their rpoB sequences (>3% divergence from any other rpoB sequence [1–6]). Only one of the eight sequences possibly corresponding to putative new RGM species has been reported previously (NLJvIW_016 rpoB sequence [see below]) (37). We are currently characterizing four of them, NLJvIW_016, ParisRGMnew1, ParisRGMnew3, and ParisRGMnew4, in more detail.
There are various possible reasons why we detected so many RGM species. First, the water system of a large city like Paris may be seen as being composed of different ecosystems that may be associated with specific RGM species communities. Studies focusing on a restricted part of the water system (like all previous studies) are very likely to be subject to strong sampling bias and to fail to detect species that are associated with other parts of the water system. Second, some species were detected at a very low frequency and were detected only because of the large number of isolates analyzed (630 isolates subjected to rpoB sequencing). Previous small-sampling strategies (31, 34, 35, 44) thus gave a biased picture of the RGM community in the water system, underestimating species diversity. Third, recent improvements in molecular identification of RGM allowed us to identify an unprecedented proportion of the isolates by rpoB sequencing and to discover several putative new species (61).
M. chelonae and M. llatzerense are by far the most prevalent RGM species in the Paris water distribution network. M. chelonae has been found in urban water systems worldwide (38, 39, 59), but its prevalence index and spatial distribution have never been estimated. M. llatzerense has been isolated from tap water samples (59, 62) but has not been detected previously in water distribution networks (34, 38, 44, 59), most probably because this species had not been described at the time when these studies were performed (62). Consistent with our results, M. peregrinum (2, 31), M. septicum (31, 35, 37), and M. salmoniphilum (37, 60, 63) have been isolated from similar water systems. These observations suggest that the RGM species community groups identified in the Parisian water distribution system may be common to other urban water distribution networks. However, differences in water origin, climate, or treatment processes may affect RGM community groups. Indeed, some studies in Mexican, Greek, and South African cities reported very different RGM species communities (31, 35, 64). Differences in RGM isolation protocols may also contribute to these observed differences.
Our data show clearly that the RGM species present in the water distribution network form two types of communities that are determined by the origin of the water (surface water versus groundwater). This possibility was suggested by the 2000-2001 survey (44), which described differences between the NTM species detected in the distribution units studied; however, it was not possible to determine whether NTM species compositions where shaped by the production units per se, by the water origin, or by both. Our study clarifies this point and demonstrates, with robust statistics, that water origin is a major factor shaping the structure of RGM communities (M. llatzerense, M. salmoniphilum, and ParisRGMnew3 for units fed with groundwater versus M. chelonae and NLJvIW_016 for those fed with surface water). Our data are consistent with a previous study by van Ingen et al. in the Netherlands, which reported the frequent recovery of M. llatzerense and M. salmoniphilum from household tap water of groundwater origin (37). The association of M. llatzerense and M. salmoniphilum with groundwater may reflect adaptation to lower temperatures for these species, which have a more psychrophilic profile than other mycobacteria such as M. chelonae and M. fortuitum (62, 63). Groundwater temperatures are not subject to seasonal variation and are substantially lower than surface water temperatures (13°C on average, with maxima of 15°C, versus 15°C on average, with maxima of 21°C, respectively, in water storage tanks [data not shown]). No “thermophilic” RGM (e.g., species from the M. smegmatis group) were isolated in our survey, consistent with temperature having an influence on the composition of RGM communities. Other biotic and abiotic factors, such as nonmycobacterial microbial flora, treatment parameters, nitrate concentrations, or total organic carbon, which often differ between surface and groundwater, may also be involved. We also observed a tendency of communities to be composed of phylogenetically related species. For example, the species of the community associated with surface water treatment plants, M. septicum, M. peregrinum, and ParisRGMnew4, all belonged to the M. fortuitum phylogenetic group.
The collection of a representative data set from all along the water distribution network (production site exits, water storage tanks, and distribution units) allowed us, for the first time, to track “vertical” changes along the distribution network. Our results demonstrate, with robust statistical support, changes in species composition along a water distribution network, as suggested by the 2000-2001 survey (44). The most notable feature was the increase of the M. chelonae prevalence index and the parallel decrease of the M. llatzerense prevalence index as water progressed along the network. This could result from the competitive exclusion of M. llatzerense by M. chelonae and/or from changes in environmental conditions (temperature and chlorine concentration, etc.) favoring the development of M. chelonae. The propagation of M. chelonae along the network may involve its particular ability to form biofilms (39, 41) and/or to resist chlorination (42). Various environmental factors influencing overall RGM presence have been described (65). We are currently studying physicochemical variables that may influence RGM species composition dynamics, and, more specifically, the adaptive success of M. chelonae, in this water distribution network.
Supplementary Material
ACKNOWLEDGMENTS
We thank Joël Pothier, Guillaume Achaz, and all the members of the Atelier de Bioinformatique de Jussieu for helpful advice on statistical analysis. We also thank Jean-François Humbert for careful reading of the manuscript.
Footnotes
Published ahead of print 8 July 2013
Supplemental material for this article may be found at http://dx.doi.org/10.1128/AEM.00900-13.
REFERENCES
- 1.Bland CS, Ireland JM, Lozano E, Alvarez ME, Primm TP. 2005. Mycobacterial ecology of the Rio Grande. Appl. Environ. Microbiol. 71:5719–5727 [DOI] [PMC free article] [PubMed] [Google Scholar]
- 2.Covert TC, Rodgers MR, Reyes AL, Stelma GN., Jr 1999. Occurrence of nontuberculous mycobacteria in environmental samples. Appl. Environ. Microbiol. 65:2492–2496 [DOI] [PMC free article] [PubMed] [Google Scholar]
- 3.Falkinham JO., III 2009. Surrounded by mycobacteria: nontuberculous mycobacteria in the human environment. J. Appl. Microbiol. 107:356–367 [DOI] [PubMed] [Google Scholar]
- 4.Lavania M, Katoch K, Parashar D, Sharma P, Das R, Chauhan DS, Sharma VD, Katoch VM. 2008. Predominance of Mycobacterium fortuitum-chelonae complex in Ghatampur field area, endemic for leprosy. Indian J. Lepr. 80:323–330 [PubMed] [Google Scholar]
- 5.Lee ES, Lee MY, Han SH, Ka JO. 2008. Occurrence and molecular differentiation of environmental mycobacteria in surface waters. J. Microbiol. Biotechnol. 18:1207–1215 [PubMed] [Google Scholar]
- 6.Parashar D, Das R, Chauhan DS, Sharma VD, Lavania M, Yadav VS, Chauhan SV, Katoch VM. 2009. Identification of environmental mycobacteria isolated from Agra, north India by conventional & molecular approaches. Indian J. Med. Res. 129:424–431 [PubMed] [Google Scholar]
- 7.Parrish SC, Myers J, Lazarus A. 2008. Nontuberculous mycobacterial pulmonary infections in non-HIV patients. Postgrad. Med. 120:78–86 [DOI] [PubMed] [Google Scholar]
- 8.Primm TP, Lucero CA, Falkinham JO., III 2004. Health impacts of environmental mycobacteria. Clin. Microbiol. Rev. 17:98–106 [DOI] [PMC free article] [PubMed] [Google Scholar]
- 9.van Ingen J, Boeree MJ, Dekhuijzen PN, van Soolingen D. 2009. Environmental sources of rapid growing nontuberculous mycobacteria causing disease in humans. Clin. Microbiol. Infect. 15:888–893 [DOI] [PubMed] [Google Scholar]
- 10.Griffith DE, Aksamit T, Brown-Elliott BA, Catanzaro A, Daley C, Gordin F, Holland SM, Horsburgh R, Huitt G, Iademarco MF, Iseman M, Olivier K, Ruoss S, von Reyn CF, Wallace RJ, Jr, Winthrop K. 2007. An official ATS/IDSA statement: diagnosis, treatment, and prevention of nontuberculous mycobacterial diseases. Am. J. Respir. Crit. Care Med. 175:367–416 [DOI] [PubMed] [Google Scholar]
- 11.Ingram CW, Tanner DC, Durack DT, Kernodle GW, Jr, Corey GR. 1993. Disseminated infection with rapidly growing mycobacteria. Clin. Infect. Dis. 16:463–471 [DOI] [PubMed] [Google Scholar]
- 12.Lai CC, Tan CK, Chou CH, Hsu HL, Liao CH, Huang YT, Yang PC, Luh KT, Hsueh PR. 2010. Increasing incidence of nontuberculous mycobacteria, Taiwan, 2000–2008. Emerg. Infect. Dis. 16:294–296 [DOI] [PMC free article] [PubMed] [Google Scholar]
- 13.Merlani GM, Francioli P. 2003. Established and emerging waterborne nosocomial infections. Curr. Opin. Infect. Dis. 16:343–347 [DOI] [PubMed] [Google Scholar]
- 14.Wallace RJ, Jr, Swenson JM, Silcox VA, Good RC, Tschen JA, Stone MS. 1983. Spectrum of disease due to rapidly growing mycobacteria. Rev. Infect. Dis. 5:657–679 [DOI] [PubMed] [Google Scholar]
- 15.Cayer MP, Veillette M, Pageau P, Hamelin R, Bergeron MJ, Meriaux A, Cormier Y, Duchaine C. 2007. Identification of mycobacteria in peat moss processing plants: application of molecular biology approaches. Can. J. Microbiol. 53:92–99 [DOI] [PubMed] [Google Scholar]
- 16.Kankya C, Muwonge A, Djonne B, Munyeme M, Opuda-Asibo J, Skjerve E, Oloya J, Edvardsen V, Johansen TB. 2011. Isolation of non-tuberculous mycobacteria from pastoral ecosystems of Uganda: public health significance. BMC Public Health 11:320. 10.1186/1471-2458-11-320 [DOI] [PMC free article] [PubMed] [Google Scholar]
- 17.Mangione EJ, Huitt G, Lenaway D, Beebe J, Bailey A, Figoski M, Rau MP, Albrecht KD, Yakrus MA. 2001. Nontuberculous mycobacterial disease following hot tub exposure. Emerg. Infect. Dis. 7:1039–1042 [DOI] [PMC free article] [PubMed] [Google Scholar]
- 18.Nakanaga K, Hoshino Y, Era Y, Matsumoto K, Kanazawa Y, Tomita A, Furuta M, Washizu M, Makino M, Ishii N. 2011. Multiple cases of cutaneous Mycobacterium massiliense infection in a “hot spa” in Japan. J. Clin. Microbiol. 49:613–617 [DOI] [PMC free article] [PubMed] [Google Scholar]
- 19.Wilson RW, Steingrube VA, Bottger EC, Springer B, Brown-Elliott BA, Vincent V, Jost KC, Jr, Zhang Y, Garcia MJ, Chiu SH, Onyi GO, Rossmoore H, Nash DR, Wallace RJ., Jr 2001. Mycobacterium immunogenum sp. nov., a novel species related to Mycobacterium abscessus and associated with clinical disease, pseudo-outbreaks and contaminated metalworking fluids: an international cooperative study on mycobacterial taxonomy. Int. J. Syst. Evol. Microbiol. 51:1751–1764 [DOI] [PubMed] [Google Scholar]
- 20.Duarte RS, Lourenco MC, de Souza Fonseca L, Leao SC, Amorim ELT, Rocha IL, Coelho FS, Viana-Niero C, Gomes KM, da Silva MG, Lorena NS, Pitombo MB, Ferreira RM, Garcia MH, de Oliveira GP, Lupi O, Vilaca BR, Serradas LR, Chebabo A, Marques EA, Teixeira LM, Dalcolmo M, Senna SG, Sampaio JL. 2009. Epidemic of postsurgical infections caused by Mycobacterium massiliense. J. Clin. Microbiol. 47:2149–2155 [DOI] [PMC free article] [PubMed] [Google Scholar]
- 21.Kim HY, Yun YJ, Park CG, Lee DH, Cho YK, Park BJ, Joo SI, Kim EC, Hur YJ, Kim BJ, Kook YH. 2007. Outbreak of Mycobacterium massiliense infection associated with intramuscular injections. J. Clin. Microbiol. 45:3127–3130 [DOI] [PMC free article] [PubMed] [Google Scholar]
- 22.Kluger N, Muller C, Gral N. 2008. Atypical mycobacteria infection following tattooing: review of an outbreak in 8 patients in a French tattoo parlor. Arch. Dermatol. 144:941–942 [DOI] [PubMed] [Google Scholar]
- 23.Munayco CV, Grijalva CG, Culqui DR, Bolarte JL, Suarez-Ognio LA, Quispe N, Calderon R, Ascencios L, Del Solar M, Salomon M, Bravo F, Gotuzzo E. 2008. Outbreak of persistent cutaneous abscesses due to Mycobacterium chelonae after mesotherapy sessions, Lima, Peru. Rev. Saude Publica 42:146–149 [DOI] [PubMed] [Google Scholar]
- 24.Murillo J, Torres J, Bofill L, Rios-Fabra A, Irausquin E, Isturiz R, Guzman M, Castro J, Rubino L, Cordido M, Venezuelan Collaborative Infectious and Tropical Diseases Study Group 2000. Skin and wound infection by rapidly growing mycobacteria: an unexpected complication of liposuction and liposculpture. Arch. Dermatol. 136:1347–1352 [DOI] [PubMed] [Google Scholar]
- 25.Winthrop KL, Abrams M, Yakrus M, Schwartz I, Ely J, Gillies D, Vugia DJ. 2002. An outbreak of mycobacterial furunculosis associated with footbaths at a nail salon. N. Engl. J. Med. 346:1366–1371 [DOI] [PubMed] [Google Scholar]
- 26.Carbonne A, Brossier F, Arnaud I, Bougmiza I, Caumes E, Meningaud JP, Dubrou S, Jarlier V, Cambau E, Astagneau P. 2009. Outbreak of nontuberculous mycobacterial subcutaneous infections related to multiple mesotherapy injections. J. Clin. Microbiol. 47:1961–1964 [DOI] [PMC free article] [PubMed] [Google Scholar]
- 27.Dailloux M, Abalain ML, Laurain C, Lebrun L, Loos-Ayav C, Lozniewski A, Maugein J. 2006. Respiratory infections associated with nontuberculous mycobacteria in non-HIV patients. Eur. Respir. J. 28:1211–1215 [DOI] [PubMed] [Google Scholar]
- 28.Dytoc MT, Honish L, Shandro C, Ting PT, Chui L, Fiorillo L, Robinson J, Fanning A, Predy G, Rennie RP. 2005. Clinical, microbiological, and epidemiological findings of an outbreak of Mycobacterium abscessus hand-and-foot disease. Diagn. Microbiol. Infect. Dis. 53:39–45 [DOI] [PubMed] [Google Scholar]
- 29.Lee WJ, Kim TW, Shur KB, Kim BJ, Kook YH, Lee JH, Park JK. 2000. Sporotrichoid dermatosis caused by Mycobacterium abscessus from a public bath. J. Dermatol. 27:264–268 [DOI] [PubMed] [Google Scholar]
- 30.Rahav G, Pitlik S, Amitai Z, Lavy A, Blech M, Keller N, Smollan G, Lewis M, Zlotkin A. 2006. An outbreak of Mycobacterium jacuzzii infection following insertion of breast implants. Clin. Infect. Dis. 43:823–830 [DOI] [PubMed] [Google Scholar]
- 31.Castillo-Rodal AI, Mazari-Hiriart M, Lloret-Sanchez LT, Sachman-Ruiz B, Vinuesa P, Lopez-Vidal Y. 2012. Potentially pathogenic nontuberculous mycobacteria found in aquatic systems. Analysis from a reclaimed water and water distribution system in Mexico City. Eur. J. Clin. Microbiol. Infect. Dis. 31:683–694 [DOI] [PubMed] [Google Scholar]
- 32.Gomila M, Ramirez A, Lalucat J. 2007. Diversity of environmental Mycobacterium isolates from hemodialysis water as shown by a multigene sequencing approach. Appl. Environ. Microbiol. 73:3787–3797 [DOI] [PMC free article] [PubMed] [Google Scholar]
- 33.Hilborn ED, Covert TC, Yakrus MA, Harris SI, Donnelly SF, Rice EW, Toney S, Bailey SA, Stelma GN., Jr 2006. Persistence of nontuberculous mycobacteria in a drinking water system after addition of filtration treatment. Appl. Environ. Microbiol. 72:5864–5869 [DOI] [PMC free article] [PubMed] [Google Scholar]
- 34.Santos R, Oliveira F, Fernandes J, Goncalves S, Macieira F, Cadete M. 2005. Detection and identification of mycobacteria in the Lisbon water distribution system. Water Sci. Technol. 52(8):177–180 [PubMed] [Google Scholar]
- 35.September SM, Brozel VS, Venter SN. 2004. Diversity of nontuberculoid Mycobacterium species in biofilms of urban and semiurban drinking water distribution systems. Appl. Environ. Microbiol. 70:7571–7573 [DOI] [PMC free article] [PubMed] [Google Scholar]
- 36.Shin JH, Lee HK, Cho EJ, Yu JY, Kang YH. 2008. Targeting the rpoB gene using nested PCR-restriction fragment length polymorphism for identification of nontuberculous mycobacteria in hospital tap water. J. Microbiol. 46:608–614 [DOI] [PubMed] [Google Scholar]
- 37.van Ingen J, Blaak H, de Beer J, de Roda Husman AM, van Soolingen D. 2010. Rapidly growing nontuberculous mycobacteria cultured from home tap and shower water. Appl. Environ. Microbiol. 76:6017–6019 [DOI] [PMC free article] [PubMed] [Google Scholar]
- 38.Tsintzou A, Vantarakis A, Pagonopoulou O, Athanassiadou A, Papapetropoulou M. 2000. Environmental mycobacteria in drinking water before and after replacement of the water distribution network. Water Air Soil Pollut. 120:273–282 [Google Scholar]
- 39.Schulze-Robbecke R, Janning B, Fischeder R. 1992. Occurrence of mycobacteria in biofilm samples. Tuber. Lung Dis. 73:141–144 [DOI] [PubMed] [Google Scholar]
- 40.Torvinen E, Suomalainen S, Lehtola MJ, Miettinen IT, Zacheus O, Paulin L, Katila ML, Martikainen PJ. 2004. Mycobacteria in water and loose deposits of drinking water distribution systems in Finland. Appl. Environ. Microbiol. 70:1973–1981 [DOI] [PMC free article] [PubMed] [Google Scholar]
- 41.Williams MM, Yakrus MA, Arduino MJ, Cooksey RC, Crane CB, Banerjee SN, Hilborn ED, Donlan RM. 2009. Structural analysis of biofilm formation by rapidly and slowly growing nontuberculous mycobacteria. Appl. Environ. Microbiol. 75:2091–2098 [DOI] [PMC free article] [PubMed] [Google Scholar]
- 42.Le Dantec C, Duguet JP, Montiel A, Dumoutier N, Dubrou S, Vincent V. 2002. Chlorine disinfection of atypical mycobacteria isolated from a water distribution system. Appl. Environ. Microbiol. 68:1025–1032 [DOI] [PMC free article] [PubMed] [Google Scholar]
- 43.Schwartz T, Hoffmann S, Obst U. 2003. Formation of natural biofilms during chlorine dioxide and u.v. disinfection in a public drinking water distribution system. J. Appl. Microbiol. 95:591–601 [DOI] [PubMed] [Google Scholar]
- 44.Le Dantec C, Duguet JP, Montiel A, Dumoutier N, Dubrou S, Vincent V. 2002. Occurrence of mycobacteria in water treatment lines and in water distribution systems. Appl. Environ. Microbiol. 68:5318–5325 [DOI] [PMC free article] [PubMed] [Google Scholar]
- 45.Adekambi T, Drancourt M. 2004. Dissection of phylogenetic relationships among 19 rapidly growing Mycobacterium species by 16S rRNA, hsp65, sodA, recA and rpoB gene sequencing. Int. J. Syst. Evol. Microbiol. 54:2095–2105 [DOI] [PubMed] [Google Scholar]
- 46.Adekambi T, Shinnick TM, Raoult D, Drancourt M. 2008. Complete rpoB gene sequencing as a suitable supplement to DNA-DNA hybridization for bacterial species and genus delineation. Int. J. Syst. Evol. Microbiol. 58:1807–1814 [DOI] [PubMed] [Google Scholar]
- 47.Macheras E, Roux AL, Bastian S, Leao SC, Palaci M, Sivadon-Tardy V, Gutierrez C, Richter E, Rusch-Gerdes S, Pfyffer G, Bodmer T, Cambau E, Gaillard JL, Heym B. 2011. Multilocus sequence analysis and rpoB sequencing of Mycobacterium abscessus (sensu lato) strains. J. Clin. Microbiol. 49:491–499 [DOI] [PMC free article] [PubMed] [Google Scholar]
- 48.Adekambi T, Berger P, Raoult D, Drancourt M. 2006. rpoB gene sequence-based characterization of emerging non-tuberculous mycobacteria with descriptions of Mycobacterium bolletii sp. nov., Mycobacterium phocaicum sp. nov. and Mycobacterium aubagnense sp. nov. Int. J. Syst. Evol. Microbiol. 56:133–143 [DOI] [PubMed] [Google Scholar]
- 49.Adekambi T, Colson P, Drancourt M. 2003. rpoB-based identification of nonpigmented and late-pigmenting rapidly growing mycobacteria. J. Clin. Microbiol. 41:5699–5708 [DOI] [PMC free article] [PubMed] [Google Scholar]
- 50.Adekambi T, Reynaud-Gaubert M, Greub G, Gevaudan MJ, La Scola B, Raoult D, Drancourt M. 2004. Amoebal coculture of “Mycobacterium massiliense” sp. nov. from the sputum of a patient with hemoptoic pneumonia. J. Clin. Microbiol. 42:5493–5501 [DOI] [PMC free article] [PubMed] [Google Scholar]
- 51.Dereeper A, Guignon V, Blanc G, Audic S, Buffet S, Chevenet F, Dufayard JF, Guindon S, Lefort V, Lescot M, Claverie JM, Gascuel O. 2008. Phylogeny.fr: robust phylogenetic analysis for the non-specialist. Nucleic Acids Res. 36:W465–W469. 10.1093/nar/gkn180 [DOI] [PMC free article] [PubMed] [Google Scholar]
- 52.Edgar RC. 2004. MUSCLE: a multiple sequence alignment method with reduced time and space complexity. BMC Bioinformatics 5:113. 10.1186/1471-2105-5-113 [DOI] [PMC free article] [PubMed] [Google Scholar]
- 53.Bolker BM, Brooks ME, Clark CJ, Geange SW, Poulsen JR, Stevens MH, White JS. 2009. Generalized linear mixed models: a practical guide for ecology and evolution. Trends Ecol. Evol. 24(3):127–135 [DOI] [PubMed] [Google Scholar]
- 54.Ihaka R, Gentleman R. 1996. R: a language for data analysis and graphics. J. Comput. Graph. Stat. 5:299–314 [Google Scholar]
- 55.Ripley BD. 2002. Modern applied statistics with S. Springer, New York, NY [Google Scholar]
- 56.Pinheiro JC, Bates DM. 2000. Mixed effects models in S and S-PLUS. Springer-Verlag, New York, NY [Google Scholar]
- 57.Suzuki R, Shimodaira H. 2006. Pvclust: an R package for assessing the uncertainty in hierarchical clustering. Bioinformatics 22:1540–1542 [DOI] [PubMed] [Google Scholar]
- 58.Beh EJ. 2012. Exploratory multivariate analysis by example using R. J. Appl. Stat. 39:1381–1382 [Google Scholar]
- 59.Vaerewijck MJ, Huys G, Palomino JC, Swings J, Portaels F. 2005. Mycobacteria in drinking water distribution systems: ecology and significance for human health. FEMS Microbiol. Rev. 29:911–934 [DOI] [PubMed] [Google Scholar]
- 60.Falkinham JO, III, Norton CD, LeChevallier MW. 2001. Factors influencing numbers of Mycobacterium avium, Mycobacterium intracellulare, and other mycobacteria in drinking water distribution systems. Appl. Environ. Microbiol. 67:1225–1231 [DOI] [PMC free article] [PubMed] [Google Scholar]
- 61.Tortoli E. 2006. The new mycobacteria: an update. FEMS Immunol. Med. Microbiol. 48:159–178 [DOI] [PubMed] [Google Scholar]
- 62.Gomila M, Ramirez A, Gasco J, Lalucat J. 2008. Mycobacterium llatzerense sp. nov., a facultatively autotrophic, hydrogen-oxidizing bacterium isolated from haemodialysis water. Int. J. Syst. Evol. Microbiol. 58:2769–2773 [DOI] [PubMed] [Google Scholar]
- 63.Whipps CM, Butler WR, Pourahmad F, Watral VG, Kent ML. 2007. Molecular systematics support the revival of Mycobacterium salmoniphilum (ex Ross 1960) sp. nov., nom. rev., a species closely related to Mycobacterium chelonae. Int. J. Syst. Evol. Microbiol. 57:2525–2531 [DOI] [PubMed] [Google Scholar]
- 64.Kormas KA, Neofitou C, Pachiadaki M, Koufostathi E. 2010. Changes of the bacterial assemblages throughout an urban drinking water distribution system. Environ. Monit. Assess. 165:27–38 [DOI] [PubMed] [Google Scholar]
- 65.Jacobs J, Rhodes M, Sturgis B, Wood B. 2009. Influence of environmental gradients on the abundance and distribution of Mycobacterium spp. in a coastal lagoon estuary. Appl. Environ. Microbiol. 75:7378–7384 [DOI] [PMC free article] [PubMed] [Google Scholar]
Associated Data
This section collects any data citations, data availability statements, or supplementary materials included in this article.