

Abstract
In the present work, simulated cocoa fermentation was investigated at the level of metabolic pathway fluxes (fluxome) of lactic acid bacteria (LAB), which are typically found in the microbial consortium known to convert nutrients from the cocoa pulp into organic acids. A comprehensive 13C labeling approach allowed to quantify carbon fluxes during simulated cocoa fermentation by (i) parallel 13C studies with [13C6]glucose, [1,2-13C2]glucose, and [13C6]fructose, respectively, (ii) gas chromatography-mass spectrometry (GC/MS) analysis of secreted acetate and lactate, (iii) stoichiometric profiling, and (iv) isotopomer modeling for flux calculation. The study of several strains of L. fermentum and L. plantarum revealed major differences in their fluxes. The L. fermentum strains channeled only a small amount (4 to 6%) of fructose into central metabolism, i.e., the phosphoketolase pathway, whereas only L. fermentum NCC 575 used fructose to form mannitol. In contrast, L. plantarum strains exhibited a high glycolytic flux. All strains differed in acetate flux, which originated from fractions of citrate (25 to 80%) and corresponding amounts of glucose and fructose. Subsequent, metafluxome studies with consortia of different L. fermentum and L. plantarum strains indicated a dominant (96%) contribution of L. fermentum NCC 575 to the overall flux in the microbial community, a scenario that was not observed for the other strains. This highlights the idea that individual LAB strains vary in their metabolic contribution to the overall fermentation process and opens up new routes toward streamlined starter cultures. L. fermentum NCC 575 might be one candidate due to its superior performance in flux activity.
INTRODUCTION
The worldwide annual production of cocoa beans has reached 4.4 million metric tons (1 [http://faostat3.fao.org/home/index.html#DOWNLOAD; selection: production > crops > regions: world {total} > elements: production {tonnes} > items: cocoa beans > years: 2011]). The process of chocolate preprocessing involves pod opening, bean (pulp) fermentation, and bean drying, followed by roasting of the cocoa beans (2). A critical step determining the cocoa bean quality is the fermentation of the fresh cocoa pulp, whose main functions are acetic acid- and heat-induced death of the cocoa bean, reduction in bitterness, and formation of valuable aroma precursors (3). Cocoa bean fermentation is a spontaneous process that is carried out under rather uncontrolled conditions. Thus, the result of the fermentation process strongly depends on the microbial population of the pulp and postharvest practices on the farm (4). It was shown recently that lactic acid bacteria (LAB) play a prominent role in the microbial community of cocoa pulp fermentation, as their metabolic contribution is a key to the success of the fermentation process (5, 6). The primary routes of carbon metabolism by lactobacilli are summarized in Fig. 1. The LAB convert carbohydrates, i.e., fructose and glucose, and citrate, contained in the pulp, into lactate, acetate, ethanol, and mannitol. Thereby, citrate depletion leads to an increase in pH, which improves conditions for growth of acetic acid bacteria (AAB) and yeast, also contributing to the overall fermentation process (2, 6). Additionally, lactate and mannitol, which are produced by LAB as major products, serve as substrates for the acetate-producing AAB (6, 7). Species diversity and community dynamics during on-farm fermentation of cocoa beans have been studied by applying 16S rRNA hybridization and microbial counting (4, 8–12). Among the LAB, the most dominant species in cocoa pulp fermentation are Lactobacillus fermentum and Lactobacillus plantarum (3, 10). While L. fermentum is an obligate heterofermentative LAB species that produces lactate, acetate, and other metabolites via the phosphoketolase (PPK) pathway, L. plantarum is classified as a facultative heterofermentative LAB producing predominantly lactate via the Embden-Meyerhof-Parnas pathway (EMP pathway) (Fig. 1) (13, 14). Due to their different metabolism, the extent to which a particular species dominates the community is essential for the quality of fermented cocoa. Recently, the diverse metabolic performance of monocultures of individual LAB strains in a cocoa pulp simulation medium (PSM) has been described, and their potential functional role has been discussed (7). Based on further studies with pure cultures, it has been argued that cocoa-specific L. fermentum strains were best adapted to cocoa pulp (6). However, it remains unclear how individual strains succeed in such a complex ecosystem and how they specifically contribute to the overall metabolite profile of fermented cocoa pulp. Even if subpopulations are enumerated, the cell number of individual species cannot directly be correlated with their metabolic activity, because viable cells may be less metabolically inactive than others (15). In this regard, a straightforward approach for elucidating the metabolic interactions between individual species is 13C-based metabolic flux analysis. This technique is routine for pure cultures in defined media and has contributed greatly to our knowledge of microbial physiology and biochemistry (16–19). However, more complex environments or consortia of different species usually cannot be analyzed by this method.
Fig 1.
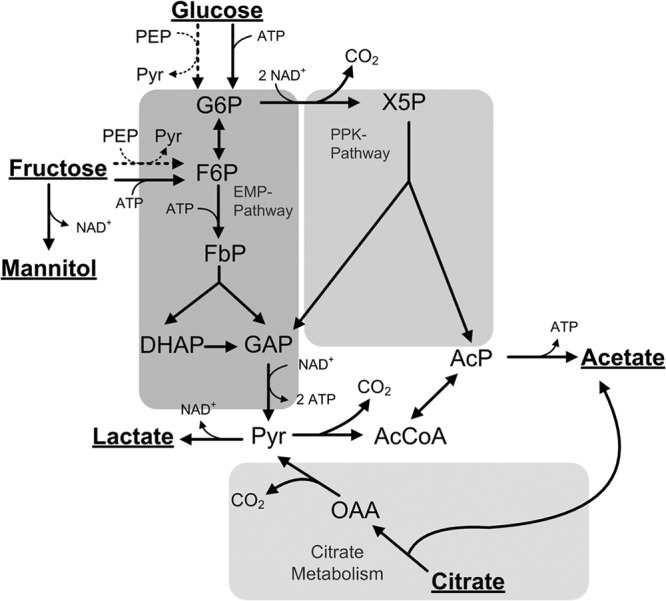
General metabolic network of the central carbon metabolism of lactobacilli. Extracellular substrates and products are underlined. G6P, glucose 6-phosphate; F6P, fructose 6-phosphate; FbP, fructose 1:6-bisphosphate; DHAP, dihydroxyacetone phosphate; GAP, glyceraldehyde 3-phosphate; Pyr, pyruvate; AcP, acetylphosphate; AcCoA, acetyl-CoA; OAA, oxaloacetate; X5P, xylulose 5-phosphate. As major metabolic routes, the Embden-Meyerhof-Parnas pathway (EMP), the phosphoketolase pathway (PPK), and citrate metabolism are considered. The different transport systems for glucose and fructose uptake by L. plantarum (dashed arrows) and L. fermentum (solid arrows) are also considered. To facilitate flux calculation, it is assumed that in either case fructose enters the EMP pathway at the level of fructose 6-phosphate.
In this work, we applied metabolic flux analysis to the study of LAB strains in the complex system of cocoa pulp fermentation under laboratory conditions. In order to resolve individual pathway fluxes from multiple substrates and for consortia of microorganisms, a novel flux approach on the basis of parallel 13C labeling studies was designed. For the first time, this provided molecular insights into the individual metabolic performance of selected LAB under the conditions of cocoa fermentation, as well as flux profiles of multispecies cocultures. This may be useful for a better understanding of the cocoa fermentation process, as well as for the selection of appropriate starter cultures (6, 12, 20).
MATERIALS AND METHODS
Strains.
Strains of Lactobacillus plantarum (NCC 245, NCC 1295, NCC 2829, and NCC 2936) and Lactobacillus fermentum (NCC 504, NCC 515, NCC 528, NCC 575, and NCC 592) were obtained from the Nestlé Culture Collection (Lausanne, Switzerland).
Media.
The microorganisms were maintained at −80°C in lactobacillus MRS (deMan-Rogosa-Sharpe) broth (21) which was supplemented with 15% (vol/vol) glycerol. Lactobacillus MRS broth was also used for precultures. Main cultivation was then performed in cocoa pulp simulation medium for lactic acid bacteria (PSM-LAB) (7), which contained 27.5 g liter−1 glucose monohydrate (Roth, Karlsruhe, Germany), 25 g liter−1 fructose (Merck, Darmstadt, Germany), 10 g liter−1 citric acid (Sigma-Aldrich, Taufkirchen, Germany), 5 g liter−1 yeast extract (Roth), 5 g liter−1 soy peptone (Roth), 0.5 g liter−1 magnesium sulfate-heptahydrate (Merck), 0.2 g liter−1 manganese sulfate-monohydrate (Sigma-Aldrich), and 1 ml liter−1 Tween 80 (Sigma-Aldrich). The initial pH of the medium was 3.8. In 13C tracer experiments, glucose or fructose was replaced by an equimolar amount of 99% [13C6]glucose (Sigma-Aldrich), 99% [1,2-13C2]glucose (Cambridge Isotopes, Andover, MA), or 99% [13C6]fructose (Sigma-Aldrich), respectively. For differentiation of L. fermentum and L. plantarum, lactic bacterium differential (LBD) agar was used (17).
Cultivations.
For all experiments, frozen stocks were used to inoculate the first preculture (37°C, 24 h). Cells were then transferred to the second preculture to an initial optical density at 600 nm (OD600) of 0.01, which was incubated at 37°C for 10 to 24 h depending on the individual organism. Cells were harvested in the mid-exponential growth phase, washed twice with 0.9% NaCl solution (7,500 × g, 5 min; 4°C), and used to inoculate the main culture to an initial OD600 of 0.05. For fluxome profiling of individual strains, L. plantarum NCC 2829, L. plantarum NCC 1295, L. fermentum NCC 575, and L. fermentum NCC 528 were cultivated as pure cultures. Additionally, mixed cultures were performed, such that one strain of a species (e.g., L. fermentum) was cocultivated with four different strains of the other species (e.g., L. plantarum). Detailed information on the composition of the mixed cultures is given in Table 1. In cultivations with consortia of LAB, all organism was used at equal inocula such that the total initial OD600 was 0.05. All cultivation steps were performed in baffled shake flaks on a rotary shaker at 50 rpm (shaking diameter, 10 cm; Certomat IS; Sartorius, Göttingen, Germany).
Table 1.
Mixed cultures of lactic acid bacteria used in metafluxome studiesa
| Labeling study | Strains |
|---|---|
| LF575 | L. fermentum NCC 575, with four strains of L. plantarum (NCC 1295, NCC 2829, NCC 245, 2936) |
| LF528 | L. fermentum NCC 528, with four strains of L. plantarum (NCC 1295, NCC 2829, NCC 245, 2936) |
| LP2829 | L. plantarum NCC 2829, with four strains of L. fermentum (NCC 528, NCC 504, NCC 515, NCC 592) |
| LP1295 | L. plantarum NCC 1295, with four strains of L. fermentum (NCC 528, NCC 504, NCC 515, NCC 592) |
All bacteria were inoculated at the same initial OD.
Quantification of substrates and products.
The concentrations of glucose, fructose, and mannitol in culture supernatant were determined by high-performance liquid chromatography (HPLC) (Elite-LaChrom; Hitachi, West Chester, PA), equipped with a refractive index detector. A Metacarb 87C column (300 by 7.8 mm; Varian, Palo Alto, CA) was used as the stationary phase and deionized water as the mobile phase at 0.6 ml min−1 and 85°C. Organic acids (citrate, lactate, acetate, formate, propionate, butyrate, pyruvate, and α-ketoglutarate) and ethanol were separated by HPLC (Elite-LaChrom,) using an Aminex HPX-87H column (300 by 7.8 mm; Bio-Rad, Hercules, CA) as the stationary phase and 12.5 mM H2SO4 as the mobile phase at a flow rate of 0.5 ml min−1 and a column temperature of 45°C. Quantification was carried out via a refractive index detector. Additionally, a UV detector (210 nm) was used for identification of the analytes. To test for catabolic breakdown of amino acids, the ammonium concentration was analyzed by HPLC on a chromatograph (ICS-2000; Thermo Scientific, Sunnyvale, CA) equipped with an Ion Pac CS16 column (250 by 3 mm; Thermo Scientific) with 3 mM methanesulfonic acid (Thermo Scientific) as the eluent (40°C, 0.5 ml min−1). All samples were diluted 1:10 prior to analysis. Standards for calibration were supplied by Sigma-Aldrich and were of HPLC grade. Lactate, acetate, formate, butyrate, and propionate were calibrated using their sodium salts, and ammonium was calibrated as ammonium sulfate.
Cell growth was monitored as OD600 (Libra S11; Biochrome, Cambridge, United Kingdom). For calibration, cell dry weight (CDW) was also determined gravimetrically after centrifugation (9,800 × g, 10 min, 5°C), washing with a 0.9% NaCl solution, and subsequent drying (80°C, 48 h). The mean correlation factor between OD and CDW of three strains (NCC 528, NCC 575, and NCC 2829; three biological replicates each) was as follows: CDW = 0.254 × OD600 (g liter−1).
GC/MS analysis of 13C labeling pattern of lactate and acetate.
For quantification of the mass isotopomer distribution of lactate, 5 μl of culture supernatant was dried under a nitrogen stream, subsequently resuspended in 50 μl dimethyl formamide (0.1% pyridine), and derivatized with 50 μl N-methyl-N-t-butyldimethylsilyl-trifluoroacetamide (MBDSTFA) (Macherey-Nagel, Düren, Germany). It was then analyzed by gas chromatography-mass spectrometry (GC/MS) (7890A with 5975C quadrupole detector; Agilent Technologies, Santa Clara, CA) as described previously (22), except that a modified temperature profile (80°C for 2 min; ramp, 15°C min−1; final temperature, 325°C) was applied. Selected ion monitoring (SIM) was performed from m/z 261 to 264 to quantify the mass isotopomer fractions m+0, m+1, m+2, and m+3 of a fragment ion that contained all carbon atoms of lactate.
The labeling pattern of acetate was determined by GC/MS (7890A with a 7000B triple quadrupole detector; Agilent Technologies) after derivatization with N-pentanol (Sigma-Aldrich) and subsequent extraction with N-hexane (Carlo Erba Reagents, Val de Reuil, France). For this, 50 μl of culture supernatant was mixed with 100 μl H2SO4 (10% vol/vol) and 20 μl N-pentanol, incubated at 80°C for 15 min, subsequently cooled to 5°C, and extracted with 200 μl N-hexane. The oven program was as follows: 75°C for 2 min; ramp, 25°C min−1; final temperature, 300°C. Samples were analyzed in SIM mode at m/z 43 to 45 to obtain the mass isotopomer fractions m+0, m+1, and m+2 of a fragment ion that contained both carbon atoms of acetate. For method validation, 0.5% (w/vol) solutions of naturally labeled sodium lactate, sodium [13C3]l-lactate (20% [wt/wt] in water, 98% isotopic purity; Cambridge Isotopes), naturally labeled sodium acetate, and [13C2]acetic acid (99% isotopic purity; Cambridge Isotopes) were treated as described above, and the respective ion clusters were evaluated. Experimental mass isotopomer data were corrected for the natural occurrence of isotopes in the derivatization residue and in noncarbon atoms (23).
Metabolic network.
A generalized metabolic network comprising the major pathways of central carbon metabolism of lactobacilli (Fig. 1) was reconstructed from the genome data of L. plantarum (24) and L. fermentum (14). The network included homofermentative (EMP) and heterofermentative (PPK) metabolism. Citrate catabolism was found in L. plantarum (25, 26) and L. fermentum (7, 26) and was considered in the manner described previously (27). Mannitol formation from fructose by heterofermentative LAB (28, 29) was also considered. It was further assumed that fructose is phosphorylated to fructose 6-phosphate by a fructokinase (28). Since fructose 6-phosphate may subsequently enter the glycolysis or PPK pathway, the glucose 6-phosphate isomerase reaction was treated as a bidirectional reaction. In L. plantarum, fructose may be phosphorylated by either a fructokinase or a phosphoenol pyruvate (PEP)-dependent phosphotransferase system which forms fructose 1-phosphate (24). However, this did not affect the obtained flux calculation, and it was thus assumed that fructose enters the EMP pathway as fructose 6-phosphate. The tricarboxylic acid (TCA) cycle and gluconeogenesis are known to be nonfunctional in most lactic acid bacteria, including L. plantarum and L. fermentum (30, 31) (www.genome.jp) and were thus not considered in the model. The pentose phosphate pathway is also nonfunctional in L. fermentum (lack of transketolase and transaldolase) (www.genome.jp) and was found to be inactive in L. plantarum (32). Furthermore, preliminary simulations revealed no significant differences in the flux profile of L. plantarum when the pentose phosphate pathway was considered in the metabolic model. For these reasons, it was neglected in this study. Since no evidence of formation of ethanol, acetoin, diacetyl, 2,3-butanediol, or formate was found in this study, corresponding reactions were omitted from the network. Lactobacilli are adapted to nutrient-rich environments and exhibit auxotrophic behavior for most amino acids, vitamins, and nucleotides. For this reason, it is generally assumed that those components need to be supplied exogenously and the carbon core metabolism can be regarded separately from anabolism (33). Thus, in the present study, it was assumed that the drain of precursors from catabolic pathways toward biomass is very low, and it was thus neglected.
Estimation of metabolic fluxes.
The complex environment of pulp fermentation medium with multiple substrates required parallel isotope experiments that had to be integrated to enable metabolic flux estimation. For this purpose, a software tool that estimated the metabolic flux distribution from parallel labeling experiments (Fig. 2) was designed and implemented. The basic framework for metabolic flux estimation was implemented in Matlab 7.11.1 (Mathworks, Natick, MA). The tool first imported the metabolic network together with experimental data from a spreadsheet file (Excel 97-2003; Microsoft, Redmond, WA) and then automatically created the corresponding stoichiometric and isotopomer models for subsequent metabolic flux analysis. The null space of the network, i.e., the set of free fluxes (vfree) that were varied during the optimization, was computed using Gauss-Jordan elimination. The dependent fluxes could then be calculated from the known and the estimated free fluxes. Additionally, it included the option to define measured fluxes (vfit) to also be fitted by the optimization routine. The isotopomer network was constructed at a given labeling of the input substrates by using isotopomer mapping matrices (34, 35) that were generated automatically from the information on carbon transition. As basis of this calculation, carbon transition matrices corresponding to each reaction and metabolite were provided in a separate file. The isotopomer balances were then solved using a trust region dogleg algorithm (Matlab function, fsolve). For fast and robust convergence of the nonlinear system, the analytical Jacobian was additionally computed (36). The mass isotopomer distribution vector (MDV) of the metabolite of interest was then calculated from the isotopomer distribution vector (IDV). Parameters were estimated by nonlinear constrained optimization using the Matlab function fmincon (interior-point method algorithm), such that the weighted sum of least squares was minimized:
| (1) |
Fig 2.

Labeling strategy to elucidate metabolic fluxes in pure and mixed cultures of lactic acid bacteria in cocoa pulp simulation medium using specifically enriched isotopic tracer substances and mass spectral labeling analysis of the extracellular products acetate (Ac) and lactate (Lac). (A) Theoretical 13C mass isotopomer distribution of lactate and acetate depending on the metabolic route of [1,2-13C2]glucose utilization. In addition to the Embden-Meyerhof-Parnas pathway (EMP), and phosphoketolase (PPK) pathways, decarboxylation of pyruvate to acetate is considered (asterisk). (B and C) Convergence of different pathways (glucose, fructose, and citrate consumption) results in specific 13C labeling pattern of lactate. Pathway fluxes can be elucidated by alternately labeling glucose (B) or fructose (C). Black circles indicate 13C atoms, and white circles represent unlabeled carbon (12C).
The vector ε = [εx εv]T contains the errors between simulated and experimental data of isotopomer distribution and (measured) fluxes vfit, considering the whole set of experiments. W is a diagonal matrix whose elements are the inverse of the experimental variances. Sm denotes the stoichiometric matrix, and v is the metabolic flux vector. To fit the model for a set of n experiments, the mass isotopomer distributions had to be simulated n times at each iteration step. Hence, for short simulation times, the Parallel Computing Toolbox of Matlab (Mathworks, Natick, MA) was used. As the metabolic network was underdetermined by the known fluxes, the experimentally measured fluxes and the labeling data of lactate were used to fit the free fluxes. Additionally, the fluxes of fructose and citrate uptake and the production rate of acetate were fitted. Due to the strong correlation between fructose uptake and mannitol formation, the mannitol production rate was fixed during the optimization routine. Furthermore, the lactate production rate was excluded in the fitting procedure to avoid singularity of the null space of Sm (in this case, the network can have an infinite set of solutions at a given vector vfit). Statistical validation was performed by using a Monte Carlo approach (37). Therefore, random, normal-distributed noise was added to experimental data according to their observed standard deviations. Subsequently, 90% confidence intervals were calculated from flux distributions obtained by 200 individual parameter estimations.
RESULTS
Strategy for elucidation of metabolic fluxes in homofermentative and heterofermentative lactic acid bacteria.
Due to the extraordinary behavior of lactobacilli in their carbon metabolism, the strategy was developed such that the pathway information of interest can be obtained from the labeling pattern of the major end products, lactate and acetate. First, the metabolic network was analyzed for potential labeling configurations of the substrates (glucose, fructose, and citrate). From a wide range of computational simulation studies, excellent resolution of metabolic fluxes was obtained by using a combination of [1,2-13C2]glucose, [13C6]glucose, and [13C6]fructose as input tracer substrates. The split point between the glycolysis and the PPK pathway could be resolved by [1,2-13C2]glucose (Fig. 2B). Due to the presence of other substrates, the contribution of glucose to lactate formation still had to be determined. This was achieved by using a mixture of [13C6]glucose, [12C6]fructose, and [12C6]citrate in a separate labeling experiment, which is illustrated in Fig. 2B. The complete flux pattern could be resolved by a set of labeling experiments in which glucose or fructose was replaced by its labeled variant.
Quantification of labeling profiles of lactate and acetate.
As deduced from the computational design, the labeling patterns of acetate and lactate had to be precisely quantified as major input for the flux estimation. For this purpose, GC/MS was used (Fig. 3). First, accuracy of the GC/MS measurement was checked by analyzing standard solutions of the naturally labeled and universally 13C-enriched compounds. The resulting mass isotopomer distributions perfectly matched the theoretical values, which were derived from the natural isotope abundance (38) and a 99% 13C positional enrichment in labeled acetate or lactate (Table 2). The standard deviations of experimental mass isotopomer abundances were on the order of 10−4. The abundance of the individual mass isotopomer fractions in the [12C3]lactate and [13C3]lactate molecules almost perfectly matched the theoretical distribution. The experimental mass isotopomer abundances of [12C2]acetate also agreed excellently with the calculated ones. The measured and calculated isotopomer distribution for [13C2]acetate differed slightly more but was sufficiently informative to derive pathway information. To investigate whether the GC/MS signals of TBDMS2-lactate (tert-butyldimethylsilyl derivate of lactate) and acetic acid (pentyl ester) were affected by isobaric overlay from the complex sample matrix, the supernatant of an unlabeled culture was additionally analyzed. The resulting labeling patterns (Table 2) agreed with the mass isotopomer distributions of the unlabeled standard solutions. Hence, this method was appropriate to investigate the labeling patterns of lactate and acetate in the complex samples from cocoa pulp simulation medium.
Fig 3.
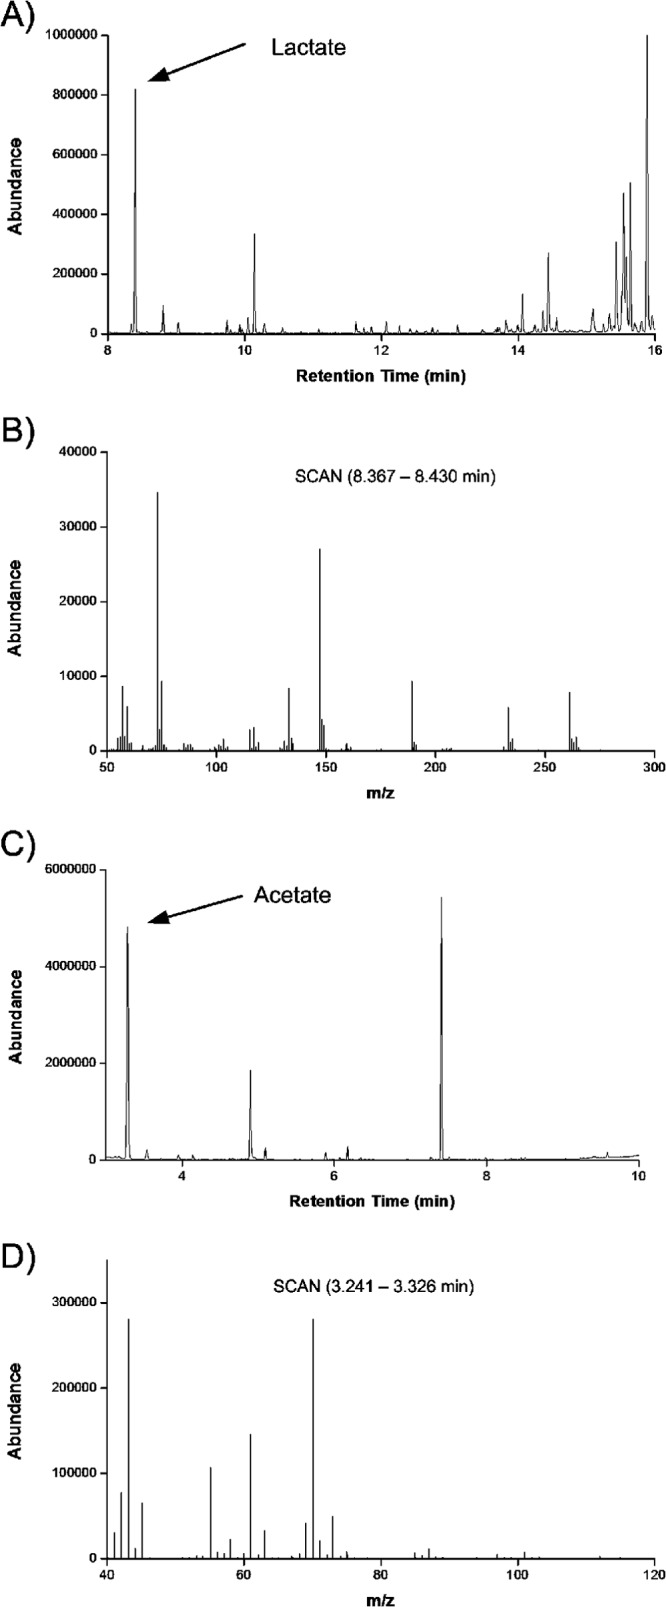
GC/MS analysis of 13C patterns of lactate and acetate in culture supernatant. (A) Total ion current of the sample after derivatization with N-methyl-N-t-butyldimethylsilyl-trifluoroacetamide (MBDSTFA), with lactate eluting after 8.35 min; (B) corresponding mass spectrum of TBDMS2-lactate; (C) total ion current of the sample after derivatization with N-pentanol, with acetate eluting after 3.25 min; (D) corresponding mass spectrum of acetic acid (pentyl ester).
Table 2.
Mass isotopomer distribution of labeled and unlabeled lactate and acetate determined by GC/MSa
| Analyte | Mass isotopomer fraction | Source | Mass isotopomer distribution |
||
|---|---|---|---|---|---|
| Unlabeled standard | Labeled standard | Unlabeled sample | |||
| Lactateb | m+0 | Exp. | 0.754 ± 0.001 | 0.003 ± 0.001 | 0.752 ± 0.005 |
| Calc. | 0.757 | 0.000 | 0.757 | ||
| m+1 | Exp. | 0.165 ± 0.000 | 0.004 ± 0.000 | 0.165 ± 0.002 | |
| Calc. | 0.171 | 0.000 | 0.171 | ||
| m+2 | Exp. | 0.071 ± 0.000 | 0.039 ± 0.000 | 0.068 ± 0.001 | |
| Calc. | 0.072 | 0.029 | 0.072 | ||
| m+3 | Exp. | 0.011 ± 0.000 | 0.955 ± 0.001 | 0.014 ± 0.002 | |
| Calc. | 0.011 | 0.970 | 0.011 | ||
| Acetatec | m+0 | Exp. | 0.960 ± 0.005 | 0.067 ± 0.009 | 0.958 ± 0.001 |
| Calc. | 0.976 | 0.000 | 0.976 | ||
| m+1 | Exp. | 0.029 ± 0.001 | 0.044 ± 0.006 | 0.031 ± 0.001 | |
| Calc. | 0.022 | 0.012 | 0.022 | ||
| m+2 | Exp. | 0.012 ± 0.000 | 0.889 ± 0.015 | 0.011 ± 0.000 | |
| Calc. | 0.002 | 0.980 | 0.002 | ||
The data comprise experimental values (exp.) and theoretical mass isotopomer distributions (calc.) derived from natural isotopic enrichment in unlabeled substances (38) and a 99% 13C enrichment in the labeled compounds.
[M-57] fragment of TBDMS2-lactate.
[M-87] fragment of acetic acid (pentyl ester).
Fermentation dynamics of pure L. fermentum cultures in cocoa pulp simulation medium.
L. fermentum NCC 575 showed the best performance on cocoa pulp simulation medium with respect to growth rate and substrate uptake (Fig. 4A). During the first growth phase, glucose, fructose, and citrate were consumed simultaneously, linked to a growth rate of approximately 0.3 h−1. After depletion of citrate (24 h), only weak growth was supported by glucose and fructose. Overall, lactate and acetate were produced in almost equimolar amounts. Additionally, significant amounts of mannitol were produced. Starting from an initial pH of 3.8, the pH decreased slightly throughout the experiment and reached a final value of 3.7. The concentration of ammonium was in the range of 3.1 ± 0.2 mM during the cultivation, indicating that no significant catabolic breakdown of amino acids took place. A final CDW of 1.96 g liter−1 was obtained after 46 h of cultivation, while glucose and fructose remained in the medium. In contrast, the cocoa pulp simulation medium supported only little growth of the other L. fermentum strain, NCC 528 (Fig. 4B). A maximum cell concentration of 0.23 g liter−1 and a final pH of 3.9 were reached after 12 h of fermentation. Although citrate was initially metabolized, its consumption stopped after 22 h of cultivation. The main products were acetate and lactate, which were produced at a ratio of 2:1. Formation of mannitol and consumption of glucose or fructose were not detected. The ammonium concentration was 2.6 ± 0.2 mM and did not change significantly during the experiment.
Fig 4.

Fermentation profiles of L. fermentum NCC 575 (A), L. fermentum NCC 528 (B), L. plantarum NCC 2829 (C), and L. plantarum NCC 1295 (D) in cocoa pulp simulation medium. The data are means from two replicates and their corresponding standard deviations. Glc, glucose; Frc, fructose; Man, mannitol; Cit, citrate; Lac, lactate; Ac, acetate; CDW, cell dry weight.
Fermentation dynamics of pure L. plantarum cultures in cocoa pulp simulation medium.
Similar fermentation profiles in the simulated pulp were observed for L. plantarum NCC 2829 and L. plantarum NCC 1295. Both strains seemed to coconsume glucose and fructose. However, a low consumption of glucose by L. plantarum NCC 2829 was found, whereas fructose consumption was more dominant (Fig. 4C). Furthermore, citrate was slightly metabolized by L. plantarum NCC 2829, whereas L. plantarum NCC 1295 did not consume this energy source. None of the substrates was completely exhausted at the end of cultivation. The main product was lactate (100 to 116 mM). Additionally, small amounts of acetate (8 to 16 mM) were detected. Mannitol formation was not observed. In the case of L. plantarum NCC 2829, the maximum cell concentration of 0.75 g liter−1 was reached after 50 h of cultivation. L. plantarum NCC 1295 reached a final cell mass of 0.74 g liter−1 after 45 h. For both microorganisms, growth was linear rather than exponential. Throughout the cultivations, the pH decreased from 3.8 to 3.4, and the ammonium concentration was at an average of 2.9 ± 0.3 mM.
Evaluation of the flux approach for simulated cocoa pulp experiments.
It was interesting to see how the obviously different metabolic properties were reflected by the intracellular distribution of fluxes. For this purpose, metabolic fluxes of pure cultures of the lactic acid bacteria L. fermentum NCC 575, L. fermentum NCC 528, L. plantarum NCC 2829, and L. plantarum NCC 1295 were estimated based on metabolite (Table 3) and isotopomer (see Tables S1 to S4 in the supplemental material) balancing, applying the strategy described above. The obtained metabolic flux distributions are presented in Fig. 5. Small 90% confidence intervals indicated the precision of the estimated flux distributions. As can be seen in Tables S1 to S4 in the supplemental material, excellent agreement between the simulated and measured mass isotopomer distributions of lactate and acetate was obtained. The relative errors were typically lower than 5%, which further underlined the consistency of the estimated fluxes.
Table 3.
Extracellular fluxes and carbon recovery
| Strain (culture type) | Extracellular flux (mmol [100 mmol of glucose]−1)a |
Carbon recoveryb (%) | ||||
|---|---|---|---|---|---|---|
| Fructose | Citrate | Lactate | Acetate | Mannitol | ||
| L. fermentum NCC 575 (pure) | −137 ± 2 | −87 ± 9 | 143 ± 12 | 177 ± 8 | 129 ± 7 | 90.3 ± 0.3 |
| L. fermentum NCC 528 (pure)c | 100 | 78 ± 25 | 173 ± 36 | ND | 97.1 ± 3.0 | |
| L. plantarum NCC 2829 (pure) | −237 ± 57 | −39 ± 7 | 719 ± 75 | 86 ± 15 | ND | 109.5 ± 6.8 |
| L. plantarum NCC 1295 (pure) | −45 ± 1 | 216 ± 68 | 20 ± 3 | ND | 106.4 ± 4.3 | |
| L. fermentum NCC 575 (mixed) | −127 ± 5 | −63 ± 2 | 151 ± 13 | 1.56 ± 8 | 116 ± 6 | 93.2 ± 0.1 |
| L. fermentum NCC 528 (mixed) | −78 ± 15 | −8 ± 1 | 344 ± 50 | 26 ± 8 | ND | 95.0 ± 0.1 |
| L. plantarum NCC 2829 (mixed) | −109 ± 14 | −70 ± 5 | 130 ± 31 | 150 ± 23 | 85 ± 17 | 93.1 ± 1.9 |
| L. plantarum NCC 1295 (mixed) | −110 ± 7 | −69 ± 4 | 139 ± 20 | 156 ± 15 | 92 ± 8 | 84.5 ± 6.0 |
Fluxes were calculated from smoothed data using the generalized logistic equation (42). The data are averages and standard deviations from the growth phase. Standard deviations were estimated from fluctuations along the cultivation. ND, not detected. The limit of detection was <0.003 mM.
Calculated as moles of carbon produced divided by moles of carbon taken up × 100%. Carbon dioxide was estimated based on the reaction stociometries (CO2 flux = acetate flux − citrate uptake flux).
Glucose consumption was too low to be quantified; thus, yields were normalized to citrate uptake.
Fig 5.

Metabolic fluxes of pure cultures of (A) L. fermentum NCC 575, (B) L. fermentum NCC 528, (C) L. plantarum NCC 2829, and (D) L. plantarum NCC 1295 grown in cocoa pulp simulation medium. The data are relative fluxes, normalized to the corresponding glucose uptake rate (Table 3). In the case of L. fermentum NCC 528, glucose consumption was too low to be quantified. Thus, for the fitting procedure, all fluxes were normalized with respect to citrate uptake and afterwards mapped to the fitted glucose influx. The relative flux intensity is also illustrated by the arrow thickness. The direction of the reversible reactions is indicated by a small arrow. The fluxes were derived via metabolite and isotopomer balancing recruiting extracellular fluxes (Table 3) and via 13C labeling pattern of extracellular products (see Tables S1 to S4 in the supplemental material). In addition to the net fluxes, 90% confidence intervals are shown. Abbreviations are as in Fig. 1.
Metabolic fluxes of L. fermentum in cocoa pulp simulation medium.
L. fermentum NCC 575 exhibited a high flux toward mannitol production from fructose. Overall, 96% of assimilated fructose was converted into the sugar alcohol. A low but significant flux of 4% was directed toward the PPK pathway (Fig. 5A). Furthermore, the entire carbohydrate in the central carbon metabolism entered the PPK pathway, which means that the EMP pathway was not active. Acetylphosphate, formed in the PPK pathway, was entirely converted into acetate. Additionally, pyruvate decarboxylation to acetyl coenzyme A (acetyl-CoA) was comparably low. About 38% of acetate and lactate originated from citrate. The predominant proportion of acetate (60%) was obtained through glucose consumption via the PPK pathway. Here, glucose and fructose were completely channeled through the PPK pathway (Fig. 5B). Therefore, fructose contributed very little to the overall flux. L. fermentum NCC 528 showed a flux pattern similar to that of L. fermentum NCC 575, in that the EMP pathway was inactive and glucose and fructose were completely directed through the PPK pathway (Fig. 5B). However, L. fermentum NCC 528 did not produce any mannitol from fructose. Additionally, citrate consumption was very high compared to glucose uptake. Overall, about 83% of acetate and lactate resulted from the acid.
Metabolic fluxes of L. plantarum in cocoa pulp simulation medium.
In L. plantarum NCC 2829, hexose metabolism via the EMP pathway dominated over the PPK pathway. The split ratio between overall flux through EMP pathway and flux through PPK pathway was 8:1, which means that 89% of assimilated fructose and glucose was metabolized via the EMP pathway. Fructose consumption was twice as high as glucose uptake (Fig. 5C), and no mannitol was produced from fructose. Additionally, citrate metabolism was significant, with 9% of lactate and 60% of acetate being produced from citrate, respectively. The flux pattern of L. plantarum NCC 1295 resembled that from the NCC 2829 strain (Fig. 5D). The EMP pathway was dominant over the PPK pathway (glycolytic flux, 5%). However, L. plantarum NCC 1295 differed from L. plantarum NCC 2829 in that fructose uptake was much lower and citrate consumption was negligible. Acetate was produced via the PPK pathway, pyruvate decarboxylation, and citrate metabolism; however, acetate levels remained low.
In summary, the LAB differed significantly in their central carbon metabolism. In the L. plantarum strains, the EMP pathway was dominant, leading to lactate as the major product. The L. fermentum strains metabolized carbohydrates exclusively via the PPK pathway. All strains of L. plantarum and L. fermentum fermented citrate. However, the rate of consumption varied between the individual strains. Among the selected bacteria, only L. fermentum NCC 575 produced mannitol.
Metafluxome of consortia of lactic acid bacteria in cocoa pulp simulation medium.
To investigate the individual contribution of single LAB species in the complex pulp environment, labeling studies with mixed cultures were performed next (Table 1). For each labeling study, the strategy described in Fig. 2 was applied and metabolic fluxes were estimated. The flux maps obtained are presented in Fig. 6. It should be noted that the fluxes reflected the metafluxome of the entire consortium. The corresponding cultivation profiles are presented in Fig. S1 in the supplemental material. As indicated by the low 90% confidence intervals (Fig. 6) and errors between predicted and experimental mass isotopomer distributions (see Tables S5 to S8 in the supplemental material) typically lower than 5%, the metabolic fluxes were predicted accurately.
Fig 6.

Metabolic fluxes of mixed cultures of (A) L. fermentum NCC 575, (B) L. fermentum NCC 528, (C) L. plantarum NCC 2829, and (D) L. plantarum NCC 1295 in cocoa pulp simulation medium (see Table 1 for more detailed information). The data are relative fluxes, normalized to the corresponding glucose uptake rate (Table 3). The relative flux intensity is also illustrated by the arrow thickness. The color of the arrows represents the change in flux (mmol [mmol of glucose]−1) compared to the pure culture of the respective organism (Fig. 5). The direction of the reversible reactions is indicated by a small arrow. In addition to the net fluxes, 90% confidence intervals are shown. The fluxes were derived via metabolite and isotopomer balancing recruiting extracellular fluxes (Table 3) and via 13C labeling pattern of extracellular products (see Tables S1 to S4 in the supplemental material). Abbreviations are as in Fig. 1.
In the consortium of L. fermentum NCC 575 and four L. plantarum strains, only 4% of hexose (available for EMP and PPK pathways) entered the EMP pathway, while the PPK pathway was dominant (Fig. 6A) and about 94% of fructose were used for mannitol production. The ratio of citrate consumption to glucose uptake was 54:100. Lactate and acetate were produced at a ratio of approximately 1:1. The consortium of L. fermentum NCC 528 and four L. plantarum strains metabolized glucose and fructose (approximately 89%) predominantly via the EMP pathway (Fig. 6B). Citrate consumption was negligible (less than 5% of total carbon uptake flux). Mannitol was not produced at all, and lactate was the main metabolite of the consortium. Additionally, small amounts of acetate were secreted.
In the coculture of L. plantarum NCC 2829 and four L. fermentum strains, the PPK pathway was dominant and only 1% of glucose and fructose that entered the carbon core metabolism was metabolized via the EMP pathway. However, the major part of fructose (88%) was reduced to mannitol but was not catabolized. The ratio of citrate consumption to glucose uptake flux was close to 59:100. In the consortium of L. plantarum NCC 1295 and four L. fermentum strains, the PPK pathway was dominant, and approximately 6% of glucose and the fructose fraction available for the carbon core metabolism was metabolized via the EMP pathway. The major part of fructose was converted into mannitol (88% of total consumption). The ratio of citrate consumption to glucose uptake flux was close to 57:100.
Population dynamics under conditions of cocoa fermentation.
Obviously, the L. fermentum NCC 575 dominated the metafluxome in a mixed consortium of different LAB strains. This performance was unique among all strains tested, so it seemed interesting to look at the population dynamics from a different point of view. All species could be clearly differentiated by colony morphology when grown on LBD agar (Fig. 7A). L. fermentum NCC 575 formed regular, whitish to bluish colonies on the blue agar surface. In contrast, colonies of all L. plantarum strains were greenish, accompanied by a color change from blue to green of the surrounding medium. Furthermore, individual L. plantarum strains could be distinguished by fine morphology. L. plantarum NCC 1295 formed colonies of an irregular shape. L. plantarum NCC 2829 produced intensely green, regular colonies, whereas L. plantarum NCC 245 and NCC 2936 colonies were greenish to bluish. The latter two strains could not be differentiated but rather showed up as one group. To unravel the dynamics of the microbial population, samples from the consortium were incubated on the differential agar. It can be seen that L. fermentum NCC 575 very quickly outcompeted the other strains (Fig. 7B). Starting from a large fraction of about 70% of the total cell number, the presence of L. plantarum cells was significantly reduced after 6 h of cultivation. After 24 h, L. fermentum NCC 575 was the only strain remaining.
Fig 7.

Population dynamics during cocultivation of L. fermentum NCC 575 and four L. plantarum strains, i.e., L. plantarum NCC 2829, L. plantarum NCC 1295, L. plantarum NCC 245, and L. plantarum NCC 2936 (Table 1). (A) Individual colony morphology of all strains on LBD agar. (B) Visual inspection of the microbial population after incubation of coculture samples, done at different time points, on LBD agar, with a 5-fold zoom to selected parts of the agar plates. For strain identification, the color and morphology of each colony were compared with those of the pure cultures. (C) Average population composition during cocultivation, as determined from the analysis.
DISCUSSION
Recent studies have highlighted the impact of the composition of the microbial community and its activity on cocoa fermentation as well as its ultimate link to the success of this important industrial process (4, 6, 7, 10, 11). At this point, system-wide metabolic flux analysis enables us to unravel how individual pathway fluxes contribute to the properties of the fermented cocoa bean and how the different microbial species interact to affect the overall outcome of the fermentation process. In this regard, this work represents a next step toward a systems-level understanding of cocoa fermentation. In a set of isotope labeling experiments, run in a well-established environment that simulates cocoa fermentation (7), different LAB strains were analyzed at the level of molecular carbon fluxes.
Metabolic fluxes of L. fermentum and L. plantarum indicate strain-specific physiology during cocoa fermentation.
The pure culture of L. fermentum NCC 575 used citrate and fructose almost exclusively to maintain the redox balance, while glucose was the energy source. Nevertheless, citrate and fructose contributed indirectly to energy metabolism, because acetylphosphate could be converted efficiently into acetate instead of ethanol (Fig. 5A), leading to generation of an extra mole of ATP (7). Additionally, citrate consumption increases the pH of the acidic cocoa pulp (7, 10) as well as the intracellular pH of the LAB (39). In contrast to L. fermentum NCC 575, L. fermentum NCC 528 did not use fructose as an electron acceptor to produce mannitol, which made increased flux of citrate toward lactate necessary (Fig. 5B). Furthermore, glucose consumption seemed to be inefficient (Fig. 4B and 5B); thus, most of the metabolic energy was derived from citrate metabolism. In contrast to these two strains, the two pure L. plantarum cultures had a significant PPK flux (Fig. 5C and D), which is generally not described for L. plantarum. This increased activity of the PPK pathway may be a result of lactic acid stress at low pH (40). These two strains behaved similarly under cocoa fermentation-simulating conditions but differed in their citrate consumption. This seemed to be inactive or inefficient in L. plantarum NCC 1295, which makes L. plantarum NCC 2829 slightly more suitable for the cocoa fermentation process. Interestingly, both L. plantarum strains cometabolized fructose and glucose: Thus, carbon catabolite repression by glucose on fructose did not seem to be present in these strains, indicating separate mechanisms regulating the uptake of glucose and fructose. L. plantarum NCC 2829 even had a higher uptake flux of fructose than glucose. A similar effect was observed when cucumber juice was fermented with L. plantarum (41). It was suggested that the transport system for glucose has a relatively high optimal pH and is less active at a low pH. Other findings from the flux experiments closely matched previously reported characteristics. Both strains of L. fermentum had no glycolytic flux (Fig. 5A and B). This agrees with the fact that this species is obligately heterofermentative and lacks the genes for the glycolytic enzymes phosphofructokinase and aldolase (www.genome.jp). Similar to cocoa-specific L. fermentum strains (6, 7), L. fermentum NCC 575 and L. fermentum NCC 528 metabolized citrate, which enabled oxidation of the cofactor NADH+H+ to NAD+, in line with lactate formation (Fig. 1). The efficient reduction of fructose into mannitol (96%) by L. fermentum NCC 575 allowed additional regeneration of NAD+. In previous research, it was estimated that 82% of fructose was used for mannitol formation by a cocoa-specific L. fermentum strain (7). Overall, the highly diverging flux distributions underline that the presence of one or the other species has a significant influence on the overall carbon flux.
L. fermentum NCC 575 is a LAB strain that performs well under cocoa fermentation conditions.
Among all tested LAB, L. fermentum NCC 575 showed outstanding behavior in the mixed cultures. As indicated by the color map in Fig. 6A, the metaflux profile of the mixed culture of L. fermentum NCC 575 with four other LAB was almost identical to that of its pure culture (Fig. 5A). The EMP pathway flux, which originates exclusively from the L. plantarum strains, comprised only 4% of the total flux of monosaccharides within the consortium. This shows that 96% of the metafluxome was attributable to the activity of L. fermentum NCC 575. The dominance of L. fermentum NCC 575 was also reflected by the population dynamics (Fig. 7). In contrast, the other tested LAB, i.e., L. plantarum NCC 2829 and NCC 1295 as well as L. fermentum NCC 528, obviously did not succeed to the extent that they could affect the metafluxome in their cocultures (Fig. 6B to D). At this point, we want to emphasize again that the cocultures of L. plantarum NCC 2829 or NCC 1295 were performed without inoculating L. fermentum NCC 575. Thus, the L. plantarum strains were dominated by at least one other L. fermentum strain. Significant differences between the L. plantarum strains regarding their performance in a microbial community were not observed. Hence, the results of this study suggest that L. fermentum NCC 575 might be a potentially metabolically active natural strain that could be used to inoculate cocoa fermentations. In addition to its high competitiveness (Fig. 6 and 7), it may be preferable because of significant amounts of acetate produced (Fig. 3). Acetate is the major metabolite responsible for inducing the death of the cocoa bean, which in turn initiates a cascade of reactions that are essential for the aroma formation of cocoa (2). While previous investigations indicate that L. fermentum strains are well adapted to a cocoa environment (6), our results suggest that a single strain of L. fermentum is able to dominate the whole community and drive the fermentation process. This might allow streamlining starter cultures to be applied in the future.
Metafluxome analysis unravels metabolic interactions in complex fermentation processes.
Many fermentation processes in the food sector are complex. This complexity, i.e., the presence of mixed cultures and a rich nutrient environment, is one of the major reasons why these processes have escaped a thorough detailed understanding at the level of metabolic and molecular reactions. Without doubt, such a knowledge base seems beneficial for better design and control of the underlying processes with regard to reproducibility and quality. In recent years, fluxomics has become a key technology for studying microbial metabolism. However, it is typically restricted to pure cultures and defined media, a scenario which is far different from typical fermentation processes in the food sector. In this regard, the novel approach developed here goes beyond previous flux approaches and extends them to the metafluxome of microbial communities. As we have shown, this provided a quantitative insight into pathway flux of consortia of LAB in the complex environment of cocoa fermentation, a picture that cannot be obtained with any other method. It seems highly promising to develop corresponding approaches to study other complex microbial consortia.
Concluding remarks.
The LAB constitute a prominent and important group during cocoa fermentation. Next promising steps might involve the analysis of other key members of the underlying microbial community, i.e., AAB and yeasts, on the flux level. Currently, a strategy to resolve metabolic fluxes of AAB species is under investigation. It appears promising to extend the metafluxome analysis to mixed consortia of interacting LAB and AAB involved in the fermentation process to get closer to the whole picture of cocoa fermentation. A direct application of the present strategy could resolve pathway fluxes of LAB during, e.g., fermentation of cheese, yogurt, sausage, sauerkraut, shoyu, kimchi, or sourdough. Beyond that, the investigation of fluxes in other consortia involved in food processes, the human gut, and biofilms as well as suspended ecosystems from soil or water might be of interest.
Supplementary Material
Footnotes
Published ahead of print 12 July 2013
Supplemental material for this article may be found at http://dx.doi.org/10.1128/AEM.01483-13.
REFERENCES
- 1.Food and Agriculture Organization (FAO) 26 July 2013, date last accessed Worldwide production of cocoa beans in 2011. http://faostat3.fao.org/home/index.html#DOWNLOAD
- 2.Schwan RF, Wheals AE. 2004. The microbiology of cocoa fermentation and its role in chocolate quality. Crit. Rev. Food Sci. Nutr. 44:205–221 [DOI] [PubMed] [Google Scholar]
- 3.Lima LJR, Almeida MH, Nout MJR, Zwietering MH. 2011. Theobroma cacao L., “the food of the gods”: quality determinants of commercial cocoa beans, with particular reference to the impact of fermentation. Crit. Rev. Food Sci. Nutr. 51:731–761 [DOI] [PubMed] [Google Scholar]
- 4.Papalexandratou Z, Falony G, Romanens E, Jimenez JC, Amores F, Daniel H, de Vuyst L. 2011. Species diversity, community dynamics, and metabolite kinetics of the microbiota associated with traditional Ecuadorian spontaneous cocoa bean fermentations. Appl. Environ. Microbiol. 77:7698–7714 [DOI] [PMC free article] [PubMed] [Google Scholar]
- 5.de Vuyst L, Lefeber T, Papalexandratou Z, Camu N. 2010. The functional role of lactic acid bacteria in cocoa bean fermentation, p 301–326 In Mozzi F, Raya RR, Vignolo GM. (ed), Biotechnology of lactic acid bacteria: novel applications. Blackwell Publishing, Ames, IA [Google Scholar]
- 6.Lefeber T, Janssens M, Moens F, Gobert W, de Vuyst L. 2011. Interesting starter culture strains for controlled cocoa bean fermentation revealed by simulated cocoa pulp fermentations of cocoa-specific lactic acid bacteria. Appl. Environ. Microbiol. 77:6694–6698 [DOI] [PMC free article] [PubMed] [Google Scholar]
- 7.Lefeber T, Janssens M, Camu N, de Vuyst L. 2010. Kinetic analysis of strains of lactic acid bacteria and acetic acid bacteria in cocoa pulp simulation media toward development of a starter culture for cocoa bean fermentation. Appl. Environ. Microbiol. 76:7708–7716 [DOI] [PMC free article] [PubMed] [Google Scholar]
- 8.Ostovar K, Keeney PG. 1973. Isolation and characterization of microorganisms involved in the fermentation of Trinidad's cacao beans. J. Food Sci. 38:611–617 [Google Scholar]
- 9.Papalexandratou Z, Camu N, Falony G, de Vuyst L. 2011. Comparison of the bacterial species diversity of spontaneous cocoa bean fermentations carried out at selected farms in Ivory Coast and Brazil. Food Microbiol. 28:964–973 [DOI] [PubMed] [Google Scholar]
- 10.Camu N, de Winter T, Verbrugghe K, Cleenwerck I, Vandamme P, Takrama JS, Vancanneyt M, de Vuyst L. 2007. Dynamics and biodiversity of populations of lactic acid bacteria and acetic acid bacteria involved in spontaneous heap fermentation of cocoa beans in Ghana. Appl. Environ. Microbiol. 73:1809–1824 [DOI] [PMC free article] [PubMed] [Google Scholar]
- 11.Lefeber T, Gobert W, Vrancken G, Camu N, de Vuyst L. 2011. Dynamics and species diversity of communities of lactic acid bacteria and acetic acid bacteria during spontaneous cocoa bean fermentation in vessels. Food Microbiol. 28:457–464 [DOI] [PubMed] [Google Scholar]
- 12.Pereira GV, Miguel MG, Ramos CL, Schwan RF. 2012. Microbiological and physicochemical characterization of small-scale cocoa fermentations and screening of yeast and bacterial strains to develop a defined starter culture. Appl. Environ. Microbiol. 78:5395–5405 [DOI] [PMC free article] [PubMed] [Google Scholar]
- 13.Wood BJ, Holzapfel W. (ed). 1995. The genera of lactic acid bacteria, Glasgow. Chapman & Hall, New York, NY [Google Scholar]
- 14.Morita H, Toh H, Fukuda S, Horikawa H, Oshima K, Suzuki T, Murakami M, Hisamatsu S, Kato Y, Takizawa T, Fukuoka H, Yoshimura T, Itoh K, O'Sullivan DJ, McKay LL, Ohno H, Kikuchi J, Masaoka T, Hattori M. 2008. Comparative genome analysis of Lactobacillus reuteri and Lactobacillus fermentum reveal a genomic island for reuterin and cobalamin production. DNA Res. 15:151–161 [DOI] [PMC free article] [PubMed] [Google Scholar]
- 15.Marschall E, Jogler M, Henssge U, Overmann J. 2010. Large-scale distribution and activity patterns of an extremely low-light-adapted population of green sulfur bacteria in the Black Sea. Environ. Microbiol. 12:1348–1362 [DOI] [PubMed] [Google Scholar]
- 16.Wittmann C. 2007. Fluxome analysis using GC-MS. Microb. Cell Fact. 6:6. [DOI] [PMC free article] [PubMed] [Google Scholar]
- 17.Zamboni N, Fendt S, Ruhl M, Sauer U. 2009. 13C-based metabolic flux analysis. Nat. Protoc. 4:878–892 [DOI] [PubMed] [Google Scholar]
- 18.Kohlstedt M, Becker J, Wittmann C. 2010. Metabolic fluxes and beyond—systems biology understanding and engineering of microbial metabolism. Appl. Microbiol. Biotechnol. 88:1065–1075 [DOI] [PubMed] [Google Scholar]
- 19.Kelleher JK. 2001. Flux estimation using isotopic tracers: common ground for metabolic physiology and metabolic engineering. Metab. Eng. 3:100–110 [DOI] [PubMed] [Google Scholar]
- 20.Lefeber T, Papalexandratou Z, Gobert W, Camu N, de Vuyst L. 2012. On-farm implementation of a starter culture for improved cocoa bean fermentation and its influence on the flavour of chocolates produced thereof. Food Microbiol. 30:379–392 [DOI] [PubMed] [Google Scholar]
- 21.Atlas RM. 2006. Handbook of microbiological media for the examination of food, 2nd ed. CRC Press, Boca Raton, FL [Google Scholar]
- 22.Wittmann C, Hans M, Heinzle E. 2002. In vivo analysis of intracellular amino acid labelings by GC/MS. Anal. Biochem. 307:379–382 [DOI] [PubMed] [Google Scholar]
- 23.Yang TH, Bolten CJ, Coppi MV, Sun J, Heinzle E. 2009. Numerical bias estimation for mass spectrometric mass isotopomer analysis. Anal. Biochem. 388:192–203 [DOI] [PubMed] [Google Scholar]
- 24.Kleerebezem M, Boekhorst J, van Kranenburg R, Molenaar D, Kuipers OP, Leer R, Tarchini R, Peters SA, Sandbrink HM, Fiers MWEJ, Stiekema W, Lankhorst RMK, Bron PA, Hoffer SM, Groot MNN, Kerkhoven R, Vries M de, Ursing B, Vos WM de, Siezen RJ. 2003. Complete genome sequence of Lactobacillus plantarum WCFS1. Proc. Natl. Acad. Sci. U. S. A. 100:1990–1995 [DOI] [PMC free article] [PubMed] [Google Scholar]
- 25.Palles T, Beresford T, Condon S, Cogan TM. 1998. Citrate metabolism in Lactobacillus casei and Lactobacillus plantarum. J. Appl. Microbiol. 85:147–154 [Google Scholar]
- 26.Medina de Figueroa R, Alvarez F, Pesce de Ruiz Holgado A, Oliver G, Sesma F. 2000. Citrate utilization by homo- and heterofermentative lactobacilli. Microbiol. Res. 154:313–320 [DOI] [PubMed] [Google Scholar]
- 27.Hickey W, Hillier AJ, Jago GR. 1983. Metabolism of pyruvate and citrate in lactobacilli. Aust. J. Biol. Sci. 36:487–496 [DOI] [PubMed] [Google Scholar]
- 28.Helanto M, Aarnikunnas J, Palva A, Leisola M, Nyyssölä A. 2006. Characterization of genes involved in fructose utilization by Lactobacillus fermentum. Arch. Microbiol. 186:51–59 [DOI] [PubMed] [Google Scholar]
- 29.Wisselink HW, Weusthuis RA, Eggink G, Hugenholtz J, Grobben GJ. 2002. Mannitol production by lactic acid bacteria: a review. Int. Dairy J. 12:151–161 [Google Scholar]
- 30.Teusink B, Wiersma A, Jacobs L, Notebaart RA, Smid EJ. 2009. Understanding the adaptive growth strategy of Lactobacillus plantarum by in silico optimisation. PLoS Comput. Biol. 5:e1000410. [DOI] [PMC free article] [PubMed] [Google Scholar]
- 31.Bolotin A, Mauger S, Malarme K, Ehrlich SD, Sorokin A. 1999. Low-redundancy sequencing of the entire Lactococcus lactis IL1403 genome. Antonie Van Leeuwenhoek 76:27–76 [PubMed] [Google Scholar]
- 32.Okano K, Yoshida S, Yamada R, Tanaka T, Ogino C, Fukuda H, Kondo A. 2009. Improved production of homo-d-lactic acid via xylose fermentation by introduction of xylose assimilation genes and redirection of the phosphoketolase pathway to the pentose phosphate pathway in L-lactate dehydrogenase gene-deficient Lactobacillus plantarum. Appl. Environ. Microbiol. 75:7858–7861 [DOI] [PMC free article] [PubMed] [Google Scholar]
- 33.Nielsen J, Villadsen J, Lidén G. 2003. Bioreaction engineering principles, 2nd ed. Kluwer Academic Publishers, New York, NY [Google Scholar]
- 34.Schmidt K, Carlsen M, Nielsen J, Villadsen J. 1997. Modeling isotopomer distributions in biochemical networks using isotopomer mapping matrices. Biotechnol. Bioeng. 55:831–840 [DOI] [PubMed] [Google Scholar]
- 35.Wittmann C, Heinzle E. 1999. Mass spectrometry for metabolic flux analysis. Biotechnol. Bioeng. 62:739–750 [DOI] [PubMed] [Google Scholar]
- 36.Yang TH, Wittmann C, Heinzle E. 2004. Metabolic network simulation using logical loop algorithm and Jacobian matrix. Metab. Eng. 6:256–267 [DOI] [PubMed] [Google Scholar]
- 37.Wittmann C, Heinzle E. 2002. Genealogy profiling through strain improvement by using metabolic network analysis: metabolic flux genealogy of several generations of lysine-producing corynebacteria. Appl. Environ. Microbiol. 68:5843–5859 [DOI] [PMC free article] [PubMed] [Google Scholar]
- 38.Rosman KJR, Taylor PDP. 1998. Isotopic compositions of the elements 1997. Pure Appl. Chem. 70:217–235 [Google Scholar]
- 39.Magni C, de Mendoza D, Konings WN, Lolkema JS. 1999. Mechanism of citrate metabolism in Lactococcus lactis: resistance against lactate toxicity at low pH. J. Bacteriol. 181:1451–1457 [DOI] [PMC free article] [PubMed] [Google Scholar]
- 40.Pieterse B. 2005. Unravelling the multiple effects of lactic acid stress on Lactobacillus plantarum by transcription profiling. Microbiology 151:3881–3894 [DOI] [PubMed] [Google Scholar]
- 41.Lu Z, Fleming H, McFeeters RF. 2001. Differential glucose and fructose utilization during cucumber juice fermentation. J. Food Sci. 66:162–166 [Google Scholar]
- 42.Jolicoeur P, Pontier J. 1989. Population growth and decline: a four-parameter generalization of the logistic curve. J. Theor. Biol. 141:563–571 [Google Scholar]
Associated Data
This section collects any data citations, data availability statements, or supplementary materials included in this article.