
Figure 2.
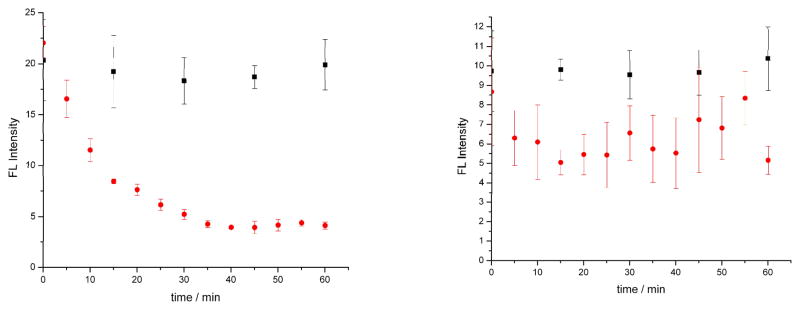
Mean MitoTracker deep red (MTDR) fluorescence intensity by as a function of time for five Ramos cells at each time interval by ultrasensitive confocal microscopy. Control cells are represented as black squares and drug induced samples as red circles. All cells were stained with 0.1 μM MTDR and samples were induced with (a) 0.4 μM staurosporine or (b) 0.04 μM staurosporine. The 1/e time for the 0.4 μM sample was 38 minutes, and was not measured for the 0.04 μM sample.