Abstract
Background
The immune system is particularly sensitive to stress. Although acute stress generally has positive effects, chronic stress typically provokes immunosuppression. The elucidation of the mechanisms involved in immunosuppression are of interest for the design of therapeutic approaches to avoid the appearance of stress disorders. This study aimed to investigate chronic stress-induced alterations on lymphocyte subset distribution and percentages. The experiments were performed with C57BL/6 mice subjected to chronic immobilization stress.
Results
Stress caused a marked increase in apoptosis inside the thymus, and a reduction in the total number of thymocytes. Furthermore, the proportion of immature thymocytes declined significantly suggesting that the increased apoptosis mainly affected cells of immature phenotype. In blood, the total number of lymphocytes diminished but not all lymphocyte populations showed the same tendency: while the relative proportion of B cells declined slightly, the relative proportion of circulating CD3+ cells, and particularly some T cell subsets showing an immature phenotype (CD3+PNA+), increased under stress. The spleen and lymph nodes show a marked reduction in cellularity, but the relative proportion of T cells increased, while no change or only a slight reduction was observed in the relative proportion of B cells. Similarly, the relative proportion of T cells increased in bone marrow.
Conclusions
Detailed data on the alterations of lymphoid cell subsets occurring under immobilization stress, both in the bloodstream and in different lymphoid tissues, are obtained. In general, T cells are more affected than B cells and, in particular, a marked increase in the percentage of a subset of circulating PNA+CD3+ T cells is observed.
Background
Under normal conditions, the generation of the T-cell repertoire begins with the differentiation of precursor T cells (pre-T cells) in the fetal liver (during early embryogenesis) or bone marrow (during later embryogenesis and after birth [1,2]. In the most important T-cell maturation pathway, the intrathymic pathway, pre-T cells repopulate the thymus to become mature T cells [3-6]. This pathway, during which the cells undergo several phenotypic changes, involves the interplay of numerous molecules [7-15], and it is in fact completed by only a small percentage of thymocytes [16]. The proper functioning of the intrathymic thymocyte selection process is crucial to avoid the presence of autoreactive T cells in the body [17]. Once in the mature state, these cells (now T lymphocytes) leave the thymus and migrate to the periphery where they perform their function. Again, adequate maturation and mobility of lymphoid cells are essential for generation of the correct repertoire and distribution throughout the body in appropriate concentrations, so as to ensure optimum performance of the immune system.
The immune system is particularly sensitive to stress, and specific effects of stress have been demonstrated by a number of studies [18-21]. Acute stress generally has positive effects, while chronic stress typically provokes immunosuppression and diverse associated pathologies, including autoimmune diseases [22-28].
The elucidation of the mechanisms involved in the immunosuppression state will likely be of interest for the design of therapeutic approaches to avoid the appearance of stress disorders. In the present study we investigated the effects of chronic immobilization stress on the distribution and percentages of various mouse immune cell populations, with the aim of identifying possible relationships between stress-associated lymphoid cell abnormalities and vulnerability to diseases.
Results
Thymus
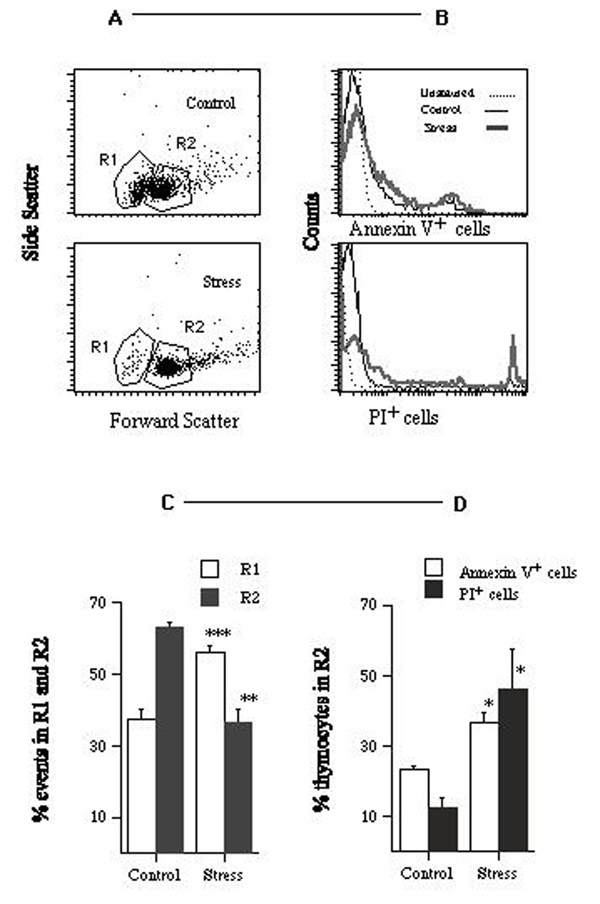
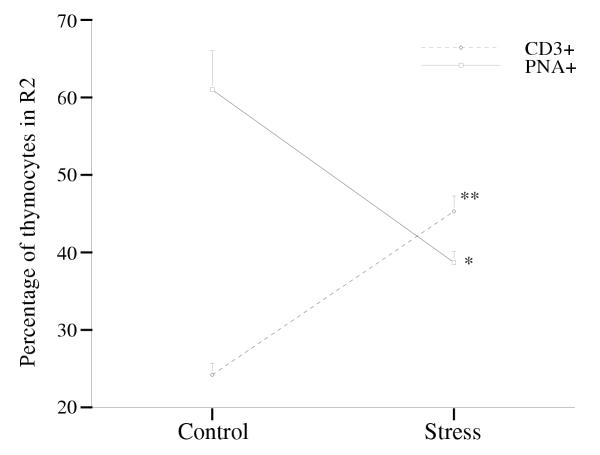
Immobilization stress (5 hours per day during 14 consecutive days) caused thymus weight to decrease from 68.7 mg to 33.3 mg (0.5 fold. Table 1, P***). Figures 1A,1B,1C,1D summarize the results obtained by flow cytometry. Regions R1 and R2 (panel A) separate cell debris (R1, were most apoptotic bodies and apoptotic and death cells were found) from whole cells (R2). By comparison with control animals, stressed animals showed a) a 1.5-fold increase in the percentage of events in R1, (37.6% for control mice versus 56.2% for stressed mice, panel C, P***); b) a 1.6-fold increase in the percentage of annexin V+ (i.e. apoptotic) cells in R2 (23.3% annexin V+ cells for control mice versus 36.5% for stressed mice, panel D, P*), and c) a 3.6-fold increase in the percentage of propidium iodide positive (PI+, i.e. dead) cells in R2 (12.7% of PI+ cells for control mice versus 46.4% in stressed mice, panel D, P*). The percentage of immature thymocytes (i.e. PNA+ cells) in R2 decreased from 61.0% in control mice to 38.7% in stressed mice (0.64 fold, Figure 2, P*). The percentage of CD3+ thymocytes in R2 increased from 24.3% in control mice to 45.3% in stressed mice (2-fold. Figure 2, P**).
Table 1.
Organ weights (mg) in unstressed and stressed mice. Values shown are means ± SEMs for 10–15 mice. Stressing was by immobilization for 5 h per day for 14 consecutive days. Asterisks indicate a statistically significant difference (***P ≤ 0.001) between the two groups.
| Unstressed mice | Stressed mice | Fold decrease | |
| Thymus | 68.7 ± 4.3 | 33.3 ± 2.4*** | 0.5 |
| Spleen | 74.5 ± 6.2 | 38.5 ± 1.8*** | 0.5 |
| Lymph nodes | 43.7 ± 2.3 | 19.1 ± 1.0*** | 0.4 |
Figure 1.
Effects of stress on thymic cell populations. A – Flow cytometry scatter plots for thymic cells from one control (top) and one stressed (bottom) mice. The plots show 5% of the total number of events, for one representative mouse from each group. Gates R1 (cell debris) and R2 (whole cells) were positioned by standard procedures. B – Histograms showing the number of annexin V+ (top) and PI+(bottom) cells in the corresponding R2 regions. C – Effects of stress on the percentage of events in regions R1 and R2. D – Effects of stress on the percentage of annexin V+ and PI+ cells in region R2. The experiment was done 3 times using 3 ≤ n ≤ 5 mice per group. Data for one representative experiment of the 3 are shown.
Figure 2.
Effects of stress on the percentage of CD3+ and PNA+cells in region R2 (see Fig. 1). The experiment was done 4 times using 3≤ n ≤ 5 mice per group. Data for one representative experiment of the 4 are shown.
Blood
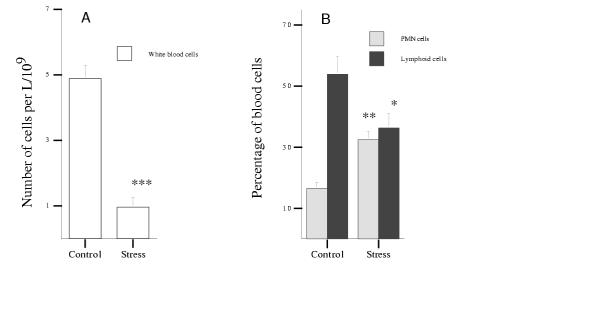
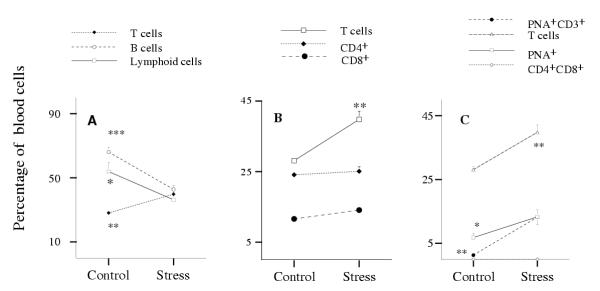
The total number of circulating white blood cells significantly diminished under stress from 4.89 million cells per mL in control animals to 0.96 million cells per mL in stressed animals (0.2 fold. Figure 3, panel A, P***). However, the proportion of PMN cells in the white blood cell population went up from 16.5% in control animals to 32.5% in stressed animals (2 fold, P**, Figure 3B), while the proportion of lymphoid cells diminished from 53.9% in control mice to 36.3% in stressed mice (0.67 fold. Figure 3B, P*). Within the lymphoid population, the proportion of B cells decreased from 66.1% in the control group to 42.3% in the stressed group of animals (to 0.6 fold. Figure 4A, P***), but the proportion of T cells showed a marked increase from 28.1% in control mice to 39.8% in stressed mice (1.4 fold, P**). While the relative proportion of cytotoxic CD8+ cells and of CD4+ cells did not change under 5 h stress per day (Figure 4B), the relative proportion of a subpopulation of PNA+ cells increased significantly from 6.8% in control mice to 13.3% in stressed mice (1.9 fold. Figure 4C, P*). This observation is particularly relevant because many of those cells are T cells. In this connection the PNA+CD3+ subset of circulating T cells showed a spectacular increase, from 1.3% in control mice to 13.2% in stressed mice (10-fold, Figure 4C, P**). On the other hand, no CD4+CD8+ cells were detected in the bloodstream.
Figure 3.
Effects of stress on peripheral blood cell populations. A – Effects of stress on the total number of white blood cells. B – Effects of stress on the percentage of PMN cells and lymphoid cells gated in the white blood cell region. The experiment was done 2 times using 3 ≤ n ≤ 5 mice per group. Data for one representative experiment of the 2 are shown.
Figure 4.
Effects of stress on the percentages of lymphoid cell subsets in peripheral blood. A – Lymphoid, T and B cells. B – T cell subsets (CD3+, CD4+ and CD8+). C – PNA+ and PNA+CD3+ cells. The experiment was done 3 times using 3 ≤ n ≤ 5 mice per group. Data for one representative experiment of the 3 are shown.
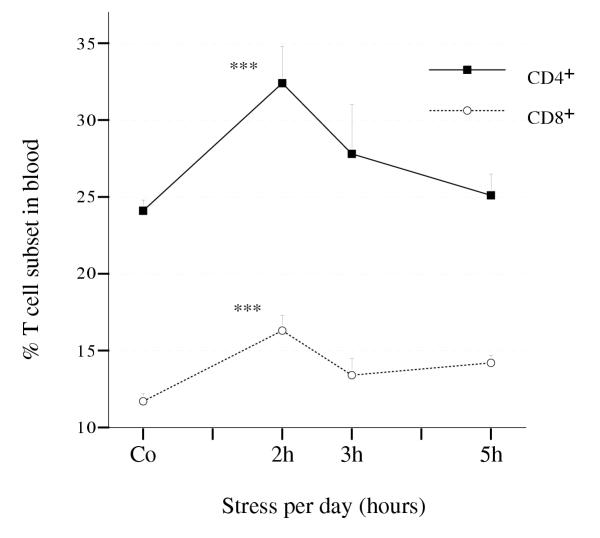
The fact that a significant change in the relative proportion of CD4+ and CD8+ cells was observed when immobilization was applied 2 h per day (for CD4+ cells the proportion increased from 24.1% to 32.4%, P***, and for CD8+ cells increased from 11.6% to 16.3%, P***, Figure 5)is also relevant but not under 3 or 5 h of immobilization per day.
Figure 5.
Dose-response in terms of proportions of CD4+ and CD8+ T cell subsets in the blood of stressed mice. The number of mice per group used in this experiment was n, 4 ≤ n ≤ 8.
Bone marrow, spleen and lymph nodes
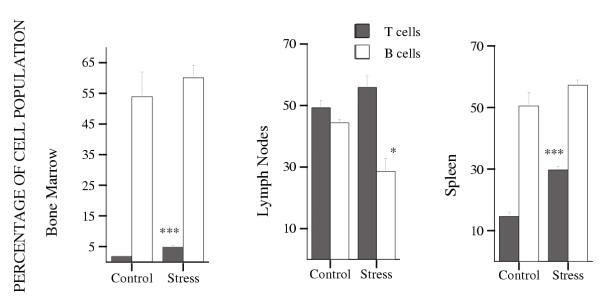
Spleen weight and axillary lymph node weight both decreased significantly under stress. Spleen decreased from 74.5 mg in the group of control animals to 38.5 mg in the group of stressed animals, and lymph nodes from 43.7 mg to 19.1 mg, (0.5 fold, P***, and 0.4 fold, P***, respectively. Table 1). The proportion of T cells increased significantly in both spleen and bone marrow in stressed animals (from 14.6% to 29.7%, 2 fold, P*** in spleen, and from 1.8% to 4.8%, 2.8 fold, P** in bone marrow. Figure 6), while B cells did not change. In lymph nodes, the proportion of T cells showed a tendency to increase, although this was not statistically significant; the proportion of B cells decreased significantly from 44.4% in control mice to 28.6% in stressed mice (1.6 fold. Figure 6).
Figure 6.
Effects of stress on the percentages of T and B cell populations in the spleen, bone marrow and axillary lymph nodes. The experiment was done 3 times using 3 ≤ n ≤ 5 mice per group. Data for one representative experiment of the 3 are shown.
Discussion
The study of the immune system under stress is a broad and complex field of research where many questions remain to be answered. Although this situation can be related to a number of different factors, it is illustrative to indicate that: i. different stress-conditions translate into different, even opposite (acute versus chronic stress), effects on the immune system and ii. intrinsic parameters such as sex, age and strain, besides others such as coping, escape or prediction capabilities, individual experience and history, conditioning, etc, strongly influence the immune system.
It should also be noted that the immune system is compartmentalized and the response to a stressor might be different on each compartment. It looks reasonable to expect that the comparative analysis of these effects on the different organs-tissues could afford a more detailed picture of the situation and could further contribute to our understanding of this area. With this idea in mind and as a first step, we considered of outmost importance to carry out a study to simultaneously determine the effects of stress on each of the main immune organs. We also decided to include the circulatory system as an additional target in this study because of its important transporting role.
Our findings confirm that chronic immobilization stress has a major impact on the mouse immune system, causing dramatic changes in the normal distribution of immune cells. Notably, there are marked effects on the concentrations of the different subtypes of T cells. These alterations are observed in the bloodstream and in all of the lymphoid tissues analyzed (thymus, bone marrow, lymph nodes and spleen).
The increase in apoptosis in the thymus under immobilization stress is in line with the results obtained in other studies [18,29]. Of particular interest was our independent analysis of two major populations of cells inside the thymus: immature cells, labeled with PNA-FITC, and cells expressing TCR (antiCD3-PE mAb). While CD3+ thymocytes were in fact present in stressed animals at higher relative proportions (43.5% in stressed animals versus 24.2% in control animals, 2-fold increase), PNA+ cells underwent a significant relative reduction with respect to region R2 in Figure 1 (61.0% in control animals versus 38.7% in stressed animals, 0.6 fold decrease). This suggests that immobilization stress reinforces the negative selection of immature thymocytes, i.e. increases the rate of apoptosis among those cells.
As regards blood cells, we observed a decrease in circulating total white blood cells, and in particular a decrease in the total lymphoid population. The relative sizes of the different subsets of lymphoid cells also varied significantly. Notably, there was a considerable increase in the relative proportion of T cells (1.4 fold in CD3+ cells) in the total lymphoid population. Furthermore, a very high proportion of these circulating T cells showed an immature phenotype (i.e. 13.2% of PNA+CD3+ cells in stressed mice versus 1.3% in control mice) but they are not CD4+CD8+ thymocytes. These immature cells may have originated from the thymus as a result of alteration of the normal intrathymic T cell maturation pathway under stress; alternatively, they may have originated from extrathymic pathways. Regardless of their origin, these cells may not have passed through the normal selective processes, and many clones could thus show autoreactivity. It has been reported previously that self-reactive forbidden clones, showing a higher resistance to apoptosis, arise under immunosuppression, differentiating via alternative thymic, hepatic and other pathways, and that stress play a role in the onset of several pathologies including autoimmune diseases [30-35]. In line with that our results led us to hypothesize that stress alters the T cell differentiation pathway allowing and/or activating autoreactive T cell clones in the periphery which will contribute to the enhancement of autoimmune disorders. Notice that those cells would become relevant under immunosuppression conditions such as stress.
Redistribution of leukocytes was also reported under acute stress by Dhabhar et al [21]. These authors also observed a large reduction in blood lymphocytes and, in keeping with our results, T cells exhibited the smaller stress-induced decrease. Furthermore, they observed an increase in the relative proportion of T helper cells. Our studies on chronic stress showed a significant increase in the relative proportion of circulating CD4+ and CD8+ cell subsets when the immobilization period was 2 hours per day. This result can be rationalized assuming an increase of the peripheral demand of T cells under stress, a hypothesis already put forward by other authors. We observed, however, than in animals subjected to immobilization of 3 or 5 hours per day the blood percentages of these two subsets (CD4+ and CD8+) remained at relative proportions similar to those of controls (Figure 5). It is tempting to propose here that the higher decrease in CD4+ and CD8+ populations on the thymus (associated with the comparatively larger stress-period, i.e. larger thymic-involution), would counteract the effect of the increased peripheral demand of T cells from thymus for these two cell subsets. Under this scenario it will also be expected that other T cell subsets (generated by the intrathymic alternative pathway of T cell generation -operative under this immunosuppressive conditions-), would predominate over the CD4+ and CD8+ T cells in the thymus. They would consequently be demanded to the blood in larger amounts, in fully agreement with the observed results. The study of these T cell subsets in the blood could be relevant for their use as prognostic markers.
Conclusions
This work affords detailed data on the alterations of lymphoid cell subsets occurring under immobilization stress, both in the bloodstream and in different lymphoid tissues. The magnitude of such changes and their physical location most likely reflect the strong and complex influence of stress on the maturation and/or mobility of lymphoid cells. In general, T cells are more affected than B cells and, in particular, a marked increase in the percentage of a subset of circulating PNA+CD+ T cells is observed.
Materials and methods
Animals
This work was carried out with C57BL/6 mice aged 33± 2 days, bred in our animal facility from stock supplied by Iffa-Credo SA (Barcelona, Spain). The animals were kept under minimal-stress conditions with lights on at 8.00 am and off at 20.00 pm, and with free access to food and water. Pups had been weaned at age 21 days and sexed at 30 days.
Chronic immobilization stress protocol
Mice were kept inside an immobilization tube, adapted from a Nunc centrifuge tube (Nalge Nunc International, 2000 North Aurora Rd., Naperville, IL 60563-1796 USA; catalog number 373660) by making a hole in the bottom and a lateral slit, 2, 3 or 5 hours per day for 14 consecutive days. This procedure is easy to perform and inflicts no physical pain to the animals. In all the experiments and immediately after the last stress session, the animals were anesthetized with ether and sacrificed by decapitation. Blood was collected in tubes with anticoagulant (EDTANa2), and the thymus, spleen, axillary lymph nodes and femurs were removed and kept in cold phosphate-buffered saline (PBS).
Analysis of thymus cells
Mature and immature cells inside the thymus
Cell suspensions (approximately 106 thymocytes, electronically counted (Coulter Counter ZM fitted with a Channelizer 256, distributed by IZASA S.A., Aragoneses 13, 28108 Alcobendas, Madrid, Spain)), prepared from the thymus of each mouse by disgregating the tissue with the back of a syringe plunger on a nylon gauze in cold PBS containing 0.1% bovine serum albumin (BSA), were incubated on ice for 50 minutes with antibodies to mouse CD3 (Pharmingen, Camino de Valdeoliva, s/n 28750 San Agustin de Guadalix, Madrid, Spain) or with PNA (Sigma-Aldrich Quimica S.A., Av. Valdelaparra 53, 28100 Alcobendas, Madrid, Spain) labeled with fluorescein isothiocyanate (FITC) or phycoerythrin (PE). After washing with PBS containing 0.1% of BSA, immunofluorescence was determined with an EPICS XL flow cytometer (Coulter, distributed by IZASA S.A., Aragoneses 13, 28108 Alcobendas, Madrid, Spain).
Apoptotic and dead cells in the thymus
Alternatively, the cell suspensions were stained with biotin-conjugated Annexin V (Roche Diagnostics S.L. Molecular Biochemicals, Copérmico 60 08006 Barcelona, Spain) and propidium iodide in N-[2-hydroxyethyl]piperazine-N'-[2-ethanesulfonic acid] (HEPES) buffer (10 mM HEPES/NaOH pH 7.4, 140 mM NaCl, 5 mM Cacl2) for 1 hour, washed with the same buffer once, and incubated with ExtAvidin-FITC -conjugated for 30 minutes. The cells were then immediately washed and their immunofluorescence measured.
Analysis of blood cells
White blood cell counts
Total leukocyte count was measured in 200 μL of blood in a cytometer (Cell-DYN 3500, Abbott). The analysis of lymphoid and PMN (polymorphonuclear) cell percentages was carried out in a EPICS XL flow cytometer (Coulter) after removing red blood cells (Uti-Lyse, S3325, Dako Corporation, 6392 Via Real, Carpinteria, CA 93013, USA).
Changes in blood lymphocyte proportions
Approximately 100 μL of blood from each control or chronically stressed mouse was incubated with rat serum for 40 minutes at RT, washed with PBS containing 0.1% BSA, and subsequently reacted with antibodies to mouse CD4, CD8, CD3, CD45R/B220 or with PNA (Pharmingen or Sigma) labeled with FITC, PE or QR. After 50 minutes of incubation at RT the red blood cells were removed (Dako), and single, double, or triple immunofluorescence was measured.
Analysis of bone marrow cells
Bone marrow cell suspensions were prepared by flushing cold PBS through each femur. After washing, red blood cells were removed on a Ficoll gradient. Approximately 106 bone marrow cells from each mouse were incubated with rabbit serum for 40 minutes on ice, washed with PBS containing 0.1% BSA, and subsequently allowed to react for 50 minutes with antibodies to mouse Thy 1.2 or CD3 and CD45R/B220 (Pharmingen or Sigma) labeled with FITC and PE. Immunofluorescence was measured after washing with PBS containing 0.1% BSA.
Analysis of spleen and lymph node cells
Cell suspensions, prepared from the spleen or lymph node of each control or chronically stressed mouse by disgregating the tissue with a syringe plunger on a nylon gauze in cold PBS containing 0.1% BSA, and each containing approximately 106 splenocytes, were incubated with rabbit serum for 40 minutes on ice and subsequently with antibodies to Thy 1.2 or CD3 and CD45R/B220 (Sigma or Pharmingen) labeled with FITC or PE for 50 minutes. Immunofluorescence was measured after washing with PBS containing 0.1% BSA.
Statistics
The normality of sample distributions was confirmed by the Shapiro-Wilk test [36]. Data means were compared by the two-tail t test for unpaired samples [37]. In the text, P values (*0.05 ≥ P > 0.01; **0.01 ≥ P > 0.001; ***P ≤ 0.001) are for comparison with means for control and stressed mice.
Acknowledgments
Acknowledgements
The authors thank Prof. Ermesto Cano from the Department of Pharmacoloy at the University of Santiago de Compostela for the Flow Cytometry facilities.
Contributor Information
Lourdes Domínguez-Gerpe, Email: bnldomin@usc.es.
Manuel Rey-Méndez, Email: bnreymen@usc.es.
References
- Haynes BF, Denning SM, Le PT, Singer KH. Human intrathymic T cell differentiation. Semin Immunol. 1990;2:67–77. [PubMed] [Google Scholar]
- Ikuta K, Uchida N, Friedman J, Weissman IL. Lymphocyte development from stem cells. Annu Rev Immunol. 1992;10:759–783. doi: 10.1146/annurev.immunol.10.1.759. [DOI] [PubMed] [Google Scholar]
- Anderson G, Harman BC, Hare KJ, Jenkinson EJ. Microenvironmental regulation of T cell development in the thymus. Semin Immunol. 2000;12:457–464. doi: 10.1006/smim.2000.0260. [DOI] [PubMed] [Google Scholar]
- Sinkora M, Sinkora J, Rehakova Z, Butler JE. Early ontogeny of thymocytes in pigs: sequential colonization of the thymus by T cell progenitors. J Immunol. 2000;165:1832–1839. doi: 10.4049/jimmunol.165.4.1832. [DOI] [PubMed] [Google Scholar]
- Scollay R, Smith J, Stauffer V. Dynamics of early T cells: prothymocyte migration and proliferation in the adult mouse thymus. Immunol Rev. 1986;91:129–157. doi: 10.1111/j.1600-065x.1986.tb01487.x. [DOI] [PubMed] [Google Scholar]
- Rothenberg E, Lugo JP. Differentiation and cell division in the mammalian thymus. Developmental Biology. 1985;112:1–17. doi: 10.1016/0012-1606(85)90114-9. [DOI] [PubMed] [Google Scholar]
- Magner WJ, Chang AC, Owens J, Hong MJ, Brooks A, Coligan JE. Aberrant development of thymocytes in mice lacking laminin-2. Dev Immunol. 2000;7:179–193. doi: 10.1155/2000/90943. [DOI] [PMC free article] [PubMed] [Google Scholar]
- Moroy T, Karsunky H. Regulation of pre-T-cell development. Cell Mol Life Sci. 2000;57:957–975. doi: 10.1007/PL00000737. [DOI] [PMC free article] [PubMed] [Google Scholar]
- Bellavia D, Campese AF, Alesse E, Vacca A, Felli MP, Balestri A, Stoppacciaro A, Tiveron C, Tatangelo L, Giovarelli M, Gaetano C, Ruco L, Hoffman ES, Hayday AC, Lendahl U, Frati L, Gulino A, Screpanti I. Constitutive activation of NF-kappaB and T-cell leukemia/lymphoma in Notch3 transgenic mice. Embo J. 2000;19:3337–3348. doi: 10.1093/emboj/19.13.3337. [DOI] [PMC free article] [PubMed] [Google Scholar]
- Bodey B, Bodey B, Jr, Siegel SE, Kaiser HE. The role of the reticulo-epithelial (RE) cell network in the immuno-neuroendocrine regulation of intrathymic lymphopoiesis. Anticancer Res. 2000;20:1871–1888. [PubMed] [Google Scholar]
- Costello PS, Cleverley SC, Galandrini R, Henning SW, Cantrell DA. The GTPase rho controls a p53-dependent survival checkpoint during thymopoiesis. J Exp Med. 2000;192:77–85. doi: 10.1084/jem.192.1.77. [DOI] [PMC free article] [PubMed] [Google Scholar]
- Geenen V, Kecha 0, Brilot F, Charlet-Renard C, Martens H. The thymic repertoire of neuroendocrine-related self antigens: biological role in T-cell selection and pharmacological implications. Neuroimmunomodulation. 1999;6:115–125. doi: 10.1159/000026371. [DOI] [PubMed] [Google Scholar]
- Ashwell JD, Lu FW, Vacchio MS. Glucocorticoids in T cell development and function. Annu Rev Immunol. 2000;18:309–345. doi: 10.1146/annurev.immunol.18.1.309. [DOI] [PubMed] [Google Scholar]
- Jacobs H. TCR-independent T cell development mediated by gain-of-oncogene function or loss-of-tumor-suppressor gene function. Semin Immunol. 2000;12:487–502. doi: 10.1006/smim.2000.0262. [DOI] [PubMed] [Google Scholar]
- Zerrahn J, Volkmann A, Coles MC, Held W, Lemonnier FA, Raulet DH. Class I MHC molecules on hematopoietic cells can support intrathymic positive selection of T cell receptor transgenic T cells. Proc Natl Acad Sci USA. 1999;96:11470–11475. doi: 10.1073/pnas.96.20.11470. [DOI] [PMC free article] [PubMed] [Google Scholar]
- Scollay RG, Butcher EC, Weissman IL. Thymus cell migration. Quantitative aspects of cellular traffic from the thymus to the periphery in mice. Eur J Immunol. 1980;10:210–218. doi: 10.1002/eji.1830100310. [DOI] [PubMed] [Google Scholar]
- von Boehmer H, Sia The H, Kisielow P. The thymus selects the useful, neglects the useless and destroys the harmful. Immunol Today. 1989;10:57–61. doi: 10.1016/0167-5699(89)90307-1. [DOI] [PubMed] [Google Scholar]
- Ayala A, Herdon CD, Lehman DL, Ayala CA, Chaudry IH. Differential induction of apoptosis in lymphoid tissues during sepsis: Variation in onset, frequency, and the nature of the mediators. Blood. 1996;87:4261–4275. [PubMed] [Google Scholar]
- Benschop R, Schedlowski-M R-F-M. Catecholamine-induced leukocytosis: Early observations, current research, and future directions. Brain Behav and Immun. 1996;10:77–91. doi: 10.1006/brbi.1996.0009. [DOI] [PubMed] [Google Scholar]
- Wu W, Yamaura T, Murakami K, Murata J, Matsumoto K, Watanabe H, Saiki I. Social isolation stress enhanced liver metastasis of murine colon 26-L5 carcinoma cells by suppressing immune responses in mice. Life Sci. 2000;66:1827–1838. doi: 10.1016/S0024-3205(00)00506-3. [DOI] [PubMed] [Google Scholar]
- Dhabhar FS, Miller AH, McEwen BS, Spencer RL. Effects of stress on immune cell distribution. Dynamics and hormonal mechanisms. J Immunol. 1995;154:5511–5527. [PubMed] [Google Scholar]
- Dhabhar FS, McEwen BS. Enhancing versus suppressive effects of stress hormones on skin immune function. Proc Natl Acad Sci USA. 1999;96:1059–1064. doi: 10.1073/pnas.96.3.1059. [DOI] [PMC free article] [PubMed] [Google Scholar]
- Moraska A, Deak T, Spencer RL, Roth D, Fleshner M. Treadmill running produces both positive and negative physiological adaptations in Sprague-Dawley rats. Am J Physiol Regul lntegr Comp Physiol. 2000;279:R1321–1329. doi: 10.1152/ajpregu.2000.279.4.R1321. [DOI] [PubMed] [Google Scholar]
- Schindler BA. Stress, affective disorders, and immune function. Med Clin North Am. 1985;69:585–597. doi: 10.1016/s0025-7125(16)31034-3. [DOI] [PubMed] [Google Scholar]
- Pedersen BK, Kappel M, Klokker M, Nielsen HB, Secher NH. The immune system during exposure to extreme physiologic conditions. Int J Sports Med. 1994;15 Suppl 3:S116–121. doi: 10.1055/s-2007-1021125. [DOI] [PubMed] [Google Scholar]
- McEwen BS. The neurobiology of stress: from serendipity to clinical relevance (1). Brain Res. 2000;886:172–189. doi: 10.1016/S0006-8993(00)02950-4. [DOI] [PubMed] [Google Scholar]
- Elenkov IJ, Chrousos GP. Stress, cytokine patterns and susceptibility to disease. Baillieres Best Pract Res Clin Endocrinol Metab. 1999;13:583–595. doi: 10.1053/beem.1999.0045. [DOI] [PubMed] [Google Scholar]
- Mastorakos G, Ilias I. Maternal hypothalamic-pituitary-adrenal axis in pregnancy and the postpartum period. Postpartum-related disorders. Ann N Y Acad Sci. 2000;900:95–106. doi: 10.1111/j.1749-6632.2000.tb06220.x. [DOI] [PubMed] [Google Scholar]
- Concordet JP, Ferry A. Physiological programmed cell death in thymocytes is induced by physical stress (exercise). Am J Physiol. 1993;265:C626–C629. doi: 10.1152/ajpcell.1993.265.3.C626. [DOI] [PubMed] [Google Scholar]
- Ohtsuka K, liai T, Watanabe H, Tanaka T, Miyasaka M, Sato K, Asakura H, Abo T. Similarities and differences between extrathymic T cells residing in mouse liver and intestine. Cell Immunol. 1994;153:52–66. doi: 10.1006/cimm.1994.1005. [DOI] [PubMed] [Google Scholar]
- Lamontagne L, Massicotte E, Page C. Mouse hepatitis viral infection induces an extrathymic differentiation of the specific intrahepatic alpha-beta-TCR-intermediate LFA-1-high T-cell population. Immunology. 1997;90:402–411. doi: 10.1111/j.1365-2567.1997.00402.x. [DOI] [PMC free article] [PubMed] [Google Scholar]
- Shimizu T, Kawamura T, Miyaji C, Oya H, Bannai M, Yamamoto S, Weerasinghe A, Halder RC, Watanabe H, Hatakeyama K, Abo T. Resistance of extrathymic T cells to stress and the role of endogenous glucocorticoids in stress associated immunosuppression. Scand J Immunol. 2000;51:285–292. doi: 10.1046/j.1365-3083.2000.00695.x. [DOI] [PubMed] [Google Scholar]
- Abo T, Kawamura T, Watanabe H. Physiological responses of extrathymic T cells in the liver. Immunol Rev. 2000;174:135–149. doi: 10.1034/j.1600-065X.2000.174001135.x. [DOI] [PubMed] [Google Scholar]
- Moroda T, Kawachi Y, liai T, Tsukahara A, Suzuki S, Tada T, Watanabe H, Hatakeyama K, Abo T. Self-reactive forbidden clones are confined to pathways of intermediate T-cell receptor cell differentiation even under immunosuppressive conditions. Immunology. 1997;91:88–94. doi: 10.1046/j.1365-2567.1997.00222.x. [DOI] [PMC free article] [PubMed] [Google Scholar]
- Yuuki H, Yoshikai Y, Kishihara K, Iwasaki A, Matsuzaki G, Takimoto H, Nomoto K. Clonal anergy in self-reactive alpha/beta T cells is abrogated by heat-shock protein-reactive gamma/delta T cells in aged athymic nude mice. Eur J Immunol. 1990;20:1475–1482. doi: 10.1002/eji.1830200711. [DOI] [PubMed] [Google Scholar]
- Shapiro SS, Wilk MB. Variance test for normality (complete samples). Biometrica. 1965;52:591. [Google Scholar]
- Stat View 512+ Abacus Concepts Inc. 1986.


