

Abstract
The bone marrow is necessary for renewal of all hematopoietic cells and critical for maintenance of a wide range of physiologic functions. Multiple human diseases result from bone marrow dysfunction. It is also the site in which “liquid” tumors, including leukemia and multiple myeloma, develop as well as a frequent site of metastases. Understanding the complex cellular and microenvironmental interactions that govern normal bone marrow function as well as diseases and cancers of the bone marrow would be a valuable medical advance. Our goal is the development of a spatially-explicit in silico model of the bone marrow to understand both its normal function and the evolutionary dynamics that govern the emergence of bone marrow malignancy.
Here we introduce a multiscale computational model of the bone marrow that incorporates three distinct spatial scales, cell, hematopoietic subunit, whole marrow. Implemented as a fixed lattice 3D cellular automaton, it reproduces the spatial characteristics of the normal bone marrow and is validated against data from the daily production of mature blood cells and response of hematopoiesis after irradiation. The major mechanisms modeled in this work are: (1) replication, specialization and migration of hematopoietic cells, (2) optimized spatial configuration of sinuses and hematopoietic compartments and, (3) intravasation of mature hematopoietic cells into sinuses.
Our results, using parameter estimates from literature, recapitulates normal bone marrow function and suggest an explanation for the fractal-like structure of trabeculae and sinuses in the marrow, which would be an optimization of the hematopoietic function in order to maximize the number of mature blood cells produced daily within the volumetric restrictions of the marrow.
Introduction
The human bone marrow is one of the body’s largest organs occupying the central regions of virtually all long and flat bones. Consisting of a mixture of fat and hematopoietic precursor, the marrow typically produces 500 billion mature blood cells daily (Fliedner et al., 2002).
Hematopoiesis, or the production of mature blood cells in the marrow, is a complex process of replication and specialization of hematopoietic stem cells (HSC) into progenitor cells and finally into functioning mature phenotypes that leave the marrow through a specialized network of vessels called sinusoids (Fliedner et al., 2002; Mazo and von Andrian, 1999; Valarmathi et al., 2009).
Several mathematical and computational models of bone marrow dynamics have previously been developed. Generally, these works either consider the replication and specialization process of cells non-spatially (Adimy and Crauste, 2009; Adimy et al., 2008; Antoniou et al., 2004; Colijn and Mackey, 2005a; Colijn and Mackey, 2005b; Ostby et al., 2003; Smirnova, 2006) or isolate and confine stem, progenitor and mature cells to adjacent layers extending from the bone endosteal surface to the sinus (Bessonov et al., 2008; Bessonov et al., 2009).
In this article we report the initial development of a comprehensive, spatially realistic model of the bone marrow for the study of carcinogenesis and treatment of hematologic malignancies. Our goal is to incorporate the role of the microenvironment (extracellular matrix and stroma) which is believed to be instrumental in controlling the proliferation and maturation processes as well as conferring environment-mediated and acquired resistance (Meads et al., 2008; Meads et al., 2009) to bone marrow malignancies during therapy.
Our model is built on previous work from Colijn et al. (Colijn and Mackey, 2005a) who modeled normal hematopoiesis and periodic chronic myelogenous leukemia, a malignant condition in which levels of mature white cells in blood oscillate well above the normal range. This model incorporated the specialization of hematopoietic cells, possible feedback mechanisms believed to control the levels of the different types of blood cells, and the bone marrow response to perturbations like hemorrhage or wounding.
The model abstracts the spatial dimension of hematopoiesis and thus allows all non-quiescent cells to proliferate in an amplification process culminating in the number of mature blood cells observed in vivo. However, this assumption is not always valid in a spatially constrained bone marrow environment in which proliferation transitions from exponential growth to a nearly linear function at high cell densities when only the cells in the outer layer are able to replicate.
Bessonov et al. (Bessonov et al., 2009) created a spatial model of hematopoiesis in 2D which incorporates a number of additional features including changes in cell diameter during replication and mechanical forces such as compression and pushing of more mature cells by immature proliferating cells towards the sinusoids.
Here we develop a spatial bone marrow model that adds a number of new components to the previous works. Our goal is to obtain a model that incorporates critical aspects of bone marrow physiology including vascular dynamics and spatial distribution of hematopoietic elements within the anatomic limitations of the boney trabeculae (Fig. 1). This model will allow us to examine the interactions of hematopoietic elements of the bone marrow with the underlying mesenchyma including blood vessels, extracellular matrix, boney endosteum, and fibroblasts. In part we are motivated to develop a spatially and anatomically accurate depiction of the bone marrow and overcome limitations of previous models which have separated the hematopoietic function from the spatial constraints of the marrow. In addition, there is growing evidence that cellular and physical microenvironment plays a critical role in the bone marrow during normal function as well as in tumor infiltration and response to therapy.
Figure 1.

In (A) a long bone is depicted with an arterial vessel which feeds the marrow and vein that transports the mature hematopoietic cells recently produced in the marrow. (B) Shows a simplified view of a long bone cross-section where the central sinus, which collects the mature blood cells, is located in the center of the marrow and the hematopoietic stem cells are located in the endosteum which is the smooth surface of bone at the interface of the marrow and compact bone. This is the classical bone marrow model used for hematopoiesis. (C) Shows a more realistic cross-section of a long bone in which the marrow is immersed in a sieve-like structure of bony trabeculae (c1) which create chambers that are connected to the central sinus (c2) through a branching structure of sinusoids (c3).
A major goal of this work was the development of an accurate depiction of the morphology of the bone marrow vasculature. The simplified model of bone marrow vasculature typically used in theoretical models is shown in the upper cartoon of Fig 1. However, it is clear from observations using vital microscopy and plastic injection in bone marrow blood vessels (Albrektsson and Albrektsson, 1978; Branemark, 1959; Fliedner et al., 2002) that the sinusoids actually have a complex branched structure.
Our work was also guided by published data on replication and specialization of bone marrow stem cells (Passegue et al., 2005) and in vivo imaging of the bone marrow microenvironment (Albrektsson and Albrektsson, 1978; Bourke et al., 2009; Calvi et al., 2003; Kubota et al., 2008; Li et al., 2008; McClugage et al., 1971; Nilsson et al., 2001; Watchman et al., 2007; Yahata et al., 2008; Yin and Li, 2006; Zhang et al., 2003).
To validate our models we simulated the bone marrow’s response to radiation and compared our results with data from Fliedner et al. (Fliedner et al., 2002) who measured the levels of blood cells in subjects following exposure to whole body radiation.
Materials and Methods
Theoretical Model of Hematopoiesis
The classic model of hematopoiesis as depicted in Fig 2, stem cells located in the endosteum niche proliferate either symmetrically or asymmetrically according to still not completely known regulatory mechanisms. Normal bone marrow function maintains a stable stem cell population while producing sufficient progenitor cells to maintain optimal blood levels of red cells, white cells, and platelets (Adams et al., 2006; Calvi et al., 2003; Eliasson and Jonsson, 2010; Yin and Li, 2006; Zhang et al., 2003) thus ensuring blood homeostasis. Other niches of hematopoiesis are proposed, such as the sinusoids or perivascular, but these have not yet been fully characterized (Kiel and Morrison, 2008) and were therefore not incorporated in to the current model.
Figure 2.

In the classic model of hematopoiesis, the stem cells generate progenitor cells that in turn replicate and specialize until they reach maturity and are collected by sinusoids and leave the marrow. This model, however, cannot be reproduced spatially as the number of cells in each layer is double that of the previous one which would either mix cells in different stages of maturity or create a funnel with one stem cell in the apex and approximately 65,000 mature cells in the base close to the sinus. Thus, this configuration is not optimized for space and is physiological unfeasible. The model proposed in this work suggests that the marrow is composed of multiple subunits, each of them composed of 10 or more stem cells, one proliferative and the others quiescent, perfused by a branching network of sinusoids that are permeable only to mature cells. This structure has the advantage of not requiring a hierarchical spatial distribution of the hematopoietic cells and also optimizes the intravasation of mature cells.
The classic model depicted in Fig 2 shows a stem cell generating progenitor cells that in turn replicate and mature in a gradual process that creates increasingly mature cells along the path from the bone to the sinusoids. This model, however, is spatially unfeasible as each generation would have twice as many cells as the previous, and thus eventually there would be insufficient space in the marrow for them.
The second model of Fig 2 is the one developed here. In this model the sinusoid network reaches into the hematopoietic niches, collecting mature cells from different distances within the bone, eliminating the potential spatial constraint discussed above. This alternative architecture also optimizes the production of mature cells, as will be quantified below.
As a minimal requirement, the model must capture normal bone marrow hematopoietic function. It is estimated that the daily production of mature blood cells is 500×109 (Fliedner et al., 2002) with an hematopoietic stem cell (HSC) population of 80×106 of which 10% are actively replicating (Colijn and Mackey, 2005a). Thus, each proliferating HSC would form a hematopoietic subunit with daily a production of approximately 62,500 mature blood cells.
The cell cycle times of HSC, the proportion of symmetric and asymmetric replications are described in figure 3 and were considered constant during normal hematopoiesis. Three blood cell lineages are modeled: erythrocytes (RBPC, 5% of the progenitor cells and 19 generations required for maturation), granulocytes (GPC, 23% of the progenitor cells and 16 generations required for maturation) and platelets (PPC, 7% of the progenitor cells and 18 generations required for maturation).
Figure 3.
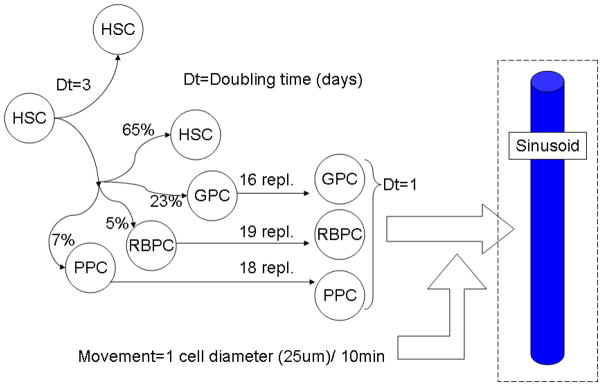
A stem cell may replicate symmetrically and yield two identical stem cells or asymmetrically and generate one stem cell and one progenitor cell. This progenitor cell may give rise to a granulocyte, erythrocyte or platelet lineage of cells, each of them requiring a certain number of replications before reaching maturity. Besides replicating, cells can also move randomly. The probability of replication and specialization were obtained as described in text and represent a steady-state, decreases in the concentration of mature blood cells in circulation are believed to feed back in these probabilities in order to reestablish normal levels. This feedback mechanism however is not modeled in this work. A sinusoid wall will absorb any mature cell immediately in its neighborhood (within the distance of 1 cell diameter).
The proportion of progenitor cells for each lineage was based on experimental estimates of the numbers of cells produced daily for each lineage (120×109 for granulocytes, 200×109 for erythrocytes and 150×109 for platelets, (Bessonov et al., 2009; Colijn and Mackey, 2005a; Fliedner et al., 2002)) and the number of replications before reaching maturity.
Computational Model of Hematopoiesis
The computational model develop here was implemented as a cellular automaton in three dimensions using the software TSim (Tissue Simulator, http://www.i-genics.com), previously described (Silva et al., 2009; Silva et al., 2010).
One of the main features of this software is its ability to bridge intracellular and tissue scales, simulating metabolism, replication, apoptosis and cell movement according to the cell genotype but also considering the extracellular stimuli such as growth factors, pHe (extracellular pH), nutrients and gas levels. These species are assumed to diffuse through the interstitial fluid and be consumed or produced by the different cells composing the simulated tissue. Other structures such as compact bone, arterial vessels and sinusoids are also modeled by defining these units as incompressible barriers, volumes with fixed concentrations of oxygen and nutrients, and sinks of mature hematopoietic cells, respectively.
The current implementation of this software, however, has some limitations, such as (1) all cells have the same dimensions, when hematopoietic cells can vary from 5 (erythrocytes and mast cells) to 25 um (granulocytes), (2) cell size does not change during replication and (3) mechanical forces are not represented and cells are incompressible. We may expect that our approximations will result in a reduction in cellularity (on the order of 2–3 fold) in the simulated marrow as compared to the real marrow, as well as less motility of smaller cells, which in the real marrow should be able to “squeeze” into spaces where the bigger cells cannot.
In future versions of this software, compressibility of cells will be incorporated as well as lattice-free placement of cells and the real extent of the influences of these factors will then be assessed. However, even in lattice-free models with compressible cells, the simulated cells appear to find a minimum energy lattice configuration (Bessonov et al., 2009). The algorithm of the simulation of this model is briefly described in table 1 and reproduced in pseudo-programming language in the Appendix A.
Table 1.
Algorithm implemented in software TSim for simulation of hematopoietic model. The first column shows the time scale of the event being modeled. The middle column describes the implementation of each of the tasks for this simulation (in bold italic) and the last column describes the output of each of these operations.
| Time scale for each step | Actions | Results |
|---|---|---|
| Days |
Compute
Simulation: For days 1 to N, do:
|
N snapshots of steady states of hematopoiesis; |
| 10 min |
Compute
Movement: For each cell in the model, except for the HSC do:
|
Updated spatial rearrangement of cells and production of cells into blood; |
| 10 min |
Compute Sinus
Intravasation: If the cell is mature then remove it from the simulation space and increase the counter of mature blood cells produced of that type for that hematopoietic subunit. |
Updated simulation space with an empty slot instead of the mature blood cell and incremented counter of mature blood cells produced; |
| 10 min |
Compute
Replication:
|
Simulation space with daughter cells which can be stem cells, progenitor cells or immature blood cells. |
In the context of this model, the human bone marrow is viewed as one organ separated into multiple bones and, within each bone, further divided into independent subunits composed of stem cells, progenitor cells and sinuses. Each of these subunits self-regulates its daily production of blood cells based on equilibrium between proliferation, maturation, motility and intravasation into the sinuses. We consider this subunit as the minimum hematopoietic subunit of the bone marrow model we develop.
Our first proposed geometry was the classical model where stem cells are located at the endosteum and produce progenitor cells that move in waves of specialization until they reach the sinus (figure 2). However, we found that this organization is not capable of producing the amount of cells per stem cell that is observed in real marrow, unless the distance between the stem cell and the sinusoid is increased to non-physiological values (centimeters). Placing the sinusoids at distance N-layers away from the endosteum, where N is the number of generations required to reach maturity, also poses the problem that some mature cells may eventually get trapped among immature cells and be unable to reach the sinusoids until their neighbors also reach maturity, and are transported out of the marrow themselves.
Considering these results, we searched for a spatial organization of the sinusoids that would maximize the surface of contact with the hematopoietic population without increasing the distance to the stem cell population, and hence the volume of the marrow, thus keeping the bone compact and able to collect mature cells from different locations in the marrow. Our solution was achieved using the architecture proposed in figure 4. In this model the sinusoids follow a forking pattern that probes into the hematopoietic compartment from where it co-opts the mature stem cells. This design is also similar to heat dissipaters used in microprocessors in order to maximize heat exchange by increasing the surface contact with the air.
Figure 4.

Implementation of the minimum hematologic subunit composed of 9–10 stem cells next to the endosteum and a network of sinusoids reaching through the entire volume (top). The dimensions (bottom) were determined from the calculations discussed in the text above; the units are in cell diameters. The bone is not part of the simulations and thus is not visible in the 3D view (top).
In our model, each HSC may replicate symmetrically or asymmetrically as described in figure 3. The doubling time for each HSC was fixed at three days (Colijn and Mackey, 2005a), after which one of the daughter cells will be a stem cell and the other would have 65% of chance of being a stem cell and 35% of chance of becoming a progenitor cell (23% for a granulocyte progenitor cell, 5% for a erythrocyte progenitor cell and 7% for a platelet progenitor cell). Each of these progenitor cells has its own number of replications until they reach maturity and are able to enter the nearest sinusoid.
The mechanism through which the specialization of stem cells into different lineages is not modeled in this work, as our focus is to model the spatial configuration of the hematopoietic subunit, and not the underlying mechanisms of hematopoietic differentiation. The number of cells within the marrow is limited by its volume; the spatial restriction providing a feedback mechanism that prevents exponential growth of the intra-marrow population and imposing competition among the different lineages for proliferation and production of mature blood cells.
Besides replicating, cells can also move randomly with a speed of 2.5um/minute towards a vacant volume or into a neighboring sinusoid. This rate was estimated from Brownian movement of an average mammalian cell in water (Bray, 2001). Considering that each cell in the model has the length of 25um, this means that each cell will randomly cover 6 diameters in one hour.
The maximum uptake of a sinusoid is thus four times its length (by approximating sinusoids and cells as being cubic structures) per 10 minutes. In order to transport 62,500 mature cells in one day, the sinusoids of an hematopoietic subunit would need a surface of 62,500 cells/(4 cells × 24h × 6x pMature)=108/pMature cell lengths in direct contact with mature cells, where pMature is the proportion of mature cells from the total hematopoietic population in the marrow. The volume of each subunit may be estimated from the weight of the hematopoietic share of the marrow, which is approximately 1,400g for a 70kg adult (Fliedner et al., 2002). This mass would correspond to an approximate volume of 1,400 cm3 which split by 8 million hematopoietic subunits would give approximately 10,000 cells per subunit. Considering that cells shrink (during hematopoiesis and replication), which is not implemented in this model, we triple this number and estimate that approximately 30,000 hematopoietic cells are produced in each subunit. Our first simulations showed that approximately 2/3 of the cells in the compartment are mature cells (pMature=0.67) and that a volume of approximately 37,000 cells (42×42×21) in combination with a sinusoid surface of at least 162 cell areas are required to produce a daily yield of 62,500 cells. The subunit was thus implemented according to these specifications as illustrated in figure 4.
The diameter of the sinusoids was assumed to match the diameter of the standard cell modeled as measured in vivo: 15um for sinusoids and 12um for venules (Fliedner et al., 2002). The microvessel density was reported to be 75 microvessels/mm2 for animal models (De Raeve et al., 2004), and 59.5 (ranging from 17–140) and 25.1 (ranging from 0–60) microcvessels/mm2 for patients with multiple myeloma before and after treatment, respectively (Sezer et al., 2001). Biopsies in asymptomatic patients showed on average a microvessel density of 5 microvessels/mm2 (Watchman et al., 2007). The configuration of sinusoids in figure 4 is of 25 microvessels/mm2 which is within physiological ranges, event though the measurements from literature do not differentiate the arterial vessels and sinusoids.
We simulated this model with subunits initially identical, from the configuration of figure 4, for 50 days (consisting of 7,200 simulation steps). Each simulation step was 10 minutes long, during which one cell could move to a neighboring slot in space, replicate or enter a neighboring sinusoid if they were mature.
Cell movement was random and replication was implemented as a probability that was tested at every simulation step. For progenitor and immature cells, the cell cycle was estimated at one day, and the probability that one cell would replicate at a given moment within the length of its population’s doubling time, was modeled as an exponential function ( ) starting at zero at the beginning of the cell cycle and reaching one at the end of the doubling time (see Appendix A for details). Using these parameters, the probability of replication measured at any given 10-minute interval should be . The same probability was calculated as 0.16% for stem cells which double every three days and remain quiescent 9 cycles out of 10.
Results
Four sample outputs of hematopoietic subunits among those simulated are shown in figure 5, where HSC are shown in white, immature granulocytes in blue, immature erythrocytes in pink, immature platelets in green and mature cells of the three types are shown in cyan. All subunits eventually reach a state where two thirds of the cells are in mature state, even though the temporal development and spatial distribution vary among the three lineages between the simulated subunits. Human biopsies show that the percentage of hematopoietic cell lineages in the marrow varies with age but that approximately 40–65% of the hematopoietic cells are mature granulocytes and erythrocytes (Orazi et al., 2006), which is in accordance with the model results.
Figure 5.

Simulation of four different hematopoietic subunits starting with the same initial configuration (9 stem cells) after 20 days. In white are stem cells, in blue immature granulocytes, in red immature erythrocytes, in green immature platelets and in cyan mature cells of the three cell lines able to intravasate into the sinusoids. Each subunit produces different quantities of mature blood cells of each lineage but on average they produce the three lineages at a stable rate according to the whole body needs.
The average simulated output obeys the required share as shown in figure 6, with a daily production of approximately 47,400 cells (19,900 erythrocytes, 15,780 granulocytes and 11,740 platelets), giving the whole body daily production of 379×109 cells (159×109 erythrocytes, 122×109 granulocytes and 94×109 platelets). This is a good approximation of what happens in real marrow, given the simplifications of this model and the scaling required for changing from a subunit of a few thousands of cells to a system, with a complex geometry, with hundreds of billions of cells.
Figure 6.

Normal and post-irradiation hematopoiesis. (A) The number of hematopoietic cells at different stages of differentiation in each of the three lineages per hematopoietic subunit. (B) The daily production of mature blood cells per hematopoietic subunit calculated.(C) The accumulated production of mature blood cells by a single hematopoietic subunit over 50 days. The results of A, B and C are the average of ten independent simulations. (D) The decrease in production of mature hematopoietic cells after irradiation, modeled as eradication of the stem cell population but no harm to the progenitor and mature cells.
Although erythrocytes originate from only 5% of HSC asymmetrical divisions-in contrast with 7% and 23% for megakaryocytes and granulocytes, respectively- our model shows that the red blood cell lineage is responsible for 40% of the cells in the marrow and 42% of the daily production of mature blood cells. The explanation for this apparent paradox comes from calculating the number of mature blood cells produced per HSC asymmetric division, which is (0.05)×219=26,200 for RBC, (0.07)×218=18,350 for PBC and (0.23)×216=15,000 for GBC. Thus, the higher the number of replications before attaining maturity and leaving the marrow, the bigger will be the share of a certain lineage within the marrow population and in blood.
A second test for this model was the recovery after irradiation. Hematopoietic cells respond to radiation with different levels of resistance depending on their maturation stage: fully mature quiescent cells have a D0 (radiation dose that kills 63% of the population) of 50Gy while HSC and progenitor cells have a D0 of approximately 1Gy (Fliedner et al., 2002). This differential response was used to test the current model by comparing the levels of hematopoietic cells produced after simulated radiation exposure with data from the literature on patients exposed to radiation. To approximate an intermediate treatment of say 5Gy in the simulations, we simply removed all the HSC from the subunits after six days of hematopoiesis and used the resulting subunits to initialize new simulations with only the progenitor and mature cells for a further 20 days.
The lower graph in figure 6 shows the simulated results. As expected, the daily delivery of mature cells to the blood decreases with time and is eventually negligible around 10 days. These results agree well with observations from victims of radiation, who have marrows that cannot recover and eventually have negligible production of granulocytes after 6 days and platelets after 10 days after exposure.
Conclusion
In this work we approached the problem of hematopoiesis from a systems perspective by developing a bone marrow model that was realistically based on the anatomic and physiologic restrictions of the human bone marrow. To validate our model, we compared simulation results with the behavior of normal marrow under physiological conditions and after irradiation.
In the proposed model, the marrow is composed of multiple self-regulating subunits that produce and deliver mature blood cells into the sinusoids. Each subunit produces slightly different numbers of blood cells, but as a whole reliably renews the blood cell population maintaining the proportions found in vivo. When perturbed by radiation (which is believed to be more deadly for the stem cell population than the progenitor or mature cells) these modeled subunits respond similar to data from humans following radiation exposure. We find this multiscale organization of the marrow structure both intuitive and computationally ideal for understanding the dynamics of bone marrow and hematopoiesis.
This work also gives insights into the “sieve-like” structure of the marrow bone, in which trabeculae protrude in structures similar to fractals. We propose that this is an optimization of the internal bone surface with the goal of better using the volume available in the marrow to produce the most mature cells within the space and time restrictions imposed by the marrow anatomy.
Our next step will be to incorporate cytokines mediated movement, replication and specialization. We will also include metabolism of glucose in order to simulate the effects of hypoxia and low pH in hematopoiesis and later in carcinogenesis.
In this work the actual mechanism for which immature hematopoietic cells remain in the marrow, even when they are in the proximity of a sinusoid, is not modeled. However, relaxing the requirement for immature cells to be located far from sinusoids to prevent leakage into the blood stream, has allowed us to propose a spatial hematopoietic architecture which is closer to what is observed in vivo. Some authors (Fliedner et al., 2002; Furze and Rankin, 2008; Jain, 1993) have proposed that the bigger size, lack of malleability, electric charge or lack of receptors for chemo-attractants in immature cells, in contrast with smaller mature cells, would be the reason for which they would only be able to migrate to bloodstream in conditions of stress such as shock or endotoxemia. In future versions of this work’s model, where chemotaxis, lattice-freedom and cell size variability will be implemented, these questions might be addressed more thoroughly.
Our ultimate goal with this project is to build a model of the marrow microenvironment were the interactions between cancer cells, stroma and extracellular matrix, quantified in different experiments in vivo, can be merged together and used to understand the process of acquired resistance.
Acknowledgments
This work was funded by Moffitt Cancer Center PS-OC NIH/NCI 1U54CA143970-01 and International Myeloma Foundation Brian D. Novis Research Award Junior Grant.
Appendix A: Hematopoietic Model Algorithm
The algorithm below describes the model used in this article. The actual software used for the simulation is available for download at www.i-genics.com along with the source code, the simulation files used in this article and movies of some of the simulation results.
-
1
Create a tridimensional data structure with dimensions x, y and z as described in the figure 4, including hematopoietic stem cells, sinusoids and vacant space. This will be our working data structure. For this article, x, y and z correspond to 21, 42 and 42, respectively.
-
2
Repeat the steps below N times, where N is the number of days for the simulation:
-
2.1
Repeat the steps below M times, where N/M is the time step simulated. In this work, M was 144, which corresponds to 24h*60′/144=10′. Thus, each simulation step corresponds to 10 minutes in real time:
-
2.1.1
Create a new empty data structure with dimensions x, y and z. This will be our temporary data structure;
-
2.1.2
Create a list of references to all the elements in the working data structure and shuffle their order randomly;
-
2.1.3
For each reference in the list do:
-
2.1.3.1
If the reference points to a vacant space, do nothing;
-
2.1.3.2
If the reference points to a sinusoid, copy its data into the corresponding slot into the temporary data structure;
-
2.1.3.3
If the reference corresponds to a cell, then:
-
2.1.3.3.1
If the cell is not a stem cell:
-
2.1.3.3.1.1
Test if the cell may move:
-
2.1.3.3.1.1.1
Search among the six neighbors around the cell if there is a vacant slot or a sinusoid.
-
2.1.3.3.1.1.2
If one of the neighbors is a sinusoid and the cell replication counter is at its maximum level (mature blood cell), remove the cell from the working data structure and increase the number of mature blood cells of the lineage produced by the marrow and delivered to bloodstream.
-
2.1.3.3.1.1.3
Otherwise, if there is a vacant slot in the direct vicinity of a cell, copy the data from the cell to the new slot in space and erase it from the old slot. Copy the data into the corresponding slot of the temporary data structure.
-
2.1.3.3.1.2
Test if the cell may replicate:
-
2.1.3.3.1.2.1
If the replication counter of the cell is lower than the maximum number of replications allowed (16 for granulocytes, 19 for erythrocytes and 18 for megakaryocytes) proceed to the next step, otherwise the cell is not allowed to replicate.
-
2.1.3.3.1.2.2
Given the doubling time of a cell, Dt, and the time step of the simulation dt, then the probability that a cell replicates during the simulated time step dt is .
-
2.1.3.3.1.2.3
According to the term above, derived from a binomial expansion, a population with N0 cells at time t0, with a doubling time Dt and simulated with time steps dt, will have at time
-
2.1.3.3.1.2.4
In this article, non-stem cells have a doubling time Dt=1 day and every simulation step corresponds to 10 minutes, thus , which means that at every simulated step a non-stem cell has a chance of 0.48% of replicating.
-
2.1.3.3.1.2.5
Generate a random number between 0 and 1 using a uniform distribution. If the number is lower than or equal to p, the cell may replicate if there is one adjacent vacant slot in the working data structure. In this case, copy the data from the mother cell into the corresponding slot in the temporary data structure and increment the replication counter of both “mother” and “daughter” cells;
-
2.1.3.3.2
If the cell is an hematopoietic stem cell:
-
2.1.3.3.2.1
Test if the cell may replicate by computing the probability of replication using as parameters the doubling (Dt) time and the simulation time step (dt), as done for progenitor cells;
-
2.1.3.3.2.2
In this article, the doubling time of hematopoietic stem cells is considered as three days, thus the probability of replication, p, at every simulated stesp is equal to
-
2.1.3.3.2.3
Test if there is a vacant slot in the vicinity of the cell in the working data structure. If true, generate a random number with a uniform distribution between 0 and 1. If the number is equal to or lower than 0.65, the daughter cell will be another stem cell. If the number is between 0.65 and 0.7 the daughter cell will be an erythrocyte progenitor cell. If the number is above 0.7 and below 0.77 the cell will be a megakaryocyte progenitor cell. Otherwise, it will be a granulocyte progenitor cell, as described in text and depicted in figure 3.
-
2.1.3.3.2.4
If a progenitor cell is generated, update the type of cell from stem cell to progenitor cell and set its replication counter to zero;
-
2.1.3.3.2.4.1
Copy the “mother” and “daughter” cells into the corresponding slots of the temporary data structure;
-
2.1.4
Discard the working data structure and use the temporary data structure as the new working data structure for the next simulation step;
References
- Adams GB, Chabner KT, Alley IR, Olson DP, Szczepiorkowski ZM, Poznansky MC, Kos CH, Pollak MR, Brown EM, Scadden DT. Stem cell engraftment at the endosteal niche is specified by the calcium-sensing receptor. Nature. 2006;439:599–603. doi: 10.1038/nature04247. [DOI] [PubMed] [Google Scholar]
- Adimy M, Crauste F. Mathematical model of hematopoiesis dynamics with growth factor-dependent apoptosis and proliferation regulations. Mathematical and Computer Modelling. 2009;49:2128–2137. [Google Scholar]
- Adimy M, Angulo O, Crauste F, Lopez-Marcos JC. Numerical integration of a mathematical model of hematopoietic stem cell dynamics. Computers and Mathematics with Applications. 2008;56:594–606. [Google Scholar]
- Albrektsson T, Albrektsson B. Microcirculation in grafted bone. A chamber technique for vital microscopy of rabbit bone transplants. Acta Orthop Scand. 1978;49:1–7. doi: 10.3109/17453677809005716. [DOI] [PubMed] [Google Scholar]
- Antoniou ES, Sund S, Homsi EN, Challenger LF, Rameshwar P. A theoretical simulation of hematopoietic stem cells during oxygen fluctuations: prediction of bone marrow responses during hemorrhagic shock. Shock. 2004;22:415–22. doi: 10.1097/01.shk.0000142185.88094.88. [DOI] [PubMed] [Google Scholar]
- Bessonov N, Pujo-Menjouet L, VV Cell Modelling of Hematopoiesis. Math Model Nat Phenom. 2008;2:81–103. [Google Scholar]
- Bessonov N, Demin I, Pujo-Menjouet LVV. A multi-agent model describing self-renewal of differentiation effects on the blood cell population. Mathematical and Computer Modelling. 2009;49:2116–2127. [Google Scholar]
- Bourke VA, Watchman CJ, Reith JD, Jorgensen ML, Dieudonne A, Bolch WE. Spatial gradients of blood vessels and hematopoietic stem and progenitor cells within the marrow cavities of the human skeleton. Blood. 2009;114:4077–80. doi: 10.1182/blood-2008-12-192922. [DOI] [PMC free article] [PubMed] [Google Scholar]
- Branemark PI. Vital microscopy of bone marrow in rabbit. Scand J Clin Lab Invest. 1959;11:1–82. [PubMed] [Google Scholar]
- Bray D. Cell movements: from molecules to motility. Garland Science; New York: 2001. [Google Scholar]
- Calvi LM, Adams GB, Weibrecht KW, Weber JM, Olson DP, Knight MC, Martin RP, Schipani E, Divieti P, Bringhurst FR, Milner LA, Kronenberg HM, Scadden DT. Osteoblastic cells regulate the haematopoietic stem cell niche. Nature. 2003;425:841–6. doi: 10.1038/nature02040. [DOI] [PubMed] [Google Scholar]
- Colijn C, Mackey MC. A mathematical model of hematopoiesis--I. Periodic chronic myelogenous leukemia. J Theor Biol. 2005a;237:117–32. doi: 10.1016/j.jtbi.2005.03.033. [DOI] [PubMed] [Google Scholar]
- Colijn C, Mackey MC. A mathematical model of hematopoiesis: II. Cyclical neutropenia. J Theor Biol. 2005b;237:133–46. doi: 10.1016/j.jtbi.2005.03.034. [DOI] [PubMed] [Google Scholar]
- De Raeve HR, Asosingh K, Wisse E, Van Camp B, Van Marck E, Vanderkerken K. Part of the multiple myeloma-associated microvessels is functionally connected to the systemic circulation: a study in the murine 5T33MM model. Virchows Arch. 2004;445:389–95. doi: 10.1007/s00428-004-1064-7. [DOI] [PubMed] [Google Scholar]
- Eliasson P, Jonsson JI. The hematopoietic stem cell niche: low in oxygen but a nice place to be. J Cell Physiol. 2010;222:17–22. doi: 10.1002/jcp.21908. [DOI] [PubMed] [Google Scholar]
- Fliedner TM, Graessle D, Paulsen C, Reimers K. Structure and function of bone marrow hemopoiesis: mechanisms of response to ionizing radiation exposure. Cancer Biother Radiopharm. 2002;17:405–26. doi: 10.1089/108497802760363204. [DOI] [PubMed] [Google Scholar]
- Furze RC, Rankin SM. Neutrophil mobilization and clearance in the bone marrow. Immunology. 2008;125:281–8. doi: 10.1111/j.1365-2567.2008.02950.x. [DOI] [PMC free article] [PubMed] [Google Scholar]
- Jain NC. Essentials of veterinary hematology. Wiley-Blackwell; 1993. [Google Scholar]
- Kiel MJ, Morrison SJ. Uncertainty in the niches that maintain haematopoietic stem cells. Nat Rev Immunol. 2008;8:290–301. doi: 10.1038/nri2279. [DOI] [PubMed] [Google Scholar]
- Kubota Y, Takubo K, Suda T. Bone marrow long label-retaining cells reside in the sinusoidal hypoxic niche. Biochem Biophys Res Commun. 2008;366:335–9. doi: 10.1016/j.bbrc.2007.11.086. [DOI] [PubMed] [Google Scholar]
- Li XM, Hu Z, Jorgenson ML, Wingard JR, Slayton WB. Bone marrow sinusoidal endothelial cells undergo nonapoptotic cell death and are replaced by proliferating sinusoidal cells in situ to maintain the vascular niche following lethal irradiation. Exp Hematol. 2008;36:1143–1156. doi: 10.1016/j.exphem.2008.06.009. [DOI] [PubMed] [Google Scholar]
- Mazo IB, von Andrian UH. Adhesion and homing of blood-borne cells in bone marrow microvessels. J Leukoc Biol. 1999;66:25–32. doi: 10.1002/jlb.66.1.25. [DOI] [PubMed] [Google Scholar]
- McClugage SG, Jr, McCuskey RS, Meineke HA. Microscopy of living bone marrow in Situ. II. Influence of the microenvironment on hemopoiesis. Blood. 1971;38:96–107. [PubMed] [Google Scholar]
- Nilsson SK, Johnston HM, Coverdale JA. Spatial localization of transplanted hemopoietic stem cells: inferences for the localization of stem cell niches. Blood. 2001;97:2293–9. doi: 10.1182/blood.v97.8.2293. [DOI] [PubMed] [Google Scholar]
- Orazi A, O’Malley DP, Arber DA. Illustrated Pathology of the Bone Marrow. Cambridge University Press; New York: 2006. [Google Scholar]
- Ostby I, Benestad HB, Grottum P. Mathematical modeling of human granulopoiesis: the possible importance of regulated apoptosis. Math Biosci. 2003;186:1–27. doi: 10.1016/j.mbs.2003.07.003. [DOI] [PubMed] [Google Scholar]
- Sezer O, Niemoller K, Kaufmann O, Eucker J, Jakob C, Zavrski I, Possinger K. Decrease of bone marrow angiogenesis in myeloma patients achieving a remission after chemotherapy. Eur J Haematol. 2001;66:238–44. doi: 10.1034/j.1600-0609.2001.066004238.x. [DOI] [PubMed] [Google Scholar]
- Silva AS, Yunes JA, Gillies RJ, Gatenby RA. The potential role of systemic buffers in reducing intratumoral extracellular pH and acid-mediated invasion. Cancer Res. 2009;69:2677–84. doi: 10.1158/0008-5472.CAN-08-2394. [DOI] [PMC free article] [PubMed] [Google Scholar]
- Silva AS, Gatenby RA, Gillies RJ, Yunes JA. A quantitative theoretical model for the development of malignancy in ductal carcinoma in situ. J Theor Biol. 2010;262:601–613. doi: 10.1016/j.jtbi.2009.10.031. [DOI] [PubMed] [Google Scholar]
- Smirnova OA. Mathematical modeling the radiation effects on humoral immunity. Advances in Space Research. 2006;37:1813–1822. [Google Scholar]
- Valarmathi MT, Davis JM, Yost MJ, Goodwin RL, Potts JD. A three-dimensional model of vasculogenesis. Biomaterials. 2009;30:1098–112. doi: 10.1016/j.biomaterials.2008.10.044. [DOI] [PubMed] [Google Scholar]
- Watchman CJ, Bourke VA, Lyon JR, Knowlton AE, Butler SL, Grier DD, Wingard JR, Braylan RC, Bolch WE. Spatial distribution of blood vessels and CD34+ hematopoietic stem and progenitor cells within the marrow cavities of human cancellous bone. J Nucl Med. 2007;48:645–54. doi: 10.2967/jnumed.106.035337. [DOI] [PubMed] [Google Scholar]
- Yahata T, Muguruma Y, Yumino S, Sheng Y, Uno T, Matsuzawa H, Ito M, Kato S, Hotta T, Ando K. Quiescent human hematopoietic stem cells in the bone marrow niches organize the hierarchical structure of hematopoiesis. Stem Cells. 2008;26:3228–36. doi: 10.1634/stemcells.2008-0552. [DOI] [PubMed] [Google Scholar]
- Yin T, Li L. The stem cell niches in bone. J Clin Invest. 2006;116:1195–201. doi: 10.1172/JCI28568. [DOI] [PMC free article] [PubMed] [Google Scholar]
- Zhang J, Niu C, Ye L, Huang H, He X, Tong WG, Ross J, Haug J, Johnson T, Feng JQ, Harris S, Wiedemann LM, Mishina Y, Li L. Identification of the haematopoietic stem cell niche and control of the niche size. Nature. 2003;425:836–41. doi: 10.1038/nature02041. [DOI] [PubMed] [Google Scholar]