

Abstract
Objective
To describe age and sex patterns of drug prescribing in Olmsted County, MN. Prescription drugs are an important component of health care delivery, yet little is known about the prescribing patterns in the general population.
Patients and Methods
Population-based drug prescription records for the Olmsted County population in the year 2009 were obtained using the Rochester Epidemiology Project medical records-linkage system (n = 142,377). Drug prescriptions were classified using RxNorm codes and grouped using the National Drug File – Reference Terminology (NDF-RT).
Results
Overall, 68% of the population received a prescription from at least one drug group, 52% received prescriptions from 2 or more groups, and 21% received prescriptions from 5 or more groups. The most commonly prescribed drug groups in the entire population were penicillins and beta-lactam antimicrobials (17%), antidepressants (13%), opioid analgesics (12%), antilipemic agents (11%), and vaccines/toxoids (11%). However, prescribing patterns differed by age and sex. Vaccines/toxoids, penicillins and beta-lactam antimicrobials, and anti-asthmatic drugs were most commonly prescribed in persons younger than 19 years. Antidepressants and opioid analgesics were most commonly prescribed in young and middle-aged adults. Cardiovascular drugs were most commonly prescribed in older adults. Women received more prescriptions than men for several groups of drugs, in particular for antidepressants. For several groups of drugs, the use increased with advancing age.
Conclusion
This study provides valuable baseline information for future studies of drug utilization and drug-related outcomes in this population.
Keywords: drug prescription, prevalence, population-based study, records-linkage system, age and sex differences in drug use, pharmacoepidemiology
INTRODUCTION
Prescription drug use has increased steadily in the US over the last decade. The percent of people who took at least one prescription drug in the past month increased from 44% in 1999 - 2000 to 48% in 2007 - 2008.1 This increased use resulted in increased spending on prescription drugs, which reached $250 billion in 2009, and accounted for 12% of the total personal health care expenditures.2 Drug-related spending is expected to continue to grow in the coming years.2
Quantification of drug prescribing patterns in the general population is important for a number of reasons. Prescription drug abuse has become the fastest growing drug problem in the United States.3,4 Medication-related adverse outcomes in US hospitals and emergency departments increased 52% from 2004 to 2008.5 In addition, drug prescribing patterns may serve as indirect measures of the burden of diseases in a population.6,7 Prescribing patterns also vary considerably across geographic regions,8-10 and may serve as a proxy for health system performance.
A number of studies have described patterns of drug prescriptions in some countries including Sweden, Spain, and Canada. 11-13 However, there are few population-based studies of prescription drugs in the US because of the lack of a centralized health care data system.14 Some of the published US studies were conducted decades ago, and may not reflect current prescription patterns.15-24 More recent studies included only the Medicare eligible elderly, or individuals with health insurance coverage.25,26 In this study, we examined the outpatient drug prescribing patterns for the entire Olmsted County, MN population in 2009, using the Rochester Epidemiology Project (REP), a medical records-linkage system which captures virtually all the health care visit information for the entire population.27-30
PATIENTS AND METHODS
Study Population
All individuals residing in Olmsted County between January 1 and December 31, 2009 were identified using the REP Census (n = 146,687);27 and those who had given research authorization were included in this study (n = 142,377; 97.1%). The number of people included in this study represented 98.7% of the Olmsted County population predicted to reside in this county by the US Census, and age and sex distributions were virtually identical to those of the US Census estimates.28 Additional details about the population of Olmsted County and about the REP have been published elsewhere.27-30
Drug Prescription Records
Outpatient drug prescriptions written for the study population between January 1 and December 31, 2009 were obtained from the Mayo Clinic and the Olmsted Medical Center and were linked to specific subjects into the records-linkage system (n = 663,736 prescription records). As described elsewhere, these 2 institutions provide most of the medical care for the Olmsted County residents.27-30 Since 2002, both institutions implemented proprietary electronic prescription systems in the outpatient settings, i.e. office visits or hospital outpatient settings. Electronic prescriptions in 2009 were retrieved from the proprietary systems and converted into RxNorm codes retrospectively. The prescriptions were then grouped using the National Drug File – Reference Terminology (NDF-RT) classification system.31,32 Combination drugs with multiple ingredients were counted once under the NDF-RT category of the main ingredient or, if applicable, under the combination drug category.
Approximately 2% (n = 12,576) of the prescription records were excluded because they lacked specific descriptions, and could not be assigned to a NDF-RT class. All the remaining prescriptions were grouped into 28 NDF-RT classes. In this study, we focused on drug classes that were prescribed to at least 1% of the Olmsted County population; therefore, 8 NDF-RT prescription classes were excluded (written to less than 1% of the population), leaving 20 classes for the analysis. The NDF-RT classification system also includes detailed subgroups for each class. Using the NDF-RT subgroups with some modifications (combining related or rarely prescribed subgroups), we classified all the prescriptions into 70 drug groups (Supplemental Table 1). All the drug groups were mutually exclusive. A person who received multiple prescriptions in the same drug group during the 12 months of the study was counted only once, and we did not consider refills or duration of drug use. Overall, 380,441 unique prescription records were included in the analyses.
Statistical Analyses
Prevalence was estimated by dividing the number of individuals who received each group of drugs during a 12-month period by the 2009 Olmsted County population (1-year period prevalence). Age- and sex-specific prevalence patterns were explored graphically. Age-standardized or age- and sex-standardized prevalence figures were obtained by direct standardization to the entire US population (2000 US Census), when appropriate. Because the study covered the complete population of Olmsted County, MN, and no sampling was involved, statistical tests and confidence intervals were not included in the tables.33-35
RESULTS
Overall Prevalence
The 2009 REP census population included 142,377 individuals. Approximately half of the population were men or boys (47%), 27% were less than 19 years of age, and 12% were 65 years of age or older. The majority of the population was white (92%). Overall, 68.1% (n = 96,953) of the population received a prescription from at least one drug group; 51.6% received prescriptions from 2 or more drug groups; and 21.2% received prescriptions from 5 or more drug groups (age- and sex-standardized prevalence). A higher percent of women or girls received at least one drug prescription compared with men or boys (72.5% vs. 63.2%).
Overall, 17% of the population received at least one prescription for penicillins and beta-lactam antimicrobials, which was the most commonly prescribed drug group in the entire population. Antidepressants (13%), opioid analgesics (12%), antilipemic agents (11%), and vaccines/toxoids (11%) were next in decreasing order of frequency. Table 1 shows the 20 most commonly prescribed groups of drugs, and the prescription prevalence by sex and age groups. The prevalence figures for 20 additional groups of prescription drugs in decreasing order of frequency are shown in Supplemental Table 2.
Table 1.
Age- and sex-specific prevalence (per 100 population) of the 20 most common drug groups in the 2009 Olmsted County, MN, population (N = 142,377)
| Drug group | Age (y)a
|
All ages
|
|||||||||||
|---|---|---|---|---|---|---|---|---|---|---|---|---|---|
| 0-18
|
19-29
|
30-49
|
50-64
|
65+
|
Crudeb
|
Standardizedc % | |||||||
| No. | % | No. | % | No. | % | No. | % | No. | % | No. | % | ||
| Penicillins and beta-lactam antimicrobials | |||||||||||||
| Both sexes | 8,771 | 22.75 | 3,177 | 13.26 | 5,563 | 14.67 | 3,462 | 14.08 | 2,761 | 15.93 | 23,734 | 16.67 | 16.60 |
| Men (boys) | 4,377 | 22.32 | 1,035 | 10.01 | 2,170 | 12.13 | 1,433 | 12.47 | 1,181 | 15.68 | 10,196 | 15.25 | 15.07 |
| Women (girls) | 4,394 | 23.19 | 2,142 | 15.71 | 3,393 | 16.93 | 2,029 | 15.50 | 1,580 | 16.12 | 13,538 | 17.93 | 18.13 |
|
| |||||||||||||
| Antidepressants | |||||||||||||
| Both sexes | 1,010 | 2.62 | 2,663 | 11.11 | 6,310 | 16.64 | 4,900 | 19.93 | 3,145 | 18.14 | 18,028 | 12.66 | 12.51 |
| Men (boys) | 409 | 2.09 | 766 | 7.41 | 1,953 | 10.92 | 1,493 | 12.99 | 978 | 12.98 | 5,599 | 8.37 | 8.56 |
| Women (girls) | 601 | 3.17 | 1,897 | 13.92 | 4,357 | 21.74 | 3,407 | 26.02 | 2,167 | 22.11 | 12,429 | 16.46 | 16.21 |
|
| |||||||||||||
| Opioid analgesics | |||||||||||||
| Both sexes | 1,606 | 4.17 | 2,898 | 12.09 | 5,258 | 13.86 | 3,844 | 15.63 | 3,348 | 19.31 | 16,954 | 11.91 | 11.84 |
| Men (boys) | 847 | 4.32 | 1,064 | 10.29 | 2,117 | 11.83 | 1,706 | 14.84 | 1,354 | 17.97 | 7,088 | 10.60 | 10.77 |
| Women (girls) | 759 | 4.01 | 1,834 | 13.45 | 3,141 | 15.67 | 2,138 | 16.33 | 1,994 | 20.34 | 9,866 | 13.07 | 12.85 |
|
| |||||||||||||
| Antilipemic agents | |||||||||||||
| Both sexes | 15 | 0.04 | 127 | 0.53 | 2,539 | 6.69 | 6,377 | 25.94 | 7,024 | 40.52 | 16,082 | 11.30 | 11.07 |
| Men (boys) | 10 | 0.05 | 77 | 0.74 | 1,635 | 9.14 | 3,386 | 29.45 | 3,292 | 43.70 | 8,400 | 12.56 | 12.73 |
| Women (girls) | 5 | 0.03 | 50 | 0.37 | 904 | 4.51 | 2,991 | 22.85 | 3,732 | 38.07 | 7,682 | 10.17 | 9.57 |
|
| |||||||||||||
| Vaccines/toxoids | |||||||||||||
| Both sexes | 8,926 | 23.15 | 1,878 | 7.84 | 2,259 | 5.96 | 1,742 | 7.08 | 1,113 | 6.42 | 15,918 | 11.18 | 11.07 |
| Men (boys) | 4,330 | 22.08 | 550 | 5.32 | 1,048 | 5.86 | 798 | 6.94 | 481 | 6.39 | 7,207 | 10.78 | 10.40 |
| Women (girls) | 4,596 | 24.26 | 1,328 | 9.74 | 1,211 | 6.04 | 944 | 7.21 | 632 | 6.45 | 8,711 | 11.54 | 11.77 |
|
| |||||||||||||
| Anti-asthmatics | |||||||||||||
| Both sexes | 3,921 | 10.17 | 1,697 | 7.08 | 3,520 | 9.28 | 2,477 | 10.07 | 2,080 | 12.00 | 13,695 | 9.62 | 9.56 |
| Men (boys) | 2,138 | 10.90 | 538 | 5.20 | 1,208 | 6.75 | 827 | 7.19 | 819 | 10.87 | 5,530 | 8.27 | 8.22 |
| Women (girls) | 1,783 | 9.41 | 1,159 | 8.50 | 2,312 | 11.54 | 1,650 | 12.60 | 1,261 | 12.86 | 8,165 | 10.81 | 10.83 |
|
| |||||||||||||
| Topical anti-infective/anti-inflammatory agents | |||||||||||||
| Both sexes | 2,952 | 7.66 | 1,529 | 6.38 | 3,122 | 8.23 | 2,840 | 11.55 | 2,819 | 16.26 | 13,262 | 9.31 | 9.22 |
| Men (boys) | 1,467 | 7.48 | 503 | 4.87 | 1,144 | 6.40 | 1,130 | 9.83 | 1,229 | 16.31 | 5,473 | 8.19 | 8.20 |
| Women (girls) | 1,485 | 7.84 | 1,026 | 7.53 | 1,978 | 9.87 | 1,710 | 13.06 | 1,590 | 16.22 | 7,789 | 10.31 | 10.23 |
|
| |||||||||||||
| Erythromycins/macrolides | |||||||||||||
| Both sexes | 3,364 | 8.72 | 1,843 | 7.69 | 3,963 | 10.45 | 2,385 | 9.70 | 1,507 | 8.69 | 13,062 | 9.17 | 9.13 |
| Men (boys) | 1,653 | 8.43 | 513 | 4.96 | 1,360 | 7.60 | 906 | 7.88 | 598 | 7.94 | 5,030 | 7.52 | 7.51 |
| Women (girls) | 1,711 | 9.03 | 1,330 | 9.76 | 2,603 | 12.99 | 1,479 | 11.30 | 909 | 9.27 | 8,032 | 10.64 | 10.71 |
|
| |||||||||||||
| Gastrointestinal medications, other | |||||||||||||
| Both sexes | 395 | 1.02 | 998 | 4.16 | 3,074 | 8.11 | 3,321 | 13.51 | 3,253 | 18.76 | 11,041 | 7.75 | 7.70 |
| Men (boys) | 184 | 0.94 | 373 | 3.61 | 1,319 | 7.37 | 1,370 | 11.92 | 1,276 | 16.94 | 4,522 | 6.76 | 6.92 |
| Women (girls) | 211 | 1.11 | 625 | 4.59 | 1,755 | 8.76 | 1,951 | 14.90 | 1,977 | 20.17 | 6,519 | 8.63 | 8.39 |
|
| |||||||||||||
| Laxatives | |||||||||||||
| Both sexes | 675 | 1.75 | 727 | 3.03 | 2,352 | 6.20 | 3,858 | 15.69 | 2,705 | 15.60 | 10,317 | 7.25 | 7.05 |
| Men (boys) | 303 | 1.55 | 199 | 1.93 | 863 | 4.82 | 1,761 | 15.32 | 1,235 | 16.39 | 4,361 | 6.52 | 6.50 |
| Women (girls) | 372 | 1.96 | 528 | 3.87 | 1,489 | 7.43 | 2,097 | 16.02 | 1,470 | 15.00 | 5,956 | 7.89 | 7.63 |
|
| |||||||||||||
| Beta-blockers and related medications | |||||||||||||
| Both sexes | 77 | 0.20 | 235 | 0.98 | 1,357 | 3.58 | 3,201 | 13.02 | 5,229 | 30.16 | 10,099 | 7.09 | 6.97 |
| Men (boys) | 34 | 0.17 | 76 | 0.74 | 633 | 3.54 | 1,717 | 14.94 | 2,420 | 32.13 | 4,880 | 7.30 | 7.45 |
| Women (girls) | 43 | 0.23 | 159 | 1.17 | 724 | 3.61 | 1,484 | 11.34 | 2,809 | 28.65 | 5,219 | 6.91 | 6.59 |
|
| |||||||||||||
| ACE inhibitors | |||||||||||||
| Both sexes | 30 | 0.08 | 112 | 0.47 | 1,455 | 3.84 | 3,418 | 13.90 | 4,740 | 27.34 | 9,755 | 6.85 | 6.75 |
| Men (boys) | 19 | 0.10 | 75 | 0.73 | 879 | 4.91 | 1,920 | 16.70 | 2,190 | 29.07 | 5,083 | 7.60 | 7.73 |
| Women (girls) | 11 | 0.06 | 37 | 0.27 | 576 | 2.87 | 1,498 | 11.44 | 2,550 | 26.01 | 4,672 | 6.19 | 5.87 |
|
| |||||||||||||
| Diuretics | |||||||||||||
| Both sexes | 46 | 0.12 | 147 | 0.61 | 1,368 | 3.61 | 3,100 | 12.61 | 5,092 | 29.37 | 9,753 | 6.85 | 6.75 |
| Men (boys) | 21 | 0.11 | 54 | 0.52 | 550 | 3.07 | 1,313 | 11.42 | 1,969 | 26.14 | 3,907 | 5.84 | 5.99 |
| Women (girls) | 25 | 0.13 | 93 | 0.68 | 818 | 4.08 | 1,787 | 13.65 | 3,123 | 31.86 | 5,846 | 7.74 | 7.37 |
|
| |||||||||||||
| Topical nasal and throat agents | |||||||||||||
| Both sexes | 1,419 | 3.68 | 1,088 | 4.54 | 2,766 | 7.29 | 2,202 | 8.96 | 1,635 | 9.43 | 9,110 | 6.40 | 6.37 |
| Men (boys) | 822 | 4.19 | 381 | 3.69 | 1,090 | 6.09 | 909 | 7.91 | 702 | 9.32 | 3,904 | 5.84 | 5.88 |
| Women (girls) | 597 | 3.15 | 707 | 5.19 | 1,676 | 8.36 | 1,293 | 9.88 | 933 | 9.52 | 5,206 | 6.89 | 6.84 |
|
| |||||||||||||
| Antihistamines | |||||||||||||
| Both sexes | 2,013 | 5.22 | 1,330 | 5.55 | 2,655 | 7.00 | 1,919 | 7.80 | 1,117 | 6.44 | 9,034 | 6.35 | 6.28 |
| Men (boys) | 1,092 | 5.57 | 395 | 3.82 | 876 | 4.90 | 614 | 5.34 | 404 | 5.36 | 3,381 | 5.06 | 5.04 |
| Women (girls) | 921 | 4.86 | 935 | 6.86 | 1,779 | 8.88 | 1,305 | 9.97 | 713 | 7.27 | 5,653 | 7.49 | 7.45 |
|
| |||||||||||||
| Anti-rheumatics | |||||||||||||
| Both sexes | 989 | 2.56 | 1,325 | 5.53 | 2,798 | 7.38 | 2,108 | 8.57 | 1,153 | 6.65 | 8,373 | 5.88 | 5.83 |
| Men (boys) | 466 | 2.38 | 430 | 4.16 | 1,113 | 6.22 | 898 | 7.81 | 469 | 6.23 | 3,376 | 5.05 | 5.10 |
| Women (girls) | 523 | 2.76 | 895 | 6.57 | 1,685 | 8.41 | 1,210 | 9.24 | 684 | 6.98 | 4,997 | 6.62 | 6.54 |
|
| |||||||||||||
| Sedatives/hypnotics | |||||||||||||
| Both sexes | 205 | 0.53 | 969 | 4.04 | 2,816 | 7.42 | 2,282 | 9.28 | 1,635 | 9.43 | 7,907 | 5.55 | 5.53 |
| Men (boys) | 93 | 0.47 | 308 | 2.98 | 1,059 | 5.92 | 885 | 7.70 | 611 | 8.11 | 2,956 | 4.42 | 4.54 |
| Women (girls) | 112 | 0.59 | 661 | 4.85 | 1,757 | 8.77 | 1,397 | 10.67 | 1,024 | 10.45 | 4,951 | 6.56 | 6.45 |
|
| |||||||||||||
| Adrenal corticosteroids | |||||||||||||
| Both sexes | 1,498 | 3.89 | 799 | 3.33 | 1,982 | 5.23 | 1,559 | 6.34 | 1,549 | 8.94 | 7,387 | 5.19 | 5.17 |
| Men (boys) | 862 | 4.40 | 302 | 2.92 | 726 | 4.06 | 587 | 5.11 | 657 | 8.72 | 3,134 | 4.69 | 4.71 |
| Women (girls) | 636 | 3.36 | 497 | 3.65 | 1,256 | 6.27 | 972 | 7.42 | 892 | 9.10 | 4,253 | 5.63 | 5.61 |
|
| |||||||||||||
| Quinolones | |||||||||||||
| Both sexes | 191 | 0.50 | 969 | 4.04 | 2,009 | 5.30 | 1,899 | 7.72 | 2,272 | 13.11 | 7,340 | 5.16 | 5.08 |
| Men (boys) | 63 | 0.32 | 237 | 2.29 | 662 | 3.70 | 736 | 6.40 | 863 | 11.46 | 2,561 | 3.83 | 3.94 |
| Women (girls) | 128 | 0.68 | 732 | 5.37 | 1,347 | 6.72 | 1,163 | 8.88 | 1,409 | 14.37 | 4,779 | 6.33 | 6.15 |
|
| |||||||||||||
| Systemic contraceptives | |||||||||||||
| Both sexes | 881 | 2.28 | 3,357 | 14.01 | 2,592 | 6.83 | 190 | 0.77 | 24 | 0.14 | 7,044 | 4.95 | 4.55 |
| Men (boys) | 1 | 0.01 | 5 | 0.05 | 17 | 0.10 | 20 | 0.17 | 6 | 0.08 | 49 | 0.07 | 0.07 |
| Women (girls) | 880 | 4.64 | 3,352 | 24.59 | 2,575 | 12.85 | 170 | 1.30 | 18 | 0.18 | 6,995 | 9.26 | 9.10 |
Numbers to the left of the prevalence figure indicate the actual number of cases observed. Prevalence can be computed by dividing the number of cases by the corresponding denominator listed below (and multiplying by 100)
Denominators for men (boys) and women (girls) combined: 0-18=38,558; 19-29=23,968; 30-49=37,927; 50-64=24,588; 65+=17,336
Denominators for men (boys): 0-18=19,611; 19-29=10,337; 30-49=17,888; 50-64=11,496; 65+=7533
Denominators for women (girls): 0-18=18,947; 19-29=13,631; 30-49=20,039; 50-64=13,092; 65+=9803
A crude prevalence was computed by dividing cases observed across all ages by the total population
Overall prevalence for men (boys) and women (girls) combined was standardized by age and sex; overall prevalence for men (boys) and women (girls) separately was standardized only by age (direct standardization using the 2000 US census population)
Prevalence by Age and Sex
The prevalence of the most commonly prescribed drugs varied by age and sex (Figure 1). In general, women had higher prescription prevalence for most drug groups except for cardiovascular disease drugs (including antilipemic agents, beta-blockers and related medications, and angiotensin converting enzyme inhibitors). The prevalence of most of the drug groups increased with advancing age. However, vaccine/toxoid and penicillin and beta-lactam antimicrobial prescriptions were most prevalent among children, decreased in young adults, and then slowly increased with age. Prescriptions of antidepressants, opioid analgesics, gastrointestinal medications, laxatives, and cardiovascular disease drugs increased sharply with age. By contrast, prescriptions of anti-asthmatics, topical anti-infective/anti-inflammatory agents, erythromycins/macrolides, topical nasal and throat agents, and antihistamines had a relatively stable prevalence across all age groups.
Figure 1.
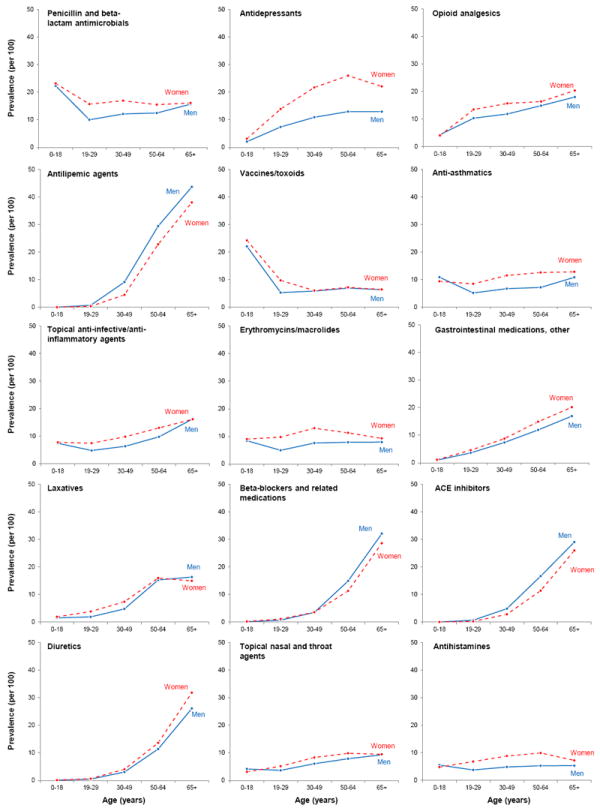
Age-specific prevalence (per 100 population) of the 15 most commonly prescribed drug groups in men (boys) compared to women (girls). The 15 panels are in descending order of overall age- and sex-adjusted prevalence (see Table 1).
The most commonly prescribed drug groups varied by age (Table 1 and Figure 2). In children (less than 19 years), the top prescriptions were vaccines/toxoids and penicillins and beta-lactam antimicrobials. By contrast, the most common prescriptions in persons of age 65 or older were antilipemic agents and beta-blockers and related medications. Finally, prescribing patterns varied by sex within age groups. For example, in children (less than 19 years), drug prescribing patterns were similar between boys and girls. However, central nervous system stimulants were more commonly prescribed to boys than girls (data not shown). In young adults (19-29 years), systemic contraceptives were the most common prescription, with an overall prevalence of 14%. However, this prevalence was driven by the 25% frequency of contraceptive prescriptions in women. Similarly, antidepressants were the most common drug group in the 30-49 year old population, with an overall prevalence of 17%. Again, the prevalence of antidepressants was driven by a higher frequency of prescriptions to women in this age group (22%).
Figure 2.

Prevalence (per 100 population) of the 10 most commonly prescribed drug groups in each age category. Overall prevalence is shown with the white bars, prevalence in men (boys) is shown with the blue bars, and prevalence in women (girls) is shown with the red bars.
DISCUSSION
Overall Findings
Outpatient prescriptions for drugs were highly prevalent in the Olmsted County population in our 2009 study. Within a 12-month period, almost 70% of the population received a prescription from at least one drug group, more than 50% received prescriptions in 2 or more drug groups, and over 20% received prescriptions in 5 or more drug groups. The most prevalent prescriptions were penicillins and beta-lactam antimicrobials, antidepressants, opioid analgesics, and antilipemic agents. These drugs were prescribed to both sexes across all age groups (except for antilipemic agents that were rarely used before age 30 years). However, prescribing patterns differed substantially across age and sex groups. Overall, women and older adults received more prescriptions.
In general, drug prescribing patterns in our population are consistent with previous population-based studies in the US. 1,22 The prevalence of prescription drug use is high in the US. The National Health and Nutrition Examination Survey (NHANES) reported a 48% monthly use of one or more prescription drugs in 2007 - 2008.1 Another survey reported that 50% of US adults took at least one medication weekly.18 Unfortunately, our findings cannot be compared directly with findings from these previous studies because of differences in methodology (weekly or monthly use versus annual use, and data derived from drug prescriptions versus self-reports, pharmacy records, or insurance claims).36 We considered the use of drugs over a 12-month period to avoid seasonal variations in prescriptions for some drugs (e.g., drugs for allergies).
Antibiotics, vaccines, asthma medicines, and central nervous system stimulants were commonly prescribed to children, whereas oral contraceptives, antibiotics, antidepressants, and opioid analgesics were commonly prescribed to young and middle-aged adults. As expected, cardiovascular disease drugs were the most commonly prescribed drugs in the older adults, with 41% of subjects of age 65 years or older receiving an antilipemic prescription. Men had a higher prevalence of cardiovascular disease drug prescriptions than women, which was consistent with cardiovascular disease patterns. Specifically, the incidence of cardiovascular disease in women lags 10 years behind the incidence in men (http://circ.ahajournals.org/content/125/1/e2/F10.expansion.html), and a similar pattern was reflected in our drug prescription data. However, when considering all prescription drugs, women received more prescriptions than men. This may be caused by the higher frequency of diseases or conditions requiring medication in women, or by differences in health care seeking behavior between men and women.37 For example, among migraine patients, 73% of women seek care from physicians compared with 49% of men.38
Specific Drug Groups
Our study provides an overview of prescription patterns in this community and highlights some of the commonly used drug groups that deserve further research, as described below. Penicillins, and beta-lactam antimicrobial are the most commonly prescribed drugs, especially in children. The high prevalence of prescriptions for penicillins, and beta-lactam antimicrobial (approximately 25% of all children in 2009) reflects the high rate of bacterial infections (such as ear or throat infections). Appropriate use of antibiotics is a major public health concern,39 and we plan to further study antibiotic prescriptions through linkage with laboratory and medical record data to explore prescribing appropriateness, type and length of use, and use of multiple antibiotics.
Antidepressants are the second most prescribed drug group (13%), particularly among middle-aged women. This sex difference has been reported in other studies.22,40,41 The increased prescription of antidepressants in recent years has occurred concurrently with a decreasing use of psychotherapy.42 However, many antidepressants are not prescribed by psychiatrists,43 and are prescribed to patients who may not have a psychiatric diagnosis.44 Further studies considering indications may be helpful to understand the use of antidepressants for conditions other than depression.
Opioid analgesics are the third most common prescription group in this population. In the US, there has been a 10-fold increase in the medical use of opioid painkillers during the last 20 years.45 Concerns regarding opioid misuse are increasing in the US because deaths from opioid overdose currently outnumber deaths due to heroin and cocaine combined.45 The 12-month prevalence of opioid prescriptions (12%) in our study was consistent with previous reports.1,46 Also, consistent with other studies, women had a higher prevalence of prescriptions than men.1,21,40,46 This is likely due to a higher prevalence of diseases associated with chronic pain in women,47 but also to a lower pain tolerance and a higher subjective pain rating in women than men.48,49 Osteoarthritis and joint disorders, and back problems are the second and third most common chronic conditions in this community.50 Therefore, it is not surprising that the use of opioid analgesics was common. However, it was surprising that opioid analgesics were prescribed in all age groups, including young adults who generally do not suffer from chronic pain conditions. This pattern can be explained by our inclusion of opioid analgesics prescribed for both acute and chronic pain. Opioid analgesics are often prescribed to manage acute pain following surgical procedures or trauma and patients are instructed to use the analgesic only if needed. In addition, we included prescriptions given to patients at the time of dismissal from the hospital or emergency department (e.g., Vicodin or Oxycodone). These types of short-term prescriptions may be common in the younger population after dental procedures. Nevertheless, the high level of opioid prescriptions among all subjects in our population suggests the importance of future studies to determine whether alternative pain management agents should be considered.
In our study, antilipemic agents were the fourth most commonly prescribed drug group overall, and the high use was driven primarily by prescriptions to persons of age 50 years or older. In persons of age 65 years or older, 41% received at least one antilipemic prescription in 2009. This is similar to the monthly percentage estimated from the NHANES survey in 2007 - 2008 (45% of adults aged 60 years or older).1 The NHANES data also estimated that 33.5% of the US adults older than 20 years have increased low density lipoprotein levels (LDL), and this prevalence increases to 58% in adults of age 65 or older.51 However, less than half of those with high LDL were treated, and even fewer had the LDL level controlled.51 Applying similar estimates to our population, we expect that a significant percent of patients may be under-prescribed for antilipemic agents. We plan to address patterns of utilization of antilipemic agents in future studies. These studies will also incorporate serial lipid blood tests and other detailed information from medical records.
Strengths and Limitations
Strengths of our study include the availability of complete medical visit information for the entire Olmsted County, MN population. For a combination of geographic and historical circumstances, almost all the county residents seek health care from a limited number of local providers. Furthermore, all residents, irrespective of insurance status, are included in both the denominator and the numerator of the prevalence figures, providing a more complete picture of prescribing patterns in the community.
Some utilization studies rely on self-reported drug use which may more accurately reflect actual drug exposure; however, recall bias is a problem for past use.2,18 In particular, interviewees tend to underreport their medication use.52 Additionally, self-reported drug use does not necessarily reflect prescribing patterns by the health care providers, because not all prescriptions are filled.26 Utilization estimates derived from pharmacy records, claims, and other administrative databases may have a higher sensitivity for actual drug exposure. A potential limitation of prescription-based studies, such as ours, is the inability to determine whether the patients actually purchased and used the drugs (compliance with the prescription). Therefore, the patterns of prescriptions that we observed may not reflect the patterns of actual drug use in the population. Nevertheless, the ability to link prescription data with diagnoses and with clinical details in the electronic medical records is a unique strength of the REP, and will form the basis for future utilization and outcome studies focused on individual drugs or drug groups.
A second limitation of our database is that many commonly used drugs are not prescription drugs, and can be purchased over-the-counter (such as cold medicines); therefore, they are not found among the most commonly prescribed drugs. This also applies to vaccines that are more completely captured in vaccine registries. A third limitation is our inability to include drug prescriptions from a few smaller health care providers in Olmsted County that do not have an electronic drug prescription system.27,30 Thus, we may have underestimated the frequency of use for some drug groups.
Fourth, drug formularies, prescribing guidelines, and decision support systems may vary substantially across health care practices throughout the country. Therefore, the prescribing patterns that we observed in Olmsted County may not be generalizable to other regions. On the other hand, drug formularies, prescribing guidelines, and decision support systems may influence more strongly the choice of a drug within a particular drug group then the choice of the drug group itself. Thus, the patterns of drug groups may be more generalizable to other populations than the patterns of specific drugs.
Finally, the 12-month prevalence used in this study does not distinguish between chronic use (repeated prescriptions) and one time use of drugs (e.g., antibiotics), and does not reflect multiple prescriptions within the same drug group (switches), or the frequency of drug prescribing within a person. We also have not assessed refills and instructions for use, such as directions to use the drug only if needed (e.g., for opioid analgesics). Length of drug use may be particularly important when investigating issues such as chronic disease management, drug abuse, and outcomes. We are currently performing additional analyses to address issues of indications, duration of use, and per capita prescriptions within each drug group to provide a more complete picture of drug utilization in this community.
CONCLUSION
A surprisingly high percent of the overall Olmsted County population received outpatient prescription drugs in 2009. The drug prescribing patterns varied substantially by age and sex. In general, women and older subjects received more prescriptions. Our findings are useful for understanding the prescribing patterns across all ages in a defined population, and provide important baseline information for future studies of drug-related adverse events, drug-to-drug interactions, polypharmacy, health-seeking behaviors, and other prescription-related aspects of health care utilization.
Supplementary Material
Acknowledgments
The authors would like to thank Carol Greenlee for formatting the manuscript.
Grant support: The Rochester Epidemiology Project is currently supported by the National Institute on Aging of the National Institutes of Health under Award Number R01AG034676. The content is solely the responsibility of the authors and does not necessarily represent the official views of the National Institutes of Health. Additionally, this publication was supported by the Mayo Clinic Center for the Science of Healthcare Delivery.
Abbreviations and Acronyms
- NDF – RT
National Drug File - Reference Terminology
- REP
Rochester Epidemiology Project
- LDL
low density lipoprotein
Footnotes
SUPPLEMENTAL ONLINE MATERIAL
Two supplemental tables can be found online.
Conflict of interest: none declared
Publisher's Disclaimer: This is a PDF file of an unedited manuscript that has been accepted for publication. As a service to our customers we are providing this early version of the manuscript. The manuscript will undergo copyediting, typesetting, and review of the resulting proof before it is published in its final citable form. Please note that during the production process errors may be discovered which could affect the content, and all legal disclaimers that apply to the journal pertain.
References
- 1.Gu Q, Dillon CF, Burt VL. Prescription drug use continues to increase: U.S. prescription drug data for 2007-2008. NCHS Data Brief. 2010:1–8. [PubMed] [Google Scholar]
- 2.National Center for Health Statistics. Health, United States, 2011: With Special Feature on Socioeconomic Status and Health. Hyattsville, MD: 2012. [April 12, 2013]. http://www.cdc.gov/nchs/data/hus/hus11.pdf. [PubMed] [Google Scholar]
- 3.CDC grand rounds: prescription drug overdoses - a U.S. epidemic. [April 12, 2013];MMWR. 2012 61:10–13. http://www.cdc.gov/mmwr/preview/mmwrhtml/mm6101a3.htm. [PubMed] [Google Scholar]
- 4.Center for Disease Control (CDC) [April 12, 2013];Unintentional drug poisoning in the United States. http://www.cdc.gov/HomeandRecreationalSafety/pdf/poision-issue-brief.pdf.
- 5.Lucado J, Paez K, Elixhauser A. Medication-Related Adverse Outcomes in U.S. Hospitals and Emergency Departments, 2008. HCUP Statistical Brief #109. 2011 http://www.hcup-us.ahrq.gov/reports/statbriefs/sb109.pdf. [PubMed]
- 6.Cossman RE, Cossman JS, James WL, et al. Correlating pharmaceutical data with a national health survey as a proxy for estimating rural population health. Popul Health Metr. 2010;8:25. doi: 10.1186/1478-7954-8-25. [DOI] [PMC free article] [PubMed] [Google Scholar]
- 7.Cossman RE, Cossman JS, James WL, et al. Evaluating heart disease presciptions-filled as a proxy for heart disease prevalence rates. Journal of Health and Human Services Administration. 2008;30:503–528. [PubMed] [Google Scholar]
- 8.Zhang Y, Baicker K, Newhouse JP. Geographic variation in Medicare drug spending. The New England Journal of Medicine. 2010;363:405–409. doi: 10.1056/NEJMp1004872. [DOI] [PMC free article] [PubMed] [Google Scholar]
- 9.Wennberg J, Cooper M. The Dartmouth atlas of health care in the US. 1999 http://www.dartmouthatlas.org/downloads/atlases/98Atlas.pdf.
- 10.Wennberg J, Wennberg D. Practice variations and the use of prescription drugs. Dartmouth atlas of health care in Michigan. 2000 http://www.bcbsm.com/content/dam/public/Consumer/Documents/about-us/dartmouth-atlas.pdf.
- 11.Jorgensen T, Johansson S, Kennerfalk A, Wallander MA, Svardsudd K. Prescription drug use, diagnoses, and healthcare utilization among the elderly. Annals of Pharmacotherapy. 2001;35:1004–1009. doi: 10.1345/aph.10351. [DOI] [PubMed] [Google Scholar]
- 12.Fernandez-Liz E, Modamio P, Catalan A, Lastra CF, Rodriguez T, Marino EL. Identifying how age and gender influence prescription drug use in a primary health care environment in Catalonia, Spain. British Journal of Clinical Pharmacology. 2008;65:407–417. doi: 10.1111/j.1365-2125.2007.03029.x. [DOI] [PMC free article] [PubMed] [Google Scholar]
- 13.Morgan SRC, Mooney D, Martin D. The Canadian Rx Atlas. 2 Vancouver: Centre for Health Services and Policy Research; 2008. p. 151. [Google Scholar]
- 14.Sommer A. Getting What We Deserve: Health and Medical Care in America. Baltimore, MD: Johns Hopkins University Press; 2009. p. 133. [Google Scholar]
- 15.Baum C, Kennedy DL, Forbes MB, Jones JK. Drug use in the United States in 1981. JAMA. 1984;251:1293–1297. [PubMed] [Google Scholar]
- 16.Baum C, Kennedy DL, Forbes MB, Jones JK. Drug use and expenditures in 1982. JAMA. 1985;253:382–386. [PubMed] [Google Scholar]
- 17.Baum C, Kennedy DL, Knapp DE, Juergens JP, Faich GA. Prescription drug use in 1984 and changes over time. Medical Care. 1988;26:105–114. doi: 10.1097/00005650-198802000-00002. [DOI] [PubMed] [Google Scholar]
- 18.Kaufman DW, Kelly JP, Rosenberg L, Anderson TE, Mitchell AA. Recent patterns of medication use in the ambulatory adult population of the United States: the Slone survey. JAMA. 2002;287:337–344. doi: 10.1001/jama.287.3.337. [DOI] [PubMed] [Google Scholar]
- 19.Kotzan L, Carroll NV, Kotzan JA. Influence of age, sex, and race on prescription drug use among Georgia Medicaid recipients. American Journal of Hospital Pharmacy. 1989;46:287–290. [PubMed] [Google Scholar]
- 20.LaVange LM, Silverman HA. Outpatient prescription drug utilization and expenditure patterns of noninstitutionalized aged Medicare beneficiaries. National Medical Care Utilization and Expenditure Survey Series B, Descriptive Report. 1987:1–43. [PubMed] [Google Scholar]
- 21.Roe CM, McNamara AM, Motheral BR. Gender- and age-related prescription drug use patterns. Annals of Pharmacotherapy. 2002;36:30–39. doi: 10.1345/aph.1A113. [DOI] [PubMed] [Google Scholar]
- 22.Roe CM, McNamara AM, Motheral BR. Use of chronic medications among a large, commercially-insured US population. Pharmacoepidemiol Drug Saf. 2002;11:301–309. doi: 10.1002/pds.700. [DOI] [PubMed] [Google Scholar]
- 23.Stuart B, Ahern F, Rabatin V, Johnson A. Patterns of outpatient prescription drug use among Pennsylvania elderly. Health Care Financing Review. 1991;12:61–72. [PMC free article] [PubMed] [Google Scholar]
- 24.Khandker RK, Simoni-Wastila LJ. Differences in prescription drug utilization and expenditures between Blacks and Whites in the Georgia Medicaid population. Inquiry. 1998;35:78–87. [PubMed] [Google Scholar]
- 25.Zhang Y, Baicker K, Newhouse JP. Geographic variation in Medicare drug spending. New England Journal of Medicine. 2010;363:405–409. doi: 10.1056/NEJMp1004872. [DOI] [PMC free article] [PubMed] [Google Scholar]
- 26.Kennedy J, Tuleu I, Mackay K. Unfilled prescriptions of medicare beneficiaries: prevalence, reasons, and types of medicines prescribed. J Manag Care Pharm. 2008;14:553–560. doi: 10.18553/jmcp.2008.14.6.553. [DOI] [PMC free article] [PubMed] [Google Scholar]
- 27.St Sauver JL, Grossardt BR, Yawn BP, Melton LJ, 3rd, Rocca WA. Use of a medical records linkage system to enumerate a dynamic population over time: the Rochester Epidemiology Project. American Journal of Epidemiology. 2011;173:1059–1068. doi: 10.1093/aje/kwq482. [DOI] [PMC free article] [PubMed] [Google Scholar]
- 28.St Sauver JL, Grossardt BR, Leibson CL, Yawn BP, Melton LJ, 3rd, Rocca WA. Generalizability of Epidemiologic Findings and Public Health Decisions: An Illustration from the Rochester Epidemiology Project. Mayo Clinic Proceedings. 2012;87:151–160. doi: 10.1016/j.mayocp.2011.11.009. [DOI] [PMC free article] [PubMed] [Google Scholar]
- 29.Rocca WA, Yawn BP, St Sauver JL, Grossardt BR, Melton LJ. History of the Rochester Epidemiology Project: Half a Century of Medical Records Linkage in a US Population. Mayo Clinic Proceedings. 2012;87:1202–1213. doi: 10.1016/j.mayocp.2012.08.012. [DOI] [PMC free article] [PubMed] [Google Scholar]
- 30.St Sauver JL, Grossardt BR, Yawn BP, et al. Data Resource Profile: The Rochester Epidemiology Project (REP) medical records-linkage system. International Journal of Epidemiology. 2012;41:1614–1624. doi: 10.1093/ije/dys195. [DOI] [PMC free article] [PubMed] [Google Scholar]
- 31.Pathak J, Chute CG. Analyzing categorical information in two publicly available drug terminologies: RxNorm and NDF-RT. Journal of the American Medical Informatics Association. 2010;17:432–439. doi: 10.1136/jamia.2009.001289. [DOI] [PMC free article] [PubMed] [Google Scholar]
- 32.Pathak J, Murphy SP, Willaert BN, et al. Using RxNorm and NDF-RT to classify medication data extracted from electronic health records: experiences from the Rochester Epidemiology Project. AMIA Annu Symp Proc. 2011:1089–1098. [PMC free article] [PubMed] [Google Scholar]
- 33.Anderson DW, Mantel N. On epidemiologic surveys. American Journal of Epidemiology. 1983;118:613–619. doi: 10.1093/oxfordjournals.aje.a113671. [DOI] [PubMed] [Google Scholar]
- 34.Deming WE. Boundaries of Statistical Inference. In: Smith H, Johnson NL, editors. New Developments in Survey Sampling. New York: Wiley-Interscience; 1969. pp. 652–670. [Google Scholar]
- 35.Rocca WA, Cha RH, Waring SC, Kokmen E. Incidence of dementia and Alzheimer’s disease: a reanalysis of data from Rochester, Minnesota, 1975-1984. American Journal of Epidemiology. 1998;148:51–62. doi: 10.1093/oxfordjournals.aje.a009560. [DOI] [PubMed] [Google Scholar]
- 36.Lin SJ, Lambert B, Tan H, Toh S. Frequency estimates from prescription drug datasets (revision of #04-11-066A) Pharmacoepidemiology and drug safety. 2006;15:512–520. doi: 10.1002/pds.1149. [DOI] [PubMed] [Google Scholar]
- 37.Courtenay WH. Constructions of masculinity and their influence on men’s well-being: a theory of gender and health. Social Science and Medicine. 2000;50:1385–1401. doi: 10.1016/s0277-9536(99)00390-1. [DOI] [PubMed] [Google Scholar]
- 38.Lipton RB, Bigal ME. Migraine: epidemiology, impact, and risk factors for progression. Headache. 2005;45(Suppl 1):S3–S13. doi: 10.1111/j.1526-4610.2005.4501001.x. [DOI] [PubMed] [Google Scholar]
- 39.Century CoEMTtHits. Microbial Threats to Health: Emergence, Detection, and Response. The National Academies Press; 2003. [PubMed] [Google Scholar]
- 40.Anthony M, Lee KY, Bertram CT, et al. Gender and age differences in medications dispensed from a national chain drugstore. J Womens Health (Larchmt) 2008;17:735–743. doi: 10.1089/jwh.2007.0731. [DOI] [PubMed] [Google Scholar]
- 41.Current Depression among adults-United States, 2006 and 2008. MMWR. 2010;59:1029. [PubMed] [Google Scholar]
- 42.Olfson M, Marcus SC. National patterns in antidepressant medication treatment. Archives of General Psychiatry. 2009;66:848–856. doi: 10.1001/archgenpsychiatry.2009.81. [DOI] [PubMed] [Google Scholar]
- 43.Mojtabai R. Increase in antidepressant medication in the US adult population between 1990 and 2003. Psychotherapy and Psychosomatics. 2008;77:83–92. doi: 10.1159/000112885. [DOI] [PubMed] [Google Scholar]
- 44.Mojtabai R, Olfson M. Proportion of antidepressants prescribed without a psychiatric diagnosis is growing. Health Affairs. 2011;30:1434–1442. doi: 10.1377/hlthaff.2010.1024. [DOI] [PubMed] [Google Scholar]
- 45.Kokmen E, Naessens JM, Offord KP. A short test of mental status: description and preliminary results. Mayo Clinic Proceedings. 1987;62:281–288. doi: 10.1016/s0025-6196(12)61905-3. [DOI] [PubMed] [Google Scholar]
- 46.Parsells Kelly J, Cook SF, Kaufman DW, Anderson T, Rosenberg L, Mitchell AA. Prevalence and characteristics of opioid use in the US adult population. Pain. 2008;138:507–513. doi: 10.1016/j.pain.2008.01.027. [DOI] [PubMed] [Google Scholar]
- 47.Wiesenfeld-Hallin Z. Sex differences in pain perception. Gend Med. 2005;2:137–145. doi: 10.1016/s1550-8579(05)80042-7. [DOI] [PubMed] [Google Scholar]
- 48.Berkley KJ. Sex differences in pain. Behavioral and Brain Sciences. 1997;20:371–380. doi: 10.1017/s0140525x97221485. [DOI] [PubMed] [Google Scholar]
- 49.Dixon KE, Thorn BE, Ward LC. An evaluation of sex differences in psychological and physiological responses to experimentally-induced pain: a path analytic description. Pain. 2004;112:188–196. doi: 10.1016/j.pain.2004.08.017. [DOI] [PubMed] [Google Scholar]
- 50.St Sauver JL, Warner DO, Yawn BP, et al. Why patients visit their doctors: assessing the most prevalent conditions in a defined american population. Mayo Clinic Proceedings. 2013;88:56–67. doi: 10.1016/j.mayocp.2012.08.020. [DOI] [PMC free article] [PubMed] [Google Scholar]
- 51.Vital signs: prevalence, treatment, and control of high levels of low-density lipoprotein cholesterol--United States, 1999-2002 and 2005-2008. MMWR. 2011;60:109–114. [PubMed] [Google Scholar]
- 52.Hill SC, Zuvekas SH, Zodet MW. Implications of the accuracy of MEPS prescription drug data for health services research. Inquiry. 2011;48:242–259. doi: 10.5034/inquiryjrnl_48.03.04. [DOI] [PubMed] [Google Scholar]
Associated Data
This section collects any data citations, data availability statements, or supplementary materials included in this article.