

Abstract
Tumor progression to metastasis is a complex, sequential process that requires proliferation, resistance to apoptosis, motility and invasion to colonize at distant sites. The acquisition of these features implies a phenotypic plasticity by tumor cells that must adapt to different conditions by modulating several signaling pathways1 during the journey to the final site of metastasis. Several transcription factors and microRNA play a role in tumor progression, but less is known about the control of their expression during this process. Here, we demonstrate by ectopic expression and gene silencing that the proto-oncogene c-Myb activates the expression of the 5 members of miR200 family (miR200b, miR200a, miR429, miR200c and miR141) that are involved in the control of epithelial-mesenchymal transition (EMT) and metastasis in many types of cancers. Transcriptional activation of miR200 by c-Myb occurs through binding to myb binding sites located in the promoter regions of miR200 genes on human chromosomes 1 and 12. Furthermore, when c-Myb and the transcriptional repressor ZEB1 are co-expressed, as at the onset EMT, the repression by ZEB1 prevails over the activation by c-Myb, and the expression of miR200 is inhibited. We also demonstrate that during EMT induced by TGF-β, the promoters of miR200 genes are methylated, and their transcription is repressed regardless of the presence of repressors such as ZEB1 and activators such as c-Myb. Finally, we find a correlation between the expression of c-Myb and that of four out of 5 miR200 in a data set of 207 breast cancer patients.
Keywords: miR200, c-Myb, EMT, ZEB1, breast cancer, metastasis
Introduction
MicroRNAs (or miRs) play causative roles in several pathologies, including cancer.2 The first evidence of the involvement of microRNAs in human cancers was obtained in chronic lymphocytic leukemia (CLL).3 Since then, the importance of miRs not only as prognostic markers, but, more importantly, as cancer drivers contributing to malignant transformation and cancer progression has been clearly established.2 Several miRs have been demonstrated to affect also tumor metastasis playing pro- and anti-metastatic roles.4-6 Although the role of miR-200 family in regulating E-cadherin expression and in inhibiting epithelial-to-mesenchymal transition (EMT) is well established,7 their influence on metastatic colonization remains controversial. miR200s negatively control the expression of EMT-related ZEB1, and, in turn, ZEB1 inhibits miR200s transcription by binding to their regulatory regions.7 Nevertheless, further experiments suggested a pleiotropic role of miR-200s in promoting metastatic colonization by affecting E-cadherin-dependent epithelial traits and Sec23a-mediated tumor cell secretome.8
The proto-oncogene c-myb is the cellular homolog of the transforming gene of the avian myeloblastosis virus.9 As a transcription factor, c-myb recognizes a core binding site t/cAACt/gG located in the regulatory regions of the controlled genes.10 More than 80 c-myb targets have been described that, although representing an incomplete list, illustrate the involvement of c-Myb in development, cell survival, proliferation, and homeostasis.9 In normal cells, c-Myb sustains the proliferation and the differentiation of hematopoietic cells11-13 and controls the appropriate ratio of stem and progenitor cells in the colonic crypt, in the adult neurogenic zones,14 and in the neuroectoderm of the early chick embryo.15 In hematopoietic malignancies, c-Myb is required for proliferation of acute myeloid leukemia (AML) and chronic myeloid leukemia (CML) cells.16,17 A direct involvement in leukemia was more recently demonstrated by finding chromosomal rearrangements and duplications of c-Myb in T-cell acute lymphoblastic leukemia (T-ALL).18,19 Defects in the expression of c-Myb were also detected in common solid tumors. c-Myb is frequently overexpressed (>80% of cases), and its expression correlates with poor prognosis in colorectal cancer.9,20 The elevated levels of c-Myb in colorectal cancer can be caused by mutations in the attenuator region located in the first intron of the gene.21,22 In breast cancer, c-myb gene was found amplified in a small percentage of cases with BRCA1 mutations23 and frequently expressed in estrogen-receptor positive (ER+) patients.24 The transcriptional elongation of c-myb is dependent on the presence of ligand-bound ERalpha, which binds to a site adjacent to the attenuation region in the first intron of c-myb.25 Silencing c-Myb expression blocks estrogen-dependent proliferation of breast cancer cells.25 Less is known about the post-transcriptional regulation of c-myb in breast cancer. We previously demonstrated that miR200s inhibit c-Myb expression through binding to 2 sequences located in the 3′ untranslated region of c-myb.26 Nevertheless, miR200-dependent inhibition is not complete in such a way as to allow c-Myb expression and to act as a fine modulator of c-Myb levels in breast cancer cells.26 These data suggest thac-Myb can have a role in the regulation of epithelial–mesenchymal transition of some tumor types.27,28
There are examples of the interplay between oncogenes and miRNAs in controlling central events in tumor progression and metastasis,29,30 but the complete picture of these interactions is far from being complete.
In this paper, we demonstrated that c-Myb activates transcription of miR200s in breast cancer cells. c-Myb activity is dependent on binding to specific sequences in the promoters of the miR200 genes on chromosome 1 (miR200a, miR200b and miR429) and on chromosome 12 (miR200c and miR141). Accordingly, a significant correlation between miR200 and c-Myb expression was found in a data set of 207 breast cancer patients.
Results
c-Myb activates the expression of miR200s
miR200 family and c-Myb are frequently expressed in breast cancer.24,31 To evaluate whether a reciprocal control exists between miR200s and c-Myb, we stably transfected the HEK-293 cell line with an expression vector (pcDNA3-c-mybHA) that encodes the human c-Myb protein tagged with an HA tag at the 3′ terminus. The transfected cells expressed c-MybHA at transcript and protein levels (Fig. 1A and B). The expression of miR200a, miR200b, miR429, miR200c, and miR141 analyzed by real-time PCR, was significantly upregulated in pcDNA3-c-mybHA-transfected cells compared with empty vector (pcDNA3HA) control (Fig. 1C). As expected, the expression of miR155, a known target of c-Myb,32 was upregulated in pcDNA3-c-mybHA-transfected cells (Fig. 1C). Conversely, miR150, which inhibits c-Myb33 but is not regulated by it, remains constant (Fig. 1C). To evaluate the effect of silencing the endogenous levels of c-Myb, we infected the c-Myb-expressing human breast cancer cell line MCF-7 with a tetracyclin-inducible (tet-on) lentiviral vector encoding an shRNA against c-Myb (pLV-shc-myb). Infected cells were tested for c-Myb expression, which decreased by 79% after 72 and 120 h of doxycyclin (DOXY) treatment (2.5 μM) compared with controls (Fig. 2A and B). We evaluated the levels of miR200 family members after 72 and 120 h of DOXY treatment, since the half-life of microRNA in mammalian cells can exceed 100 h.34 Real-time PCR analysis of miR200s revealed a significant reduction of all members of the family. Decrease became more conspicuous after 120 h of DOXY treatment (Fig. 2C). We infected also the HEK293 cells with the lentiviral vector pLV-shc-myb to silence c-Myb (Fig. S1A). Similarly to MCF-7 cells, the expression of all members of miR200 family was significantly reduced in pLV-shc-myb-infected HEK293 cells after 72 and 120 h of DOXY treatment (Fig. S1B). In addition, we silenced the expression of c-Myb in MCF-7 cells by transient transfection of siRNA directed against c-myb. Although this technique was not as effective as lentiviral shRNA in silencing c-Myb (Fig. S2A), we detected a significant decrease of miR200 members 72 h after transfection (Fig. S2B and C), with all siRNA concentrations utilized (10, 50, and 100 nM). Together, these data indicate that c-Myb activates the expression of miR200s.
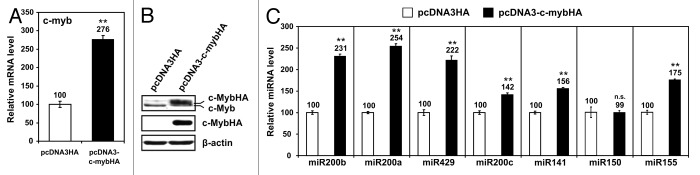
Figure 1. (A)HEK293 cells stably transfected with the expression vector pcDNA3-c-mybHA or with the empty vector pcDNA3HA were tested for c-myb expression by quantitative reverse transcriptase real-time PCR (qRT-PCR). The expression level of c-myb in pcDNA3HA transfected cells was arbitrarily set to 100.(B)Western blot analysis of pcDNA3-c-mybHA- and pcDNA3HA-transfected cells. Anti-c-Myb and anti-HA antibodies were used for detection. β-actin expression was used to control equal loading. (C)qRT-PCR was performed for detection of each miRNA of the miR200 family. miR150 and miR155 were used as controls of non-regulated and c-Myb-regulated miRNA, respectively. The expression level of each miRNA in the pcDNA3HA-transfected cells was arbitrarily set to 100. Data are reported ± standard deviation. Statistical significance was calculated by two-tailed Student t test., ** P ≤ 0.01. qRT-PCR analyses were performed in triplicate in 2 independent experiments.

Figure 2. (A)MCF-7 cells were infected with lentiviral vector pLV-sh-c-myb (sh-c-myb) or with the empty vector pLV-EV (EV) and c-Myb expression was analyzed in sh-c-myb and Ctrl infected cells after 72 and 120 h of treatment with 2.5 mg/ml of doxycyclin by qRT-PCR. The relative mRNA level in untreated EV cells was arbitrarily set to 100.(B)Western blot analysis to detect c-Myb expression in cells infected with pLV-sh-c-myb (sh-c-myb) or with the empty vector pLV-EV (EV) untreated and doxycyclin-treated (2.5 ng/ml) for 72 and 120 h. β-actin expression was used for normalization.(C)qRT-PCR to analyze the expression level of each miRNA of the miR200 family in sh-c-myb-infected cells treated with doxycyclin for 72 and 120 h. miR150 and miR155 were used as controls of non-regulated and c-Myb-regulated miRNA, respectively. The expression level of each miRNA in untreated sh-c-myb-infected cells was arbitrarily set to 100. Data are reported ± standard deviation. Statistical significance was calculated by two-tailed Student t test. ** P ≤ 0.01. qRT-PCR analyses were performed in triplicate in 2 independent experiments.
c-Myb transcription activation of miR200 is dependent on the presence of Myb binding sites in the regulatory regions of miR200 clusters
To understand whether c-Myb activates miR200s transcription by a DNA binding-dependent mechanism, we analyzed the promoter regions of miR200s on human chromosomes 1 and 12,35 utilizing the publicly available TFsearch program (http://www.cbrc.jp/research/db/TFSEARCH.html). We detected 5 potential Myb Binding Sites (MBS) in the promoter on chromosome 1 and 4 MBS in that on chromosome 12 within a distance of 2000 base pairs from the transcription start site (TSS). We cloned a region of approximately 2000 bp from TSS of the promoter on chromosome 1 and on chromosome 12 in pGL3-basic plasmid (named pGL3-prom-miR200ba429 and pGL3-prom-miR200c141, respectively), which includes all potential MBS detected by our in silico analysis (Fig. 3A and C). Luciferase assays were performed by co-transfection of each reporter vector with pcDNA3-c-mybHA expression plasmid in HEK-293 cells. c-Myb was able to activate the transcription from both pGL3-prom-miR200ba429 and pGL3-prom-miR200c141 (Fig. 3B and D). Furthermore, deletion of the region including the most distal MBS (Mut1) significantly decreased c-Myb-dependent promoter activation in both reporter vectors (Fig. 3B and D). Deletion of both distal MBS in each reporter vector (Mut2 for pGL3-prom-miR200ba429 and Mut2 and Mut3 for pGL3-prom-miR200c141) abolished c-Myb-dependent promoter activation (Fig. 3B and D). Site-directed mutagenesis (schematized in Fig. 4A and C) of the most distal MBS in pGL3-prom-miR200ba429 (-1134 to -1128 bp from TSS) significantly reduced c-Myb-dependent transcription activation compared with wt (MutD1, Fig. 4B), similarly to mutation of the second MBS (−1087 to −1081 bp from TSS) in the same reporter (MutD2, Fig. 4B). Also mutation of each of the 2 distal MBS in pGL3-prom-miR200c141 (−1653 to −1647 and −988 to −982 bp from TSS, respectively) independently decreased c-Myb-dependent transcription activation by similar levels (MutD1 and MutD2, Fig.4D). Double mutant (MutD1+D2) of both distal MBS in pGL3-prom-miR200ba429 and in pGL3-prom-miR200c141 lost responsiveness to c-Myb (Fig. 4C and D). Together, these data demonstrate that transcription activation by c-Myb is dependent on the presence of MBS in the promoter regions of both miR200 clusters.

Figure 3. (A and C) schematic representation of the human miR200s promoters on chromosome 1 (A) and on chromosome 12 (C) cloned in pGL3 basic reporter vector. Numbers indicate the distance from the transcription start site (TSS) represented as an arrow. Black boxes indicate the position of potential myb binding sites (MBS). The longest construct (wt) and the deletion mutants (Mut) generated for each promoter are represented in each scheme. (B and D) Luciferase assays were performed in HEK293 cells co-transfecting the indicated reporter vectors with the pcDNA3HA (empty vector, white bars) or the pcDNA3-c-mybHA (c-myb expressing, black bars) expression vectors. Transfection efficiency was normalized by co-transfecting a renilla luciferase-expressing vector. Assays were performed 48 h after transfection. Fold activation of each reporter vector co-transfected with pcDNA3HA was arbitrarily set to 1. Luciferase assays data are reported ± standard deviation. Statistical significance was calculated by two-tailed Student t test. ** P ≤ 0.01. n.s. = not significant. Experiments were performed twice in triplicate.

Figure 4. (A and C) Schematic representation of the human miR200s promoters on chromosome 1 (A) and on chromosome 12 (C) cloned in pGL3 basic reporter vector in which site specific mutagenesis was performed to mutate the 2 most distal MBS. The core MBS of each site is reported with the distance from transcription start site (TSS). The mutated nucleotides in each mutant are underlined. (B and D) luciferase assays were performed in HEK293 cells co-transfecting the wt and mutant reporter vectors with the pcDNA3HA (empty vector, white bars) or the pcDNA3-c-mybHA (c-myb expressing, black bars) expression vectors. Transfection efficiency was normalized by co-transfecting a renilla luciferase-expressing vector. Assays were performed 48 h after transfection. Fold-activation of each reporter vector co-transfected with pcDNA3HA was arbitrarily set to 1. Luciferase assays data are reported ± standard deviation. Statistical significance was calculated by two-tailed Student t test. ** p ≤ 0.01. n.s. = not significant. Experiments were performed twice in triplicate.
c-Myb binds to MBS in the regulatory regions of miR200 clusters
We performed chromatin crosslinking immunoprecipitation (ChIP) assays in HEK-293 cells transfected with the pHT2-c-Myb-Halo expression plasmid to assess whether c-Myb binds in vivo to the putative MBS in miR200s promoters. c-Myb-Halo expression in transfected cells was analyzed by immunoblotting (Fig. 5A). De-cross-linked DNA was analyzed by PCR using one pair of primers for a segment, including the 2 distal MBS miR200 promoter on chromosome 1 (since these sites were too close to be resolved in 2 distinct amplicons) and 1 pair for the proximal region of the same promoter (Fig. 5B) For miR200 promoter on chromosome 12, we designed 2 pairs of primers for each distal MBS and 1 pair for the proximal region (Fig. 5C). As a positive control, we used a pair of primers that amplify a region that includes a MBS in the adenosine deaminase gene (ADA),36 demonstrated to interact with c-Myb in ChIP assays.37 We detected amplified bands utilizing the primers for ADA control and for distal MBS on chromosome 1 and on chromosome 12 (Fig. 5B–D). No amplification was obtained with the primers for the proximal regions of the promoters on both chromosomes (Fig. 5B and C). These results indicate that c-Myb binds to both distal MBS on chromosome 12 (Fig. 5C). As for the 2 distal MBS on chromosome 1, we were unable to discriminate whether c-Myb binds to 1 or the other or both. Nevertheless, both sites are likely to bind c-Myb, since each one of them independently contributes to c-Myb-dependent transcription activation (Fig. 4B).

Figure 5. Chromatin crosslinking ImmunoPrecipitation (ChIP) to detect c-Myb binding at MBS in miR200 promoters.(A)Western blot analysis to detect c-Myb-Halo in HEK293 transfected with pHT2-c-Myb-Halo expression plasmid or with pHT2 empty vector. (B–D) PCR analyses were performed on immunoprecipitated DNA from pHT2-c-Myb-Halo- and pHT2-transfected cells with sets of primers designed to amplify regions containing both distal MBS sites and the entire proximal region on miR200 promoter on chromosome 1 (B), each distal site, and the entire proximal region on miR200 promoter on chromosome 12 (C), and a MBS in the adenosine deaminase gene (ADA) that was used as positive control (D). Each reaction was run 30 cycles. Amplifications performed with immunoprecipitated DNA from cells transfected with empty vector pHT2 were used as negative controls. Input DNA was used to test the amplification with each set of primers. ChIP experiments were performed twice with similar results.
ZEB1-mediated transcriptional repression is dominant over the c-Myb activation
TGF-β treatment of MCF-7 breast cancer cells induced upregulation of ZEB1, N-cadherin, and Vimentin and inhibition of epithelial markers such as E-cadherin, Desmoplakin, and Occludin (Fig. S3A). c-Myb expression increased slightly at 3 d of TGF-β treatment and remained close to the basal condition at day 6 (Fig. S3A). Regulation of ZEB1, E-cadherin, c-Myb, Vimentin, and phosphorylation of Smad2 after TGF-β treatment was confirmed by western blot analysis (Fig. S3B). At 3 and 6 d of TGF-β treatment, the expression of all members of miR200 family decreased (Fig. S3C).
During EMT-induced by TGF-β, miR200s are inhibited mainly by ZEB1.30,38 To assess the effect of ZEB1 on miR200 promoters in our model systems, we cloned the coding region of the human ZEB1 gene in pcDNA3-ZEB1HA expression vector, which expresses human ZEB1 tagged with an HA tag at the 3′ terminus (Fig. 6A). Luciferase assays performed co-transfecting pcDNA3-ZEB1HA with the reporter vectors containing the promoter regions of miR200 (pGL3-prom-miR200ba429 and pGL3-prom-miR200c141, respectively) demonstrated that ZEB1 strongly inhibited transcription from miR200 promoters (Fig. 6B). To test whether the repression exerted by ZEB1 on miR200s transcription can overcome the c-Myb-mediated activation, we used HEK293 and MCF-7 cells stably transfected with pcDNA3-c-mybHA to constitutively express c-MybHA. Luciferase assays performed in these cells co-transfected with fixed amounts of pGL3-prom-miR200ba429 and pGL3-prom-miR200c141 reporters and increasing amounts (from 0 to 50 ng/transfection) of pcDNA3-ZEB1HA. As expected, HEK293 and MCF-7 cells transfected with pcDNA3-c-mybHA showed significantly higher transcription compared with controls (HEK293 and MCF-7 cells stably transfected with the empty vector pcDNA3HA) (Fig. 6C). Increasing amounts of ZEB1 gradually decreased c-Myb-dependent activation of pGL3-prom-miR200ba429 and pGL3-prom-miR200c141 reporters to a point at which transcription was significantly lower than that of control cells transfected with the empty vector pcDNA3HA (Fig. 6C). Thus, when both c-Myb and ZEB1 are expressed, as during EMT, ZEB1 repression overcomes the activation of miR200s exerted by c-Myb.

Figure 6. (A)HEK293 cells transfected with pcDNA3-ZEB1HA expression vector or empty vector pcDNA3HA were tested by western blot for ZEB1HA expression 72 h after transfection using an anti-HA antibody. β-actin expression was used for normalization.(B)Luciferase assays were performed in HEK293 and MCF-7 cells co-transfected with the reporter vectors containing the miR200 promoter on chromosome 1 (left histograms) or the miR200 promoter on chromosome 12 (right histograms), and the expression vector pcDNA3-ZEB1HA or the empty vector pcDNA3HA.(C)Luciferase assays were performed in HEK293 (left histograms) and in MCF-7 cells (right histograms) stably transfected with the expression vector pcDNA3-c-mybHA or the empty vector pcDNA3HA. These cells were co-transfected with reporter vectors containing the miR200 promoter on chromosome 1 (top histograms) or the miR200 promoter on chromosome 12 (bottom histograms) and increasing amounts (from 0–50 ng/sample) of the expression vector pcDNA3-ZEB1HA. Fold-activation of cells co-transfected with the reporter vectors and the empty vector pcDNA3HA (white bars) was arbitrarily set to 1. Luciferase assays data are reported ± standard deviation. Statistical significance was calculated by two-tailed Student t test. Experiments were performed twice in triplicate.
Methylation of miR200 promoters during TGF-β-induced EMT
Hypermethylation of CpG islands in the promoter regions of miR200 plays a repressive role during TGF-β-induced EMT in non-primate mammalian cells.39 We tested the hypothesis that, in human cells treated with TGF-β, methylation of the miR200 promoters represents an epigenetic level of control independent from the presence of transcription activators and repressors. We compared the methylation level of miR200 promoters in 2 luminal (epithelial) and 1 triple-negative (mesenchymal) breast cancer cell lines (MCF-7, T47D, and MDA-MB-231, respectively) in basal conditions and after treatment with TGF-β using DNA high-resolution melting (HRM)40 and pyrosequencing.41 MCF-7 and T47D showed a significantly lower level of methylation of both miR200 promoters compared with MDA-MB-231 cell line (Fig. 7A and B). In the latter, methylation of the miR-200ba429 promoter could be further enhanced by TGF-β treatment (5 ng/ml for 9 d) (Fig. 7A). Since MCF-7 cells as well as other luminal-type breast cancer cell lines are less sensitive to short-term TGF-β treatment, we treated MCF-7 cells with TGF-β for longer times (up to 50 d). In this analysis, we included cells treated for 50 d and released from TGF-β for additional 10 d. Methylation increased at day 20 and further at day 50 of treatment in both promoters (Fig. 8A–D). In cells released from TGF-β for 10 d, methylation returned to basal levels (Fig. 8A and B). During TGF-β treatment, the expression of miR200 decreased at day 20, remained low at day 50, and increased to levels that remained lower than basal conditions after 10 d of TGF-β withdrawal (Fig. 8E and F). During TGF-β treatment, the expression of c-Myb slightly increased at day 20 to return to levels close to untreated cells at day 50 (Fig. 8G). Of interest, ZEB1 expression increased at day 20 and sharply decreased at day 50 to further decline after TGF-β withdrawal (Fig. 8G). These data indicate that long-term TGF-β treatment of luminal-type breast cancer cells causes methylation of miR200 promoters. During this process, miR200s expression remains low, even when ZEB1 decreases and c-Myb remains expressed (day 50).

Figure 7. (A and B) High-resolution melting (HRM) analysis of the indicated cell lines. Genomic DNA of each sample was sodium bisulfite-treated, amplified, and melted as described in “Materials and Methods”. (C and D) Pyrosequencing analysis: on the top of each panel the pyrosequenced regions in the miR200 promoter on chromosome 1 (C) and on chromosome 12 (D) are indicated. Numbers indicate the distance from the transcription start site. Vertical bars are the position of the Cs that can be methylated in each sequence. The mean methylation % of each pyrosequenced region of the indicated cell lines untreated or treated with TGF-β (5 ng/ml) is specified in the histograms (C and D). Each experimental point was pyrosequenced 3 times. d = days. Data are reported ± standard deviation.

Figure 8. (A and B) High-resolution melting (HRM) analysis of the indicated cell lines. Genomic DNA of each sample was sodium bisulfite-treated, amplified, and melted as described in “Materials and Methods”. (C and D) Pyrosequencing analysis: on the top of each panel the pyrosequenced regions in the miR200 promoter on chromosome 1 (C) and on chromosome 12 (D) are indicated. Numbers indicate the distance from the transcription start site. Vertical bars are the position of the Cs that can be methylated in each sequence. The mean methylation % of each pyrosequenced region of the indicated cell lines untreated or treated with TGF-β (5 ng/ml) is specified in the histograms (C and D). Each experimental point was pyrosequenced 3 times. Data are reported ± standard deviation. (E and F) Relative miRNA levels were measured by qRT-PCR in the indicated cell lines untreated or treated with TGF-β. miR200b, miR200a, and miR429 encoded by the cluster on chromosome 1 are shown in (E), miR200c and miR141 on chromosome 12 are in (F). (G) Analyses of mRNA levels of c-myb and ZEB1 were performed by qRT-PCR in the indicated cells untreated or treated with TGF-β. d, days. qRT-PCR data are reported ± standard deviation.
Correlation of c-Myb and miR200 expression in breast cancer patients
To demonstrate in patients the in vitro verified relations between c-MYB and miR200 family, we used publicly available clinical breast cancer expression data set with paired mRNA and miRNA genome-wide measurements across 207 patients.42 The correlation values between c-myb mRNA and 5 miRNAs (HSA-miR-200a, HSA-miR-200b, HSA-miR-200c, HSA-miR-141, HSA-miR-429) from miR200 family in the GSE22220 data set are presented in Table 1. The pairs c-myb and miRNA in Table 1 are ordered by the value of correlation. The last column reports p values that indicate significance of correlation values (for details see “Materials and Methods”, bioinformatics analysis). A significant correlation between c-Myb expression and that of 4 (miR200a, miR200b, miR200c, and miR141) out of 5 miR200s was highlighted by this analysis in breast cancer samples with p values between 0.003 and 0.026 (Table 1). Of interest, the correlation between miR200 and c-Myb expression was preserved in ER-negative breast cancer samples (Table S1).
Table 1. Correlation between c-MYB and miR200 family in GSE22220 data set (207 breast cancer patients).
| GENE (probe ID) | miRNA (probe ID) | Pearson correlation | P value |
|---|---|---|---|
| c-MYB (7000594) |
HSA-miR-200c (ILMN_3167002) |
0.28 |
0.026 |
| c-MYB (7000594) |
HSA-miR-200b (ILMN_3168294) |
0.26 |
0.003 |
| c-MYB (7000594) |
HSA-miR-141 (ILMN_3168064) |
0.13 |
0.01 |
| c-MYB (7000594) |
HSA-miR-200a (ILMN_3167801) |
0.10 |
0.01 |
| c-MYB (7000594) | HSA-miR-429 (ILMN_3167806) | -0.15 | 0.75 |
Discussion
miR200s and c-Myb are frequently expressed in breast cancer cell lines and tumors.24,31 Here we demonstrate, by ectopic expression and RNA silencing, that c-Myb activates the transcription of miR200s in cancer cells. Both miR200 clusters located on chromosome 1 (for miR200a, miR200b, and miR429) and on chromosome 12 (for miR200c and miR141) are controlled by c-Myb through a binding-dependent mechanism that recognizes MBS located in the promoter regions.
We previously demonstrated that miR200s negatively control the expression of c-Myb.26 However, inhibition by miR200s is not complete in such a way as to enable the expression of c-Myb and miR200s in the same cell.26 These data, together with those presented in this paper, define a crosstalk between c-Myb, and the miR200 family that may be relevant in some cancer types.
The functional meaning of c-Myb and miR200s expression in breast cancer is still debated. The expression of c-Myb is necessary for estrogen-dependent proliferation of ER+ breast cancer cells.25 By contrast, another study identifies a subgroup of ER+ breast cancer patients with good prognosis that express low levels of innate inflammatory genes and c-Myb.43 As regards miR200s, their role in opposing EMT by inhibiting ZEB1 and Zeb2 expression is well established.35 Nevertheless, clinical and experimental models of breast cancer demonstrate that overexpression of miR-200s is associated with increased risk of metastasis in breast cancer patients and promotes metastatic colonization in mouse models.8
The expression of some genes during the execution of the EMT process can interfere with tumor sensitivity to chemotherapeutic treatment.44 During EMT, the expression of miR200s is downregulated by ZEB1, Snail, and Slug (SNAI2) in tumors of epithelial origin.45 On the other hand, miR200s expression is necessary at the metastasis site to regain the epithelial phenotype and to target the expression of SEC23A, which mediates secretion of metastasis-suppressive proteins.8 Recent data suggest that the role of miRs and proteins involved in the metastatic process must be evaluated in a spatio-temporal context. Using an elegant in vivo model, Tsai et al. demonstrated that the EMT inducer Twist 1 needs to be downregulated to allow the reversion to an epithelial phenotype through a mesenchymal to epithelial (MET) process and to permit the development of macrometastases.46 These data imply that the acquisition of mesenchymal phenotype by EMT during the metastatic process is a transient state that can be reverted at the metastasis site. We induced mesenchymal features in breast cancer cells in vitro by treatment with the EMT inducer TGF-β, which upregulates ZEB1 and Vimentin and downregulates epithelial markers such as E-cadherin, Occludin, and Desmoplakin. During this process, c-Myb is still expressed, while miR200 are repressed. The latter observation is in apparent contrast with the role of c-Myb as an activator of miR200s. A possible explanation rests on the expression of miR200s repressor(s) (such as ZEB1) at the onset of EMT that overcomes c-Myb-dependent activation. In vitro, we show that ZEB1 has, indeed, a dominant-repressive effect on miR200s transcription when it is co-expressed with c-Myb. It is conceivable that also in vivo, c-Myb can promote, together with other activators, the expression of miR200s in the primary tumor, but at the onset of EMT, when the repressor ZEB1 is expressed, c-Myb-dependent activation of miR200s terminates even if c-Myb continues to be expressed.
DNA methylation plays an additional role in controlling the expression of miRs in tumor progression.47,48 Previous data in canine cells demonstrated that miR200 promoters are repressed by DNA methylation during TGF-β-induced EMT.39 In addition, dynamic methylation of miR200 promoters mediates epithelial and mesenchymal transitions in colon tumorigenesis.48 We show that in human breast cancer cells treated with TGF-β for an extensive time (50 d), miR200 promoters are methylated; the expression of miR200s is inhibited; and ZEB1 levels decrease. At this time, c-Myb is expressed similarly to cells in basal conditions. Thus, it is conceivable that promoter methylation has a repressive effect on miR200 expression, regardless of ZEB1 repression and/or c-Myb activation. These data support the concept that during distinct phases of tumor progression, the role of the genes involved in the process may change in relation to the expression of other regulators and to epigenetic changes.
In light of the complexity of their respective regulations, the correlation between the expression of c-Myb and that of 4 out of 5 miR200s observed in a data set of 207 breast cancer patients was not a totally predictable result. In fact, miR200 expression depends not only on the presence of c-Myb, and possibly other transcription activators, but also on the expression of strong repressors such as ZEB1 and on the methylation of miR200 promoters. Although limited to one data set of patients, the observed correlation suggests a strong link between c-Myb and miR200s that warrants larger ex vivo surveys to understand the role of these factors in breast cancer.
In summary, this paper demonstrates that c-Myb positively controls the expression of miR200s by a transcriptional, binding-dependent mechanism. Expression of ZEB1 and epigenetic changes such as DNA methylation can overcome c-Myb-dependent activation of miR200 expression. The relationship between miR200s and c-Myb is further highlighted by a significant correlation between their expression in breast cancer patients.
Materials and Methods
Cell lines
MCF-749 and T47D50 ER+ breast cancer cells, MDA-MB-23151 triple-negative breast cancer cells and HEK293 kidney cells52 (ATCC) were cultured in DMEM/high glucose (Euroclone) supplemented by 10% fetal calf serum (FCS, Euroclone) at 37 °C in 5% CO2, 100% humidity. Recombinant TGF-β (PeproTech Inc) was used at a final concentration of 5 ng/ml in the culture medium. In long-term experiments, medium-containing TGF-β was replaced every 3 d.
Cloning
Promoter regions of miR200 clusters located on chromosomes 1 and 12 were amplified using the primers listed in Table S2 and cloned in pGL3-basic vector (Promega) by standard cloning procedures. Deletion mutants were generated in pGL3-basic vector by amplification of the pGL3-prom-miR200-chrom1 and pGL3-prom-miR200-chrom12 plasmids used as templates utilizing the upstream primers and the downstream primer used for the wild type forms listed in Table S2. Site-directed mutants were generated using the QuikChange® II XL Site-Directed Mutagenesis Kit (Stratagene). Primers for site-directed mutagenesis are listed in Table S2. The coding sequence of human ZEB1 in frame with an HA tag was cloned in pcDNA3 vector from cDNA obtained from MDA-MB-231 cells according to standard procedures. Primers used for retrotranscription and the upstream primers are listed in Table S2. The sequence of each plasmid generated for this paper was checked by dideoxysequencing.
c-Myb transfection and silencing
Stable transfections were performed by transfecting cells with pcDNA3-c-mybHA containing the full-length cDNA for human c-myb using Lipofectamine 2000 (Invitrogen). G418 (Sigma Aldrich) selection (600–800 μg/ml) was started 48 h after transfection. Mixed populations were expanded for 14–21 d and tested for c-Myb expression by western blot analysis. siRNA transfection. Cells were transfected with a pool of siRNA (10–100 nM) against human c-myb mRNA or with a pool of non-targeting siRNA as control (Dharmacon), using Interferin (Poly Plus Trasfection, Illkirch). Lentiviral infections were performed with lentiviral vector pLV-EV (empty vector) and pLV-shc-myb (encoding for an shRNA directed against c-myb) as described.53
Functional assays
Cells were co-transfected with wild-type reporters pGL3-prom-miR200-chrom1, and pGL3-prom-miR200-chrom12 plasmids containing the promoters regions of miR200, or their mutant forms, as indicated, and the expression vectors pcDNA3-c-mybHA (for c-Myb) or pcDNA3-ZEB1HA (for ZEB1) using Lipofectamine 2000 (Invitrogen). Luciferase assays were performed using a commercial detection kit (Perkin Elmer Life Sciences). Each experimental point was analyzed in triplicate in 2 independent experiments. Statistical significance (P) was calculated by two-tailed Student t test.
Chromatin immunoprecipitation (ChIP)
15 × 106 cells were seeded and transfected with HaloTagged pHT2-c-Myb-Halo or with the empty vector pHT2 (Promega) utilizing TransFast™ Transfection Reagent (Promega). Cross-linking was performed 24 h post-transfection. The HaloCHIP procedure was performed according to the manufacturer’s instructions (HaloCHIP™ System, Promega). Primers used for amplification of the regions including the potential Myb binding sites in the promoter regions of miR200 and in the Adenosine Deaminase (ADA) gene (used as control) are listed in the Table S2.
RNA extraction and real-time qPCR analyses
RNA was extracted from 106 cells using the mirVana RNA isolation kit (cat. number AM1560, Ambion, Inc), according to the manufacturer’s instructions. Reverse transcription was performed by using M-MuLV Reverse Transcriptase and Random Primer Mix (cat. number: M0253S and S1330S, respectively, New England Biolabs Inc) according to the manufacturer’s instructions. Quantitative PCR was performed using an Illumina Eco PCR machine (Illumina Inc), by using Power Sybr Green PCR master mix (Applied Biosystems), using the primers listed in the Table S2. The miRNA reverse transcription was performed by using 10 ng of RNA, TaqMan MicroRNA Reverse Transcription kit (cat. number: 4366596, Applied biosystems), and TaqMan MicroRNA Assays for miR-200a miR-200b, miR-200c, miR-141, miR155, miR150, and U6 as endogenous control (Applied Biosystems), and Fast Universal PCR Master Mix, No AmpErase UNG (cat. number: 4352042, Applied biosystems). Illumina Software (Illumina Inc) was used to calculate relative RNA amounts. In real-time qPCR experiments each sample was run in triplicate in 2 independent experiments. Statistical significance (P) was calculated by two-tailed Student t test.
Western blot analysis
Western blot analyses were performed as previously described.26 The following antibodies were used: anti-c-Myb, clone1.1 (cat. number: 05–175, Merck Millipore S.A.S), anti β-actin (cat. number: A5441, Sigma Aldrich), anti Smad2 (cat. number: 3122, Cell Signaling Technology, Inc), and phospho-Smad2 (cat. number: 3101, Cell Signaling technology, Inc), anti ZEB1 (cat. number: HPA027524, Sigma Aldrich), anti Vimentin (cat. number: V6630, Sigma Aldrich), anti E-cadherin (cat. number: 610181, BD Transduction Laboratories), anti-HA.11 polyclonal antibody (Covance Inc) anti-mouse-HRP conjugated (cat. number: SC-2002, Santa Cruz Biotechnology Inc), anti-goat-HRP conjugated (cat. number: SC-2020, Santa Cruz), anti-rabbit-HRP conjugated (cat. number: SC-2004, Santa Cruz).
Genomic DNA extraction, sodium bisulfite treatment, and high resolution melting
Genomic DNA was extracted using the Promega SV genomic DNA kit (Promega). Genomic DNA was bisulfite-treated and purified with EZ Methylation Gold kit (Zymo Research Corp). PCR and HRM were performed in Melt Doctor HRM Master Mix (Applied Biosystems). Primers utilized for amplification are listed in Table 2. Data analysis was performed using the HRM dedicated software (Illumina Inc).
Pyrosequencing
Bisulfite-treated genomic DNA was pyrosequenced using the Pyromark Gold Q24 Reagents kit (Qiagen) with a sequencing primer in the Pyrosequencer Pyromark Q24 (Qiagen). Data analysis was performed using the Pyromark Q24 2.0.6 software. Amplification and sequencing primers used for the pyrosequencing procedure were designed by the Pyromark Assay Design 2.0 (Qiagen). Primers are listed in Table S2.
Bioinformatics analysis
Expression data with paired mRNA and miRNA genome wide measurements were downloaded from GEO omnibus repository (data set GSE22220, 207 patients).42 For each sample (either mRNA or miRNA) probes were ordered by expression value, and for each probe, expression rank was computed (i.e., rank 100 means the top expressed probe in the sample, rank 55 means that 55 percent of probes have lower expression value in the sample). Expression rank reflects relative expression level and is more consistent, as it requires no normalization and thus introduces no normalization bias.54 Only rank information was used for analyses. Pearson correlation coefficient was computed as a measure of correlation between mRNA or miRNA rank expression profiles. To estimate statistical significance of correlation between c-Myb and 5 miRNAs (miR200 family) in the data set (see Table 1, P value column), we used Monte Carlo simulation procedure.55 Ten thousand times a gene and 5 miRNAs were sampled randomly, and 5 correlation values were computed (gene profile vs. 5 miRNAs profiles). Each time, 5 correlation values were ordered by the correlation value. At the end, we got 5 columns of 10 000 values each. The first column corresponds to the top correlation values observed for randomly sampled gene and randomly sampled 5 miRNAs, second column represents the distribution for the second best correlation value and so on. The distributions were used to derive empirical probability to sample randomly a gene and 5 miRNAs with correlations equal (or higher) then the one observed in the data set for c-MYB and miR200 family.
Supplementary Material
Acknowledgments
We thank Dr G. Bossi for assistance with lentiviral infections. This work was sponsored by a grant from the Italian Ministry of Education, University and Research (MIUR) to GR, by the Medical Research Council, UK; and by grants from ACC12, MIUR/PRIN (20078P7T3K_001), AIRC (2011-IG11955), AIRC 5xmille (MCO #9979), Telethon GGPO9133, Min. Salute IDI-IRCCS (RF08 c.15, RF07 c.57) to GM.
Glossary
Abbreviations:
- ADA
adenosine deaminase gene
- AML
acute myeloid leukaemia
- CHIP
chromatin crosslinking immunoprecipitation
- CLL
chronic lymphocytic leukemia
- Doxy
doxycyclin
- EMT
epithelial-mesenchymal transition
- ER+
estrogen receptor positive
- MBS
myb binding sites
- miR
micro RNA
- T-ALL
T-cell acute lymphoblastic leukemia
- TSS
transcription start site
Disclosure of Potential Conflicts of Interest
No potential conflicts of interest were disclosed.
Footnotes
Previously published online: www.landesbioscience.com/journals/cc/article/25405
References
- 1.Minn AJ, Bevilacqua E, Yun J, Rosner MR. Identification of novel metastasis suppressor signaling pathways for breast cancer. Cell Cycle. 2012;11:2452–7. doi: 10.4161/cc.20624. [DOI] [PMC free article] [PubMed] [Google Scholar]
- 2.Lujambio A, Lowe SW. The microcosmos of cancer. Nature. 2012;482:347–55. doi: 10.1038/nature10888. [DOI] [PMC free article] [PubMed] [Google Scholar]
- 3.Calin GA, Dumitru CD, Shimizu M, Bichi R, Zupo S, Noch E, et al. Frequent deletions and down-regulation of micro- RNA genes miR15 and miR16 at 13q14 in chronic lymphocytic leukemia. Proc Natl Acad Sci U S A. 2002;99:15524–9. doi: 10.1073/pnas.242606799. [DOI] [PMC free article] [PubMed] [Google Scholar]
- 4.Valastyan S, Weinberg RA. Tumor metastasis: molecular insights and evolving paradigms. Cell. 2011;147:275–92. doi: 10.1016/j.cell.2011.09.024. [DOI] [PMC free article] [PubMed] [Google Scholar]
- 5.Ma L, Teruya-Feldstein J, Weinberg RA. Tumour invasion and metastasis initiated by microRNA-10b in breast cancer. Nature. 2007;449:682–8. doi: 10.1038/nature06174. [DOI] [PubMed] [Google Scholar]
- 6.Tucci P, Agostini M, Grespi F, Markert EK, Terrinoni A, Vousden KH, et al. Loss of p63 and its microRNA-205 target results in enhanced cell migration and metastasis in prostate cancer. Proc Natl Acad Sci U S A. 2012;109:15312–7. doi: 10.1073/pnas.1110977109. [DOI] [PMC free article] [PubMed] [Google Scholar]
- 7.Bracken CP, Gregory PA, Kolesnikoff N, Bert AG, Wang J, Shannon MF, et al. A double-negative feedback loop between ZEB1-SIP1 and the microRNA-200 family regulates epithelial-mesenchymal transition. Cancer Res. 2008;68:7846–54. doi: 10.1158/0008-5472.CAN-08-1942. [DOI] [PubMed] [Google Scholar]
- 8.Korpal M, Ell BJ, Buffa FM, Ibrahim T, Blanco MA, Celià-Terrassa T, et al. Direct targeting of Sec23a by miR-200s influences cancer cell secretome and promotes metastatic colonization. Nat Med. 2011;17:1101–8. doi: 10.1038/nm.2401. [DOI] [PMC free article] [PubMed] [Google Scholar]
- 9.Ramsay RG, Gonda TJ. MYB function in normal and cancer cells. Nat Rev Cancer. 2008;8:523–34. doi: 10.1038/nrc2439. [DOI] [PubMed] [Google Scholar]
- 10.Mizuguchi G, Nakagoshi H, Nagase T, Nomura N, Date T, Ueno Y, et al. DNA binding activity and transcriptional activator function of the human B-myb protein compared with c-MYB. J Biol Chem. 1990;265:9280–4. [PubMed] [Google Scholar]
- 11.Mucenski ML, McLain K, Kier AB, Swerdlow SH, Schreiner CM, Miller TA, et al. A functional c-myb gene is required for normal murine fetal hepatic hematopoiesis. Cell. 1991;65:677–89. doi: 10.1016/0092-8674(91)90099-K. [DOI] [PubMed] [Google Scholar]
- 12.Thomas MD, Kremer CS, Ravichandran KS, Rajewsky K, Bender TP. c-Myb is critical for B cell development and maintenance of follicular B cells. Immunity. 2005;23:275–86. doi: 10.1016/j.immuni.2005.08.005. [DOI] [PubMed] [Google Scholar]
- 13.Bender TP, Kremer CS, Kraus M, Buch T, Rajewsky K. Critical functions for c-Myb at three checkpoints during thymocyte development. Nat Immunol. 2004;5:721–9. doi: 10.1038/ni1085. [DOI] [PubMed] [Google Scholar]
- 14.Ramsay RG. c-Myb a stem-progenitor cell regulator in multiple tissue compartments. Growth Factors. 2005;23:253–61. doi: 10.1080/08977190500233730. [DOI] [PubMed] [Google Scholar]
- 15.Karafiat V, Dvorakova M, Krejci E, Kralova J, Pajer P, Snajdr P, et al. Transcription factor c-Myb is involved in the regulation of the epithelial-mesenchymal transition in the avian neural crest. Cell Mol Life Sci. 2005;62:2516–25. doi: 10.1007/s00018-005-5297-7. [DOI] [PMC free article] [PubMed] [Google Scholar]
- 16.Anfossi G, Gewirtz AM, Calabretta B. An oligomer complementary to c-myb-encoded mRNA inhibits proliferation of human myeloid leukemia cell lines. Proc Natl Acad Sci U S A. 1989;86:3379–83. doi: 10.1073/pnas.86.9.3379. [DOI] [PMC free article] [PubMed] [Google Scholar]
- 17.Calabretta B, Sims RB, Valtieri M, Caracciolo D, Szczylik C, Venturelli D, et al. Normal and leukemic hematopoietic cells manifest differential sensitivity to inhibitory effects of c-myb antisense oligodeoxynucleotides: an in vitro study relevant to bone marrow purging. Proc Natl Acad Sci U S A. 1991;88:2351–5. doi: 10.1073/pnas.88.6.2351. [DOI] [PMC free article] [PubMed] [Google Scholar]
- 18.Clappier E, Cuccuini W, Kalota A, Crinquette A, Cayuela JM, Dik WA, et al. The C-MYB locus is involved in chromosomal translocation and genomic duplications in human T-cell acute leukemia (T-ALL), the translocation defining a new T-ALL subtype in very young children. Blood. 2007;110:1251–61. doi: 10.1182/blood-2006-12-064683. [DOI] [PubMed] [Google Scholar]
- 19.Lahortiga I, De Keersmaecker K, Van Vlierberghe P, Graux C, Cauwelier B, Lambert F, et al. Duplication of the MYB oncogene in T cell acute lymphoblastic leukemia. Nat Genet. 2007;39:593–5. doi: 10.1038/ng2025. [DOI] [PubMed] [Google Scholar]
- 20.Biroccio A, Benassi B, D’Agnano I, D’Angelo C, Buglioni S, Mottolese M, et al. c-Myb and Bcl-x overexpression predicts poor prognosis in colorectal cancer: clinical and experimental findings. Am J Pathol. 2001;158:1289–99. doi: 10.1016/S0002-9440(10)64080-1. [DOI] [PMC free article] [PubMed] [Google Scholar]
- 21.Hugo H, Cures A, Suraweera N, Drabsch Y, Purcell D, Mantamadiotis T, et al. Mutations in the MYB intron I regulatory sequence increase transcription in colon cancers. Genes Chromosomes Cancer. 2006;45:1143–54. doi: 10.1002/gcc.20378. [DOI] [PubMed] [Google Scholar]
- 22.Thompson MA, Rosenthal MA, Ellis SL, Friend AJ, Zorbas MI, Whitehead RH, et al. c-Myb down-regulation is associated with human colon cell differentiation, apoptosis, and decreased Bcl-2 expression. Cancer Res. 1998;58:5168–75. [PubMed] [Google Scholar]
- 23.Kauraniemi P, Hedenfalk I, Persson K, Duggan DJ, Tanner M, Johannsson O, et al. MYB oncogene amplification in hereditary BRCA1 breast cancer. Cancer Res. 2000;60:5323–8. [PubMed] [Google Scholar]
- 24.Guérin M, Sheng ZM, Andrieu N, Riou G. Strong association between c-myb and oestrogen-receptor expression in human breast cancer. Oncogene. 1990;5:131–5. [PubMed] [Google Scholar]
- 25.Drabsch Y, Hugo H, Zhang R, Dowhan DH, Miao YR, Gewirtz AM, et al. Mechanism of and requirement for estrogen-regulated MYB expression in estrogen-receptor-positive breast cancer cells. Proc Natl Acad Sci U S A. 2007;104:13762–7. doi: 10.1073/pnas.0700104104. [DOI] [PMC free article] [PubMed] [Google Scholar]
- 26.Cesi V, Casciati A, Sesti F, Tanno B, Calabretta B, Raschellà G. TGFβ-induced c-Myb affects the expression of EMT-associated genes and promotes invasion of ER+ breast cancer cells. Cell Cycle. 2011;10:4149–61. doi: 10.4161/cc.10.23.18346. [DOI] [PubMed] [Google Scholar]
- 27.Ramsay R. Myb: getting involved in EMT. Cell Cycle. 2012;11:433–4. doi: 10.4161/cc.11.3.19168. [DOI] [PubMed] [Google Scholar]
- 28.Sala A. c-MYB and TGFβ: EMT’s dynamic duo in breast cancer. Cell Cycle. 2012;11:17. doi: 10.4161/cc.11.1.18733. [DOI] [PubMed] [Google Scholar]
- 29.Buechner J, Einvik C. N-myc and noncoding RNAs in neuroblastoma. Mol Cancer Res. 2012;10:1243–53. doi: 10.1158/1541-7786.MCR-12-0244. [DOI] [PubMed] [Google Scholar]
- 30.Burk U, Schubert J, Wellner U, Schmalhofer O, Vincan E, Spaderna S, et al. A reciprocal repression between ZEB1 and members of the miR-200 family promotes EMT and invasion in cancer cells. EMBO Rep. 2008;9:582–9. doi: 10.1038/embor.2008.74. [DOI] [PMC free article] [PubMed] [Google Scholar]
- 31.Castilla MA, Díaz-Martín J, Sarrió D, Romero-Pérez L, López-García MÁ, Vieites B, et al. MicroRNA-200 family modulation in distinct breast cancer phenotypes. PLoS One. 2012;7:e47709. doi: 10.1371/journal.pone.0047709. [DOI] [PMC free article] [PubMed] [Google Scholar]
- 32.Vargova K, Curik N, Burda P, Basova P, Kulvait V, Pospisil V, et al. MYB transcriptionally regulates the miR-155 host gene in chronic lymphocytic leukemia. Blood. 2011;117:3816–25. doi: 10.1182/blood-2010-05-285064. [DOI] [PubMed] [Google Scholar]
- 33.Xiao C, Calado DP, Galler G, Thai TH, Patterson HC, Wang J, et al. miR-150 controls B cell differentiation by targeting the transcription factor c-Myb. Cell. 2007;131:146–59. doi: 10.1016/j.cell.2007.07.021. [DOI] [PubMed] [Google Scholar]
- 34.Gantier MP, McCoy CE, Rusinova I, Saulep D, Wang D, Xu D, et al. Analysis of microRNA turnover in mammalian cells following Dicer1 ablation. Nucleic Acids Res. 2011;39:5692–703. doi: 10.1093/nar/gkr148. [DOI] [PMC free article] [PubMed] [Google Scholar]
- 35.Gregory PA, Bert AG, Paterson EL, Barry SC, Tsykin A, Farshid G, et al. The miR-200 family and miR-205 regulate epithelial to mesenchymal transition by targeting ZEB1 and SIP1. Nat Cell Biol. 2008;10:593–601. doi: 10.1038/ncb1722. [DOI] [PubMed] [Google Scholar]
- 36.Ess KC, Whitaker TL, Cost GJ, Witte DP, Hutton JJ, Aronow BJ. A central role for a single c-Myb binding site in a thymic locus control region. Mol Cell Biol. 1995;15:5707–15. doi: 10.1128/mcb.15.10.5707. [DOI] [PMC free article] [PubMed] [Google Scholar]
- 37.Berge T, Matre V, Brendeford EM, Saether T, Lüscher B, Gabrielsen OS. Revisiting a selection of target genes for the hematopoietic transcription factor c-Myb using chromatin immunoprecipitation and c-Myb knockdown. Blood Cells Mol Dis. 2007;39:278–86. doi: 10.1016/j.bcmd.2007.05.007. [DOI] [PubMed] [Google Scholar]
- 38.Zheng H, Kang Y. Multilayer control of the EMT master regulators. Oncogene. 2013 doi: 10.1038/onc.2013.128. [DOI] [PubMed] [Google Scholar]
- 39.Gregory PA, Bracken CP, Smith E, Bert AG, Wright JA, Roslan S, et al. An autocrine TGF-beta/ZEB/miR-200 signaling network regulates establishment and maintenance of epithelial-mesenchymal transition. Mol Biol Cell. 2011;22:1686–98. doi: 10.1091/mbc.E11-02-0103. [DOI] [PMC free article] [PubMed] [Google Scholar]
- 40.Vossen RH, Aten E, Roos A, den Dunnen JT. High-resolution melting analysis (HRMA): more than just sequence variant screening. Hum Mutat. 2009;30:860–6. doi: 10.1002/humu.21019. [DOI] [PubMed] [Google Scholar]
- 41.Ahmadian A, Ehn M, Hober S. Pyrosequencing: history, biochemistry and future. Clin Chim Acta. 2006;363:83–94. doi: 10.1016/j.cccn.2005.04.038. [DOI] [PubMed] [Google Scholar]
- 42.Buffa FM, Camps C, Winchester L, Snell CE, Gee HE, Sheldon H, et al. microRNA-associated progression pathways and potential therapeutic targets identified by integrated mRNA and microRNA expression profiling in breast cancer. Cancer Res. 2011;71:5635–45. doi: 10.1158/0008-5472.CAN-11-0489. [DOI] [PubMed] [Google Scholar]
- 43.Nicolau M, Levine AJ, Carlsson G. Topology based data analysis identifies a subgroup of breast cancers with a unique mutational profile and excellent survival. Proc Natl Acad Sci U S A. 2011;108:7265–70. doi: 10.1073/pnas.1102826108. [DOI] [PMC free article] [PubMed] [Google Scholar]
- 44.Oliveras-Ferraros C, Corominas-Faja B, Cufí S, Vazquez-Martin A, Martin-Castillo B, Iglesias JM, et al. Epithelial-to-mesenchymal transition (EMT) confers primary resistance to trastuzumab (Herceptin) Cell Cycle. 2012;11:4020–32. doi: 10.4161/cc.22225. [DOI] [PMC free article] [PubMed] [Google Scholar]
- 45.Thiery JP, Acloque H, Huang RY, Nieto MA. Epithelial-mesenchymal transitions in development and disease. Cell. 2009;139:871–90. doi: 10.1016/j.cell.2009.11.007. [DOI] [PubMed] [Google Scholar]
- 46.Tsai JH, Donaher JL, Murphy DA, Chau S, Yang J. Spatiotemporal regulation of epithelial-mesenchymal transition is essential for squamous cell carcinoma metastasis. Cancer Cell. 2012;22:725–36. doi: 10.1016/j.ccr.2012.09.022. [DOI] [PMC free article] [PubMed] [Google Scholar]
- 47.Asangani IA, Harms PW, Dodson L, Pandhi M, Kunju LP, Maher CA, et al. Genetic and epigenetic loss of microRNA-31 leads to feed-forward expression of EZH2 in melanoma. Oncotarget. 2012;3:1011–25. doi: 10.18632/oncotarget.622. [DOI] [PMC free article] [PubMed] [Google Scholar]
- 48.Davalos V, Moutinho C, Villanueva A, Boque R, Silva P, Carneiro F, et al. Dynamic epigenetic regulation of the microRNA-200 family mediates epithelial and mesenchymal transitions in human tumorigenesis. Oncogene. 2012;31:2062–74. doi: 10.1038/onc.2011.383. [DOI] [PMC free article] [PubMed] [Google Scholar]
- 49.Soule HD, Vazguez J, Long A, Albert S, Brennan M. A human cell line from a pleural effusion derived from a breast carcinoma. J Natl Cancer Inst. 1973;51:1409–16. doi: 10.1093/jnci/51.5.1409. [DOI] [PubMed] [Google Scholar]
- 50.Westley B, Rochefort H. A secreted glycoprotein induced by estrogen in human breast cancer cell lines. Cell. 1980;20:353–62. doi: 10.1016/0092-8674(80)90621-2. [DOI] [PubMed] [Google Scholar]
- 51.Brinkley BR, Beall PT, Wible LJ, Mace ML, Turner DS, Cailleau RM. Variations in cell form and cytoskeleton in human breast carcinoma cells in vitro. Cancer Res. 1980;40:3118–29. [PubMed] [Google Scholar]
- 52.Graham FL, Smiley J, Russell WC, Nairn R. Characteristics of a human cell line transformed by DNA from human adenovirus type 5. J Gen Virol. 1977;36:59–74. doi: 10.1099/0022-1317-36-1-59. [DOI] [PubMed] [Google Scholar]
- 53.Tanno B, Sesti F, Cesi V, Bossi G, Ferrari-Amorotti G, Bussolari R, et al. Expression of Slug is regulated by c-Myb and is required for invasion and bone marrow homing of cancer cells of different origin. J Biol Chem. 2010;285:29434–45. doi: 10.1074/jbc.M109.089045. [DOI] [PMC free article] [PubMed] [Google Scholar]
- 54.Antonov AV, Knight RA, Melino G, Barlev NA, Tsvetkov PO. MIRUMIR: an online tool to test microRNAs as biomarkers to predict survival in cancer using multiple clinical data sets. Cell Death Differ. 2013;20:367. doi: 10.1038/cdd.2012.137. [DOI] [PMC free article] [PubMed] [Google Scholar]
- 55.Antonov AV. BioProfiling.de: analytical web portal for high-throughput cell biology. Nucleic Acids Res. 2011;39(Web Server issue):W323-7. doi: 10.1093/nar/gkr372. [DOI] [PMC free article] [PubMed] [Google Scholar]
Associated Data
This section collects any data citations, data availability statements, or supplementary materials included in this article.