Abstract
The effect of temperature and relative humidity (RH) on the stability of imidapril hydrochloride (IMD) in solid state was investigated. The main aim of this study was to determine the most appropriate conditions of storage and manufacture of IMD so that the efficiency of the technological process could be improved and its costs could be minimized. A reversed-phase high-performance liquid chromatography was validated and applied for the determination of IMD degradation samples under the following operating conditions: stationary phase, LiChrospher 100 RP-18 (size 5 μm) 250 × 4 mm I.D., and mobile phase, acetonitrile–methanol–phosphate buffer, pH 2.0, 0.035 mol L−1 (60:10:30 v/v/v). The effect of temperature on IMD degradation rate was analyzed under increased RH ∼76.4% (within temperature range of 70–90°C) and decreased RH ∼0% (within temperature range of 90–110°C). The influence of RH was investigated under 90°C within RH range of 25.0–76.4%. IMD degradation accords with autocatalytic reaction model, and RH has no influence on its mechanism yet it increases its rate. The reaction also accelerates under high temperatures and in the presence of IMD degradation product. Pure IMD is more stable than other structurally related angiotensin-converting enzyme inhibitors, such as enalapril maleate, but it still should be stored in tightly closed containers and protected from moisture and high temperatures.
KEY WORDS: angiotensin-converting enzyme inhibitors, imidapril hydrochloride, RP-HPLC, stability, thermodynamics
INTRODUCTION
A crucial aspect of good manufacturing practice is quality control, which is aimed at the maintenance of high standards of purity and identity, appropriate for medicinal products’ intended use. Stability testing is an integral part of quality control and this issue is a question of interest not only due to the regulatory obligation to ensure the invariability of qualitative and quantitative composition during storage, but also it contributes to the economization and optimization of manufacture process, especially in case of unstable active pharmaceutical ingredients; the decomposition of which decreases their productivity. The aspect of drug stability is crucial also from the clinical point of view since the loss of active ingredient, caused by degradation, contributes to the deterioration of treatment efficiency. Drug’s stability can be influenced by various factors, such as environmental conditions (temperature, light, air humidity), package components, or substance chemical properties. Therefore, the determination of appropriate parameters for technological process and storage should lower the risk of excessive drug decay and result in reduction of economical expenses of manufacture (1).
In heterogeneous systems, such as solids, drug degradation is mostly dependent on relative air humidity (RH) and temperature level. Temperature is the primary factor affecting drug’s stability by inducing thermal acceleration of chemical reactions. RH also plays a role in catalyzing chemical degradation, mainly by two different mechanisms: adsorption onto the drug surface with consequent dissolution of an active ingredient in the formed moisture-sorbed layer and the direct participation in chemical process, as a substrate, leading to hydrolysis, hydration, isomerization, cyclization, and other bimolecular reactions. Hydrolysis is the most commonly encountered drug degradation reaction in solid state. Thus, the substances liable to hydrolysis should be investigated with reference to their sensitivity to temperature and RH variations. This applies particularly to compounds containing ester, lactone, lactam, amide, imide, peptide, or glycosidic bonds (2).
Angiotensin-converting enzyme inhibitors (ACE-I) are widely used for the treatment of cardiovascular system-related illnesses (3). This pharmaceutical class includes among others: imidapril hydrochloride (IMD), enalapril maleate (ENA), moexipril hydrochloride (MOXL), quinapril hydrochloride (QHCl), and benazepril hydrochloride (BEN), which are prodrug, ester-type, potent, long-acting, oral, dicarboxylate-containing agents that are hydrolyzed in vivo to their active, diacidic metabolites. The presence of ester functional in prodrug forms increases their lipophility and improves their pharmacokinetic profiles, but it also increases their susceptibility to hydrolysis and to other above-mentioned bimolecular reactions. This seems unfavorable from the clinical point of view, since the premature, ex vivo hydrolysis to diacidic form, caused for example by improper storage, could deteriorate their pharmacological effect by the impairment of their absorption. For this reason, the ester-type ACE-I should be subjected to detailed stability studies in order to evaluate their sensitivity to temperature and RH changes since these factors can increase hydrolysis (4). The relevant stability data have been found for the following ACE-I: ENA (5), MOXL (6), QHCl (7, 8), and BEN (9). They have been proven to be unstable under increased RH and temperature conditions and their degradation impurities have been also identified. BEN was found to undergo hydrolysis to form benazeprilat (9), ENA produced diketopiperazine (DKP) derivative after intramolecular cyclization irrespective of RH conditions (5), and MOXL formed DKP derivative under dry air conditions while under RH ∼76.4% DKP derivative and moexiprilat (6), and QHCl was evidenced to form three degradation products: DKP, quinaprilat, and quinaprilat DKP derivative (7, 8). Additionally, in our studies with IMD, we have shown that this drug follows two parallel degradation pathways under the conditions of T = 363 K, RH ∼76.4%, i.e., hydrolysis of ester bond with the formation of imidaprilat, and intramolecular cyclization between the neighboring amino acids with the formation of IMD diketopiperazine derivative (10). Also, the reaction of IMD hydrolysis with one degradation product has been described for a binary (1:1 w/w) mixture of IMD and magnesium stearate (11). Unfortunately, the information on the stability of this drug in solid state is scarce. One available study describes its compatibility with magnesium stearate (11), and the other one emphasizes the utility of reversed-phase high-performance liquid chromatography (RP-HPLC) method to its stability evaluation (12), while the recent report identifies its degradation pathways under high moisture conditions (10). Therefore, the main aim of this research was to evaluate the influence of RH and temperature on IMD degradation kinetic and thermodynamic parameters, which would further enable us to establish the optimal, environmental conditions of storage and manufacture for this compound, providing some valuable clues for manufacturers.
The following analytical methods have been reported for the determination of IMD: RP-HPLC (11, 12), classical first and second derivative UV technique (12), GC-MS (13), spectrophotometric determination based on the alkaline oxidation of the drug with potassium manganate (VII) (14), and radioimmunoassay (15). For this study, the RP-HPLC method was selected due to its relative simplicity, accuracy, low costs, and wide availability. We also decided to compare the stability of two structurally related ACE-I, i.e., IMD and ENA. The conclusions from our structure–stability relationship analysis could facilitate the future drug molecule design.
METHODS
Materials and Reagents
Imidapril hydrochloride was kindly provided by Jelfa S.A. (Jelenia Góra, Poland). Oxymetazoline hydrochloride was supplied by Novartis (Basel, Switzerland). Sodium chloride (American Chemical Society (ACS) reagent grade), sodium nitrate (ACS reagent grade), potassium iodide (ACS reagent grade), sodium bromide (ACS reagent grade), sodium iodide (ACS reagent grade), and potassium dihydrogen phosphate (ACS reagent grade) were obtained from Sigma-Aldrich (Steinheim, Germany). The other reagents were the following: phosphoric(V) acid 85% (Ph Eur, BP, JP, NF, E 338 grade, Merck, Darmstadt, Germany), acetonitrile (9017 Ultra Gradient, for HPLC, Ph Eur. grade, J.T. Baker, Deventer, the Netherlands), and methanol (HPLC grade, Merck, Darmstadt, Germany).
Instruments
The chromatographic separation was performed on a Shimadzu liquid chromatograph consisting of Rheodyne 7125, 100 μL fixed loop injector, UV–VIS SPO-6AV detector, LC-6A pump, and C-RGA Chromatopac integrator. As a stationary phase, a LiChrospher 100 RP-18 column with particle size of 5 μm, 250 × 4 mm (Merck, Darmstadt, Germany), was employed. The apparatus was not equipped in thermostating column nor in an autosampler; therefore, the technique employing an internal standard (IS)—a methanolic solution of oxymetazoline hydrochloride—had to be used. This neutralized the error inherent during sample injection and eliminated random errors.
Preparation of IS
The exact amount of 20.0 mg of oxymetazoline hydrochloride was dissolved in 100 mL of methanol to produce a final concentration of 0.20 mg mL−1.
Mobile Phase
The applied mobile phase was a mixture of acetonitrile–methanol–aqueous phosphate buffer, pH 2.0, 0.035 mol L−1 (60:10:30 v/v/v). It was filtered through a filter (0.22 μm) and degassed by ultrasound prior to use. Aqueous phosphate buffer was prepared by dissolving 0.0681 g of potassium dihydrogen phosphate (KH2PO4) in 450 mL of bidistilled water. It was adjusted to pH 2.0 using 1.0 mL of phosphoric(V) acid (85%) and completed to 500.0 mL with bidistilled water.
Procedure for RP-HPLC
The mobile phase was pumped isocratically at a flow rate of 1.0 mL min−1. The detector wavelength was set at 218 nm. The injection volume was 25 μL. All determinations were performed at ambient temperature (12).
Method’s Validation
The selected method was validated according International Conference on Harmonization guidelines (16). The following validation parameters were assayed: selectivity, linearity, sensitivity, precision, and accuracy.
Calibration Procedure
Stock solution (0.048%) was obtained by dissolving 48.0 mg of IMD in 100.0 mL of methanol. The solution was freshly prepared on the day of analysis and stored at 5°C protected from light until used. Ten standard solutions ranging from 0.002 to 0.480 mg mL−1 (0.002% to 0.048%) were obtained by diluting the stock solution with methanol. Aliquots of 1.0 mL of each standard solution were taken, mixed with 1.0 mL of methanolic solution of IS, and immediately injected onto the chromatographic column. RP-HPLC analysis was conducted in triplicate with 25 μL injections of each standard solution under the conditions described above. The relative peak areas (IMD/IS) were plotted versus corresponding concentrations and calibration curve was obtained. The regression equation was computed using the method of least squares.
Precision and Accuracy
Method’s precision corresponds to the relative standard deviation (RSD) of replicate measurements, while its accuracy is expressed by the percentage of model mixture recovery. Six replicate measurements for three different IMD concentrations (low, c = 0.004%; medium, c = 0.020%; high, c = 0.040%) were performed on three subsequent days using the proposed RP-HPLC method. The appropriate validation parameters were calculated.
Kinetic Studies
Forced ageing test was performed. The accurately weighed samples (0.0100 g) of pure IMD were put into open, amber glass vials and stored according to the following protocol:
The Estimation of Temperature Impact
The impact of temperature was examined at two RH levels: ∼76.4% (obtained by the use of NaCl-saturated aqueous solution bath which according to the literature data ensured the desired RH level (2)) and ∼0% (generated by placing samples in a sand bath). The assumed theoretical range of increased RH in the studies temperatures was within 75.1–76.4%; thus, its variations were considered as negligible (2). The prepared series of samples were incubated at 70°C, 75°C, 80°C, 85°C, and 90°C under RH ∼76.4% and at 90°C, 95°C, 100°C, 105°C, and 110°C under RH ∼0% in heat chambers with the temperature control accuracy of ±1.0 K.
The Estimation of RH Impact
The RH impact was investigated under isothermal conditions within RH range of 25.0–76.4%. The following saturated salt baths were used to obtain the desired RH level: sodium iodide (RH ∼25.0%), sodium bromide (RH ∼50.9%), potassium iodide (RH ∼60.9%), sodium nitrate (RH ∼66.5%), and sodium chloride (RH ∼76.4%). The appropriate solutions of inorganic salts were closed in desiccators and remained in contact with the excess of solid salt throughout the study. IMD samples were introduced into appropriate salt bath and inserted into automatically controlled heat chamber set at 90°C. In order to equilibrate the kinetic test conditions, the prepared salt baths had been incubated at the desired temperature for 24 h prior to the experiment.
Determination of IMD Concentration Changes
Within definite time intervals, determined by the rate of IMD degradation, the vials were withdrawn, cooled to ambient temperature, dissolved in water, quantitatively transferred into volumetric flasks, made up with methanol to a total volume of 25.0 mL, and filtered (solution A). One milliliter of IS was added to 1.0 mL of each solution A (solution Ai). The aliquots of 25 μL of the solutions Ai were injected onto the chromatographic column and the chromatograms were recorded. Basing on the remaining drug concentration (c) calculated from the measured relative peak areas (Pi/PI.S.), the kinetic curves were constructed by the use of least square method:
where Pi represents the area of IMD signal, PI.S. represents the area of IS signal, and t is time. The regression parameters and their statistical analysis were calculated using Microsoft ® Excel 2007 and Statistica 2000 software.
RESULTS
Validation
The selected RP-HPLC method was validated in order to confirm its applicability for this study. Its satisfactory selectivity with regard to IMD was confirmed (Fig. 1) and its linearity was assessed by computing the regression equation and calculation of the correlation coefficient (r = 0.999). The obtained results are summarized in Table I. The data on method’s accuracy and precision are provided in Table II. The following parameters were determined: recovery (percent), relative mean error, and standard deviation. RSD was found to be 0.506%. Limit of detection (LOD) and limit of quantitation (LOQ) were calculated using the following formulae: LOD = 3.3 Sy / a and LOQ = 10 Sy / a, where Sy stands for the standard deviation of the blank signal and a is a slope of the calibration curve. LOD was 0.00174% and LOQ was 0.00526%.
Fig. 1.
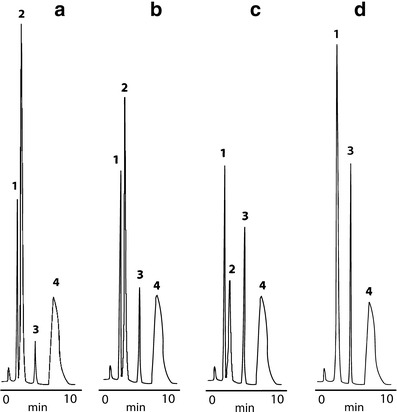
RP-HPLC chromatograms for IMD (3), its degradation products (1, 2), and IS (4) stored at: a RH ∼76.4%, b RH ∼50.9%, c RH ∼25.0%, d RH ∼0%; retention times: IMD tR = 5 min, degradation products tR ∼ 3/2 min (in chromatogram “d,” tR = 3 min), IS tR = 8 min
Table I.
Statistical Analysis of Calibration Curve
| Parameters | |
|---|---|
| Linearity range, % | 0.002–0.0480 |
| Regression equation (Y)a | |
| Slope a ± Δa | 34.02 ± 1.12 |
| Standard deviation of the slope (SDa) | 0.493 |
| Intercept b ± Δb | 0.0007 ± 0.0006 |
| Standard deviation of the intercept (SDb) | 0.012 |
| Standard deviation (SDy) | 0.017 |
| Correlation coefficient (r) | 0.999 |
| n | 10 |
| Rel. std. dev. (%)b | 0.506 |
Rel. std. dev. relative standard deviation
a Y = aX + b, where X is concentration of IMD in percent and Y is the IMD peak area-to-oxymetazoline hydrochloride (IS) peak area ratio
bThree replicate samples
Table II.
Accuracy of the RP-HPLC Method for IMD Determination
| Day of analysis | Nominal concentration (%) | Measured concentration (%) | % recovery | SD | CV (%) |
|---|---|---|---|---|---|
| 0 | 0.004 | 0.00402 ± 0.000021 | 100.50 | 9.50exp-6 | 0.745 |
| 0.020 | 0.02020 ± 0.000014 | 101.00 | 1.98exp-5 | 0.981 | |
| 0.040 | 0.04015 ± 0.000026 | 100.37 | 3.71exp-5 | 0.925 | |
| 1 | 0.004 | 0.00403 ± 0.000029 | 100.75 | 4.06exp-6 | 1.008 |
| 0.020 | 0.02021 ± 0.000013 | 101.05 | 1.90exp-5 | 0.942 | |
| 0.040 | 0.04027 ± 0.000030 | 100.67 | 4.24exp-5 | 1.050 | |
| 2 | 0.004 | 0.00404 ± 0.000032 | 101.00 | 4.42exp-6 | 1.095 |
| 0.020 | 0.02022 ± 0.000012 | 101.10 | 1.63exp-5 | 0.807 | |
| 0.040 | 0.04026 ± 0.000024 | 100.65 | 3.40exp-5 | 0.844 |
SD standard deviation, CV coefficient of variation
Effect of Temperature
The kinetic mechanism of IMD degradation was assessed on the basis of the obtained kinetic curves (Figs. 2 and 3). The results and the corresponding equations for both RH levels are demonstrated in Table III. The degradation rate constants (k) and the thermodynamic parameters of degradation, i.e., energy of activation (Ea), enthalpy of activation (ΔH≠), and entropy of activation (ΔS≠) for IMD degradation, were calculated. It was evidenced that solid-state IMD required an activation energy of 104 ± 24 kJ/mol under humid conditions and 153 ± 28 kJ/mol under dry air conditions to undergo the processes of decomposition.
Fig. 2.
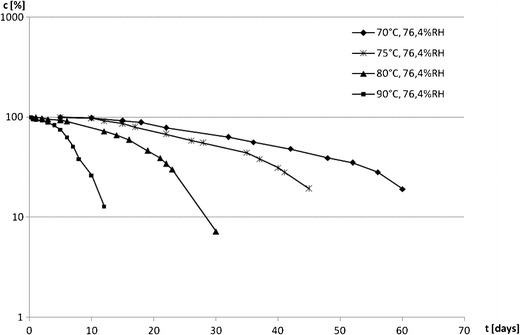
Kinetic curves for solid-state IMD degradation c = f(t) achieved under various thermal conditions
Fig. 3.
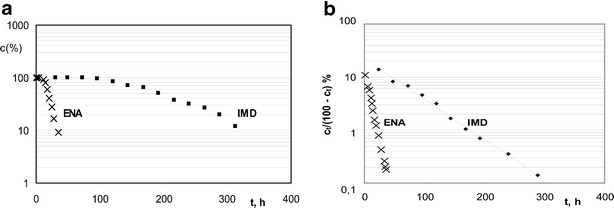
Diagram demonstrating a changes in concentration of IMD and ENA during exposition to humid atmosphere RH ∼76.4% at 90°C and b semilogarithmic plots c t / (c 0 − c t) = f(t) for the degradation of IMD and ENA in solid state at RH ∼76.4% and T = 90°C
Table III.
Kinetic and Thermodynamic Parameters of IMD Decomposition in Solid State
| T (°C)/K | Kinetic parameters | |||
| 106 k ± Δk, s−1 | −r | N | t 0.5 [days] | |
| RH 76.4% | ||||
| 70/343 | 0.734 ± 0.088 | 0.991 | 9 | 40.1 |
| 75/348 | 1.06 ± 0.13 | 0.991 | 9 | 30.8 |
| 80/353 | 2.23 ± 0.27 | 0.991 | 9 | 17.3 |
| 85/358 | 3.59 ± 0.47 | 0.994 | 7 | 16.7 |
| 90/363 | 4.88 ± 0.41 | 0.995 | 10 | 7.3 |
| 20a/293a | (1.36 ± 0.16) × 10−9 | |||
| Statistical evaluation ln k i = f(1/T) | Thermodynamic parameters | |||
| a ± Δa = −12,550 ± 2,827; SDa = 1018 | E a = 104 ± 24 kJ/mol | |||
| b ± Δb = 22 ± 8; SDb = 2.8 | ΔH ≠ = 101 ± 25 kJ/mol | |||
| r = −0.990 | ΔS ≠ = −58 ± 177 J/(K mol] | |||
| RH 0% | ||||
| 90/363 | 0.309 ± 0.033 | 0.991 | 10 | 84.4 |
| 95/368 | 0.653 ± 0.048 | 0.996 | 10 | 37.8 |
| 100/373 | 1.02 ± 0.088 | 0.993 | 11 | 20.9 |
| 105/378 | 2.01 ± 0.10 | 0.997 | 10 | 16.2 |
| 110/383 | 4.88 ± 0.39 | 0.995 | 10 | 4.9 |
| 20a/293a | (1.63 ± 0.23) × 10−12 | |||
| Statistical evaluation ln k i = f(1/T) | Thermodynamic parameters | |||
| a ± Δa = −18,417 ± 3,463; SDa = 1247 | E a = 153 ± 28 kJ/mol | |||
| b ± Δb = 35 ± 9; SDb = 3.3 | ΔH ≠ = 150 ± 31 kJ/mol | |||
| r = −0.993 | ΔS ≠ = 51 ± 167 J/(K mol) | |||
SD a standard deviation of slope regression, SD b standard deviation of value b, r coefficient of linear correlation
aValue was calculated from Arrhenius equation; for RH 76.4% lnk i = (−12,550 ± 2,827) · (1/T [K]) + (22 ± 8) and for RH 0% lnk i = (−18,417 ± 3,463) · (1/T [K]) + (35 ± 9)
Effect of RH
The results demonstrating the effect of RH on IMD stability under various temperatures are demonstrated in Table IV and Figs. 1 and 4.
Table IV.
The Effect of Humidity on the Stability of IMD in Solid State at 90°C
| RH% | 106 k ± Δk [s−1] | −r | n | Parameters of regression ln k i = f (RH%) |
|---|---|---|---|---|
| 25.0 | 0.827 ± 0.046 | 0.997 | 10 | a ± Δa = 0.0338 ± 0.0050 |
| 50.9 | 2.20 ± 0.16 | 0.996 | 10 | SDa = 0.0016 |
| 60.6 | 2.81 ± 0.20 | 0.996 | 10 | b ± Δb = −14.82 ± 0.29 |
| 66.5 | 3.23 ± 0.22 | 0.995 | 10 | SDb = 0.091 |
| 76.4 | 4.88 ± 0.41 | 0.995 | 10 | r = 0.997 |
a slope of regression ln k i = a(RH%) + b, SD a standard deviation of slope regression, SD b standard deviation of value b, r coefficient of linear correlation
Fig. 4.
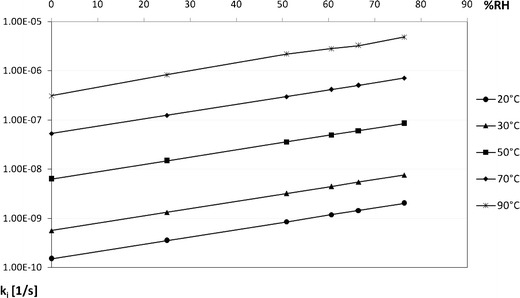
Changes of solid-state IMD degradation rate according to alternating relative humidity levels under different thermal conditions
DISCUSSION
Validation of RP-HPLC Stability-Indicating Method for IMD Analysis
The RP-HPLC method was validated to provide a specific procedure for the rapid, qualitative, and quantitative analysis of IMD degradation samples, aimed at the evaluation of the substrate loss. Importantly, this method was also used previously for the determination of other structurally related ACE-I (5–12). The following validation parameters were examined: selectivity, linearity, precision, LOD, and LOQ. In the chromatograms obtained for the samples stored at RH ∼0%, three sharply developed peaks at reasonable retention times were observed indicating method’s good selectivity. They were attributed to IS, IMD, and the degradation product (Fig. 1d). However, for the samples stored at RH >0%, the incomplete separation of the peaks corresponding to two degradation products was observed (Fig. 1a–c). On this stage of analysis, we suspected that under dry air conditions, one degradation product is formed, while in a humid environment, IMD degrades with the production of two products. Therefore, the developed method could present a limited selectivity with respect to degradation products formed in the presence of moisture and a satisfactory selectivity with regard to parent compound. Thus, since our main target was the evaluation of IMD degradation kinetics basing on the loss of substrate, we accepted this method for further research since it enabled quite favorable conditions for accurate and precise calculations. It is important to emphasize that the problem of incomplete separation of degradation products under RH >0% was extensively analyzed in our further experiments in which we explained that the slight modification of a mobile phase provides a full separation of peaks corresponding to two degradation impurities formed in the course of IMD degradation (10). Linearity was determined in a range of 0.002–0.0480% (that is 5–120% of IMD nominal concentration used in the stability study). The calibration graph was obtained and the corresponding calibration equation was computed as Y = aX + b, where Y represents the ratio of IMD to IS peak area and X represents IMD concentration in percent. A high value of a correlation coefficient confirmed method’s linearity in the studied range (Table I). The method was also characterized by reasonable repeatability (satisfactory RDS), sensitivity (acceptable LOQ and LOD), and good accuracy and precision (recovery ∼100%).
Kinetic Parameters of IMD Decay
The estimation of kinetic order of IMD degradation was performed by calculating the percentage of remaining drug concentration in the studied samples after their exposure to increasing temperatures at high (∼76.4%) and low (∼0%) RH levels for different time intervals. Similar analytical protocol was utilized in the studies with other structurally related ACE-I which enabled a more reliable comparison of the results for the available compounds (5–11). In fact, a gradual loss of IMD content in the studied samples with time was observed. The obtained kinetic curves representing IMD concentration versus time, ct = f(t) (Fig. 2), were characterized by their sigmoid shape with three distinct reaction phases, including an initial slow phase followed by a rapid phase, which finally led the reaction to its completion. This seems analogous to the three-phase autocatalytic reaction model distinguished by its initiation, acceleration, and termination period in which the formed degradation product acts as a reaction catalyst and its formation accelerates the reaction rate. Thus, to confirm our assumptions, the mathematical model fitting was performed, and indeed, the observed experimental data were found to be a good fit to the theoretical autocatalytic model at all temperatures (r > 0.991), described by a Prout–Tompkins relationship (17):
where c0 and ct represent concentration of IMD at time points 0 and t, C is induction period, and k stands for degradation rate constant (second−1). The least squares method was used to calculate the regression parameters y = ax + b, a ± Δa, and b ± Δb, standard errors Sa, Sb, and Sy, and the correlation coefficient r. The ±Δa and ±Δb were estimated for f = n − 2 degrees of freedom and α = 0.05. It is important to emphasize that only the points attributed to the acceleration period were considered in the mathematical interpretation of our experimental conditions. For this reason, it can be generally stated that under the applied analytical conditions, the process of IMD decay follows the autocatalytic reaction kinetics, which is characterized by two parameters, i.e., length of the induction period and the reaction rate constant calculated for the data obtained for the acceleration phase. The length of the induction period was demonstrated graphically and its gradual reduction with the increase of temperature was observed, indicating that the decreasing IMD stability correlates with the elevation of this parameter (Fig. 2). In addition, the linear, semilogarithmic plots, obtained by the application of Prout–Tompkins equation enabled the calculation of the reaction rate constants (k) which correspond to the slope of the analyzed function (Fig. 3). The increasing values of k further confirm that with the increase of temperature, the stability of IMD declines. Table III summarizes the rate constants, half-lives, and correlation coefficients obtained for each investigated temperature condition. It is also worth mentioning that in our further studies, in which we identified two degradation products formed in the course of IMD decay under humid environment, the detailed analysis of their formation kinetics was performed. We evidenced that both impurities, referred as DKP and imidaprilat, were formed simultaneously, according to the parallel reaction, and their calculated formation rate constants were not statistically different. Additionally, their formation occurred according to the autocatalytic kinetics, as indicated by the sigmoid kinetic curves which were a good fit to the theoretical Prout–Tompkins model (10).
Finally, it was established that within the studied therapeutic class (ACE-I), different degradation mechanisms under similar study conditions occur. IMD and ENA decompose according to the autocatalytic reaction model. MOXL and BEN degradation accord with pseudo-first-order kinetics under dry air conditions and first-order kinetics in humid environment. QHCl decomposes according to first-order kinetics, irrespective of RH conditions. By analyzing the available kinetic data (5–11), it can be concluded that the stability within this therapeutic class under the conditions of 90°C and RH ∼76.4% decreases in the following order: BEN (t0.5 = 110 days) > IMD (t0.5 = 7.3 days) > MOXL (t0.5 = 58 h) > ENA (t0.5 = 35 h) > QHCl (t0.5 = 27.6 h), suggesting that BEN is the most stable agent in this group. These differences are probably caused by their structural characteristics and protective properties of corresponding functionals in IMD and BEN molecules.
Thermodynamic Parameters of IMD Decay
The effect of temperature on IMD degradation rate was studied by conducting the reaction at five different temperatures under RH ∼0% and RH ∼76.4%. For each series of samples, a degradation rate constant (k) was elucidated and the natural logarithm of each k was plotted against the reciprocal of the corresponding temperature to fulfill the Arrhenius relationship:
where ki is the reaction rate constant (second−1), A is frequency coefficient, Ea is activation energy (joules per mole), R is universal gas constant (8.3144 J K−1 mol−1), and T is temperature (Kelvin). For both RH levels, the straight line plots ln ki = f(1 / T) were obtained, described by the following relationships which show that the increase of temperature accelerates the IMD degradation rate:
The corresponding statistical analysis of each regression is provided in Table III. The obtained k values were the basis for the estimation of the IMD half-life (t0.5) under various thermal conditions provided in Table III. Figure 5 demonstrates graphically the variations of t0.5 according to the applied environment, indicating that both temperature and RH similarly affect IMD stability.
Fig. 5.
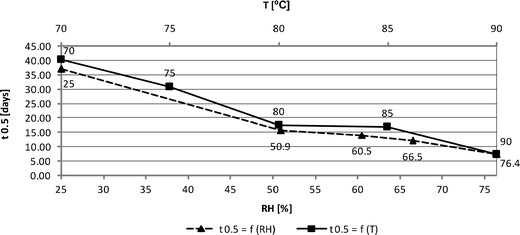
Impact of relative humidity and temperature on the half-life of solid-state IMD
Based on the transition state theory, also the energy of activation (Ea), enthalpy of activation (ΔH≠), and entropy of activation (ΔS≠) under temperature of 20°C and RH ∼76.4% and ∼0% were determined using the following equations (2):
where a is the slope of ln ki = f(1 / T) straight line, A is a frequency coefficient, Ea is activation energy (joules per mole), R is universal gas constant (8.3144 J K−1 mol−1), T is temperature (Kelvin), ΔS≠ is the entropy of activation (joules per Kelvin per mole), ΔH≠ is enthalpy of activation (joules per mole), K is Boltzmann constant (1.3806488(13) × 10−23 J K−1), and h is Planck’s constant (6.62606957(29) × 10–34 J s). The calculated Ea describes the strength of the cleaved bonds in IMD molecule during degradation. It was found to be 153 ± 28 kJ mol−1 for RH ∼0% and 104 ± 24 kJ mol−1 for RH ∼76.4%, which are comparatively high values for esters (Table III). This can be explained by possible protective properties of 1-methyl-2-oxoimidazolidine functional on IMD molecule (Fig. 3). However, under elevated RH conditions, the rate of IMD degradation increases, which is evidenced by lower Ea and ΔH≠ when compared to the corresponding values calculated for RH ∼0%. This suggests that the stability of IMD deteriorates in high moisture environment. The positive ΔH≠ indicates an endothermic character of the observed reactions, which means that there is a need for constant energy supply during the formation of the activated complex from the reagents. The ΔS≠ value provides information on the thermodynamic equilibrium of the system while forming activated complex. For the reaction conducted under RH ∼76.4%, ΔS≠ is slightly negative and equals to ΔS≠ = -58 ± 177 J/(K mol), which is unfavorable from thermodynamic point of view. This suggests a bimolecular character of the reaction and indicates that the activated complex is characterized by a higher degree of arrangement compared to the initial substance. For the reaction conducted under RH ∼0.0%, ΔS≠ was found to be 51 ± 167 J/(K mol) indicating that the activated complex was less constrained than the individual reagents. The differences in thermodynamic profiles of these two reactions could be due to their different pathways, suggesting that depending on RH level, different degradation products could be formed, which is in agreement with our observations of different chromatograms under RH ∼0% and RH >0%. In fact, under humid conditions, ester hydrolysis and intramolecular cyclization have been already reported (10). Under dry air conditions, cyclization between neighboring amino acids resulting in the formation of diketopiperazine derivative is possible, similarly to MOXL (6). This hypothesis, however, must be confirmed in appropriate degradation studies.
Influence of Humidity on the Stability of IMD
The effect of RH on the stability of IMD was investigated at 90°C, within RH range of 25.0–76.4%. The natural logarithm of the measured degradation rate constants was plotted against the corresponding RH values, and the following linear relationship was obtained:
It was demonstrated that the increase of RH intensifies IMD degradation, while under low RH levels, IMD shows longer half-life (Figs. 1 and 5). The reaction rate constant (ki) increases exponentially with RH (Table IV and Fig. 4). This supports the conclusions drawn on the basis of thermodynamic parameters analysis. The sensitivity to relative humidity changes is varied within ACE-I class and it increases in the following order: BEN >ENA > IMD > QHCl > MOXL, indicating that MOXL is the most sensitive to RH variations (5–10).
Relationship Between T, RH, and k for IMD Degradation Under Humid Conditions
Basing on the established linear semilogarithmic relationships f(RH) = lnki and f(1/T) = lnki, the surface of solid-state IMD degradation was constructed. It is described by the following equation:
and it demonstrates the three-dimensional relationship between logarithm of degradation rate constants versus relative humidity and the reciprocal of temperature (Fig. 6). The provided equation enables the prediction of the degradation rate constant for solid-state IMD using easy-to-measure values of drug storage. On the basis of the established relationship between k, T, and RH, the IMD degradation rate constants were calculated for the following conditions:
Fig. 6.
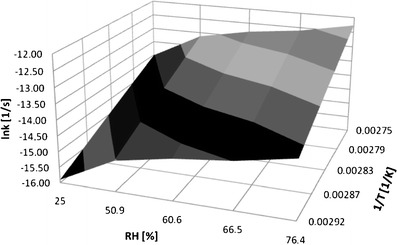
Three-dimensional relationship between temperature (T), relative humidity (RH), and degradation rate constant (k) for solid-state IMD degradation under humid conditions
The applicability of the proposed approach was confirmed by the statistical analysis for the equality of regression between the experimental and theoretical parameters which evidenced no significant differences between these values, since t(α = 0.05) > | t |.
Real Storage Conditions
In order to demonstrate the solid-state IMD stability behavior under real storage conditions, we performed the 2-year observations of the sample stored in ambient temperature (T ∼20°C) and room humidity (RH ∼55%), and within this time interval, we have observed no loss of pure IMD content (Fig. 7). This indicates that t0.05 for solid-state IMD under these conditions is longer than the observational period.
Fig. 7.
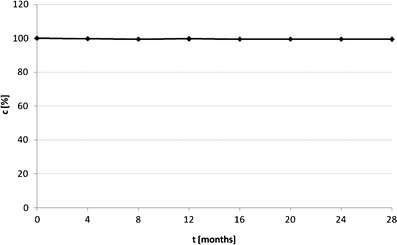
Impact of real storage conditions on the stability of pure solid-state IMD (T ∼20°C, RH ∼55%)
Analysis for Structure–Stability Relationship for ENA and IMD
The enhanced stability analysis for a whole group of ACE-I implicates some suggestions on structure–stability relationship within this therapeutic class. IMD and ENA (Fig. 8) are the most structurally related ACE-I, but when comparing their stability data, better parameters are observed for IMD. ENA is less susceptible to hydrolysis and in the course of degradation it produces only DKP derivative irrespective of RH conditions, while IMD in high moisture environment undergoes both hydrolysis and cyclization (5, 10). Both compounds’ degradation follows the autocatalytic reaction order (Fig. 3), suggesting that their slight structural differences do not influence their degradation mechanism. Nevertheless, ENA is more fragile (k = 3.350 ± 0.24 × 10⁻⁵ s−1) than IMD (k = 4.889 ± 0.41 × 10⁻⁶ s−1; T = 90°C, RH ∼76.4%) (5). This means that under these conditions, IMD’s half-life is 177 h (7.4 days; Table III) while of the ENA’s is only 35 h (5). To explain this phenomenon, a structural analysis of both compounds is necessary (Fig. 8). ENA is a piroline derivative while IMD has a 1-methyl-2-oxoimidazolidine functional which seems to have some protective properties on IMD molecule causing the reduction of its reactivity. Imidazolidine ring is thought to stabilize IMD particularity in its trans form and to prevent the molecule from rotating. This explains its more favorable stability profile when compared to ENA and puts into consideration the utility of these compounds. Both of them are characterized by comparable efficiency. The clinical data imply that they are equally effective in reducing blood pressure after once daily administration in a dose 5–10 mg, yet IMD was shown to be better tolerated, with lower incidence of cough as a side effect (18, 19). Additionally, IMD therapy is less expensive than the reference therapy with ENA (20). These data seem to favor IMD as preferred alternative to ENA and they could be of some clue for manufacturers and healthcare providers on lowering the costs and increasing the quality of antihypertensive treatment.
Fig. 8.

Chemical structures of a imidapril hydrochloride and b enalapril maleate
CONCLUSION
It was finally concluded that the main factor contributing to IMD instability in solid state is moisture presence, which significantly increases its rate of decomposition. The calculated thermodynamic parameters clearly demonstrate the lower value of energy of activation (Ea = 104 ± 24 kJ mol−1) under the increased RH level in comparison with the corresponding results obtained for the environment of dry air (Ea = 153 ± 28 kJ/mol). Humidity presence, however, has no influence on the mechanism of IMD degradation—in both cases, the autocatalytic reaction occurred. Pure IMD as well as its pharmaceutical formulations must, therefore, be stored in tightly closed containers and protected from moisture, and for technological process, the low humidity conditions should be ensured. As for structure–stability relationship, the 1-methyl-2-oxoimidazolidyne functional acts as molecule stabilizer suggesting that IMD could be a better alternative to other structurally related ACE-I.
ACKNOWLEDGMENTS
This work was supported by a Polish grant no. 502-01-03305411-05995.
Conflict of Interest
The authors report no declarations of interest.
REFERENCES
- 1.International Conference on Harmonization (ICH). Stability testing of new drug substances and products Q1A (R2). 2003. http://www.emea.europa.eu/docs/en_GB/document_library/Scientific_guideline/2009/09/WC500002651.pdf. Accessed 7 Feb 2012.
- 2.Pawełczyk E, Hermann T. The fundamentals of stability of drugs. Warsaw: PZWL; 1982. [Google Scholar]
- 3.Stojiljkovic L, Behnia R. Role of renin angiotensin system inhibitors in cardiovascular and renal protection: a lesson from clinical trials. Curr Pharm Des. 2007;13:1335–1345. doi: 10.2174/138161207780618768. [DOI] [PubMed] [Google Scholar]
- 4.Zając M, Pawełczyk E, Jelińska A. Pharmaceutical chemistry for pharmacy students. 2. Poznań: Poznan University of Medical Sciences; 2006. [Google Scholar]
- 5.Stanisz B. Evaluation of stability of enalapril maleate in solid phase. J Pharm Biomed Anal. 2003;31:375–380. doi: 10.1016/S0731-7085(02)00325-4. [DOI] [PubMed] [Google Scholar]
- 6.Stanisz B. The influence of relative humidity and temperature on stability of moexipril hydrochloride in solid phase. Acta Pol Pharam. 2004;61:91–97. [PubMed] [Google Scholar]
- 7.Stanisz B. The stability of quinapril hydrochloride—a mixture of amorphous and crystalline forms (QHCl-AC) in solid phase. Acta Pol Pharam. 2003;60:443–450. [PubMed] [Google Scholar]
- 8.Stanisz B. Kinetics and degradation of quinapril hydrochloride in tablets. Pharmazie. 2003;58:249–251. [PubMed] [Google Scholar]
- 9.Stanisz B. Liquid chromatographic studies of the stability of benazepril in pure form and in tablets. J Liq Chromatogr Relat Technol. 2005;27:3103–3119. doi: 10.1081/JLC-200032748. [DOI] [Google Scholar]
- 10.Regulska K, Stanisz B. Kinetics and mechanism of solid state imidapril hydrochloride degradation and its degradation impurities identification. Cent Eur J Chem. 2013;11:754–762. doi: 10.2478/s11532-013-0212-9. [DOI] [Google Scholar]
- 11.Stanisz B, Regulska K, Kania J, Garbacki P. Effect of pharmaceutical excipients on the stability of angiotensin-converting enzyme inhibitors in their solid dosage formulations. Drug Dev Ind Pharm. 2013;39:51–61. doi: 10.3109/03639045.2012.657644. [DOI] [PubMed] [Google Scholar]
- 12.Stanisz B, Regulska K, Kolasa K. UV derivative spectrophotometric and RP-HPLC methods for determination of imidapril hydrochloride in tablets and for its stability assessment in solid state. Acta Pol Pharam. 2011;68:645–651. [PubMed] [Google Scholar]
- 13.Matsuoka M, Horimoto S, Mabuchi M, Banno K. Determination of three metabolites of a new angiotensin-converting enzyme inhibitor, imidapril, in plasma and urine by gas chromatography–mass spectrometry using multiple ion detection. J Chromatogr. 1992;581:65–73. doi: 10.1016/0378-4347(92)80448-y. [DOI] [PubMed] [Google Scholar]
- 14.El Yazbi FA, Mahrous ME, Hammud HH, Sonji GM, Sonji NM. Kinetic spectrophotometric determination of betaxolol, clopidogrel and imidapril in pharmaceutical preparations. Curr Anal Chem. 2010;6:228–236. doi: 10.2174/157341110791517007. [DOI] [Google Scholar]
- 15.Yamanaka K, Morikawa S, Murata K, Banno K, Sato T, Takai T, et al. Radioimmunoassay for imidapril, a new angiotensin-converting enzyme inhibitor, and imidaprilat, its active metabolite, in human plasma and urine. J Pharm Biomed Anal. 1996;14:281–287. doi: 10.1016/0731-7085(95)01595-7. [DOI] [PubMed] [Google Scholar]
- 16.International Conference on Harmonization (ICH). Validation of analytical procedures: text and methodology Q2 (R1). 2005. http://www.ich.org/fileadmin/Public_Web_Site/ICH_Products/Guidelines/Quality/Q2_R1/Step4/Q2_R1__Guideline.pdf. Accessed 7 Feb 2012.
- 17.Khawam A, Flanagan DR. Solid-state kinetic models: basics and mathematical fundamentals. J Phys Chem B. 2006;110:17315–17328. doi: 10.1021/jp062746a. [DOI] [PubMed] [Google Scholar]
- 18.Saruta T, Omae T, Kuramochi M, Iimura O, Yoshinaga K, Abe K, et al. Imidapril hydrochloride in essential hypertension: a double blind comparative study using enalapril maleate as a control. J Hypertens. 1995;13(suppl 3):S23–S30. doi: 10.1097/00004872-199509003-00005. [DOI] [PubMed] [Google Scholar]
- 19.Saruta T, Omae T, Iimura O, et al. A multicenter comparative study of the usefulness and incidence of cough with imidapril and enalapril. J New Remedies Clin. 1998;47:249–282. [Google Scholar]
- 20.National Health Service Scotland. Cost comparisons of ACE inhibitors and angiotensin II antagonists prices from drug tariff and BNF as of July 2003. http://www.fifeadtc.scot.nhs.uk/formulary/support%20info/ACE_and_Angiotensin_II.pdf. Accessed 16 Oct 2012.


